Abstract
A recent method for calibrating single-element, focused passive cavitation detectors (PCD) compares bistatic scattering measurements by the PCD and a reference hydrophone. Here, effects of scatterer properties and PCD size on frequency-dependent receive calibration accuracy are investigated. Simulated scattering from silica and polystyrene spheres was compared for small hydrophone and spherically focused PCD receivers to assess the achievable calibration accuracy as a function of frequency, scatterer size, and PCD size. Good agreement between measurements was found when the scatterer diameter was sufficiently smaller than the focal beamwidth of the PCD; this relationship was dependent on the scatterer material. For conditions that result in significant disagreement between measurements, the numerical methods described here can be used to correct experimental calibrations.
1. Introduction
A variety of ultrasound-based therapeutic and drug delivery applications are enhanced by bioeffects associated with acoustic cavitation.1,2 Acoustic emissions emanating from cavitation events are commonly monitored using a single-element transducer as a passive cavitation detector (PCD). Spectral analysis of PCD-measured emissions is used to identify distinct frequency content associated with the dynamic response of a cavitating bubble and quantify the occurrence3 and relative intensity4 of specific cavitation activity. However, analyzed signals are typically acquired as system-dependent measurements influenced by frequency responses of the PCD and receiving system, so that direct comparison of PCD-measured emissions with results from different receiving systems or numerical models is not possible. Such comparisons require absolute, system-independent measurements of cavitation emissions using a PCD and receiving system of known sensitivity.
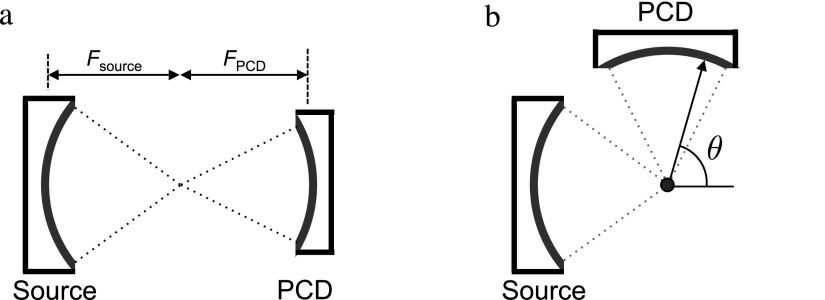
In comparison to unfocused transducers, focused single-element transducers are often employed as PCDs due to their high sensitivity and spatial specificity within their focal regions.2 Methods to calibrate the absolute receive sensitivity of focused PCDs have recently been proposed using scattering5 and pitch-catch6 measurement configurations. Both techniques require that an approximately constant-phase wave is measured by the uncalibrated PCD, so that the received signal is proportional to the absolute pressure measured by a substituted calibrated hydrophone. For the pitch-catch method, this is achieved by configuring the receiver with a focused source in a confocal and coaxial alignment, as shown in Fig. 1(a), using the transmit focus to mimic a radiator at the focus of the PCD. This calibration approach has been shown, by comparing simulated PCD- and hydrophone-measured pressures over a broad frequency range, to enable accuracy within ±1 dB for configurations with a source of equivalent or smaller f-number than the PCD.
Fig. 1.
Calibration measurement configurations. (a) Pitch-catch method with two transducers coaxially and confocally aligned, separated by the sum of focal lengths . The transmitted wave is measured by the PCD and compared with the spatially averaged pressure amplitude measured by a reference hydrophone. (b) Bistatic scattering substitution method with source and PCD confocally and orthogonally aligned with a spherical scatterer. Scattering of the source's field by the sphere is measured by a PCD centered at scattering angle and compared with the pressure measured by a reference hydrophone at the same angle.
In receive calibrations using scattering, a wave scattered by a small sphere has been measured by the uncalibrated receiver and the scattered signal amplitude compared to a calculated7 or measured5 reference pressure. A bistatic substitution technique, schematically shown in Fig. 1(b), has recently been employed to calibrate a focused PCD relative to a reference hydrophone.5 This calibration method is accurate if the signal amplitudes measured by the PCD and hydrophone are proportional; however, because sound is scattered directionally, this accuracy will vary as a function of PCD geometry, scatterer properties, and frequency. Here these effects were numerically investigated by simulating PCD- and hydrophone-measured signals using scattering theory for elastic spheres8–10 and comparing these signals to determine the influence of PCD geometry, scatterer size and material, and frequency on the accuracy of this calibration method.
2. Method
Measurements to calibrate the receive sensitivity of a PCD using a bistatic scattering substitution method have previously been made using the measurement system shown in Fig. 1(b).5 A focused source is used to produce an acoustic pulse directed at a small spherical scatterer, and the scattered wave is measured by a confocally aligned PCD. A reference pressure measurement is made by substituting the PCD with a calibrated needle hydrophone. The receive sensitivity of the PCD is then determined by comparing the voltage of its measured scattering signal to the absolute pressure measured by the hydrophone. However, the accuracy of this calibration depends on the assumed equivalence between the hydrophone-measured scattered pressure and the scattered pressure spatially averaged by the PCD's active surface.
Here, pressure signals received by a PCD and hydrophone were simulated to represent measurements in the configuration of Fig. 1(b) by calculating the frequency- and angle-dependent pressure scattered by a single sphere using an exact orthogonal function expansion8,9 in matlab (R2014b, MathWorks, Natick, MA) using publicly available code.10 Scatterers were simulated as solid spheres composed of an isotropic, linearly elastic material and were assumed to be much smaller in diameter than the focal beamwidth of the source so that the wave incident on the sphere could be approximated as a plane wave. Scattered pressure was calculated as a function of the polar scattering angle θ and the dimensionless wavenumber kas, relative to the sphere radius and the wavenumber of sound in 25 °C water. The focal length of the PCD, equal to its distance from the scatterer, was assumed great enough that the PCD surface resided in the far field of the simulated scattered wave. The frequency- and angle-dependent complex pressure received at the PCD surface was calculated using the far-field form function of the scattered wave.9 For a given PCD, the range of angle-dependent scattered pressures calculated across the PCD's surface was geometrically determined by its f-number NPCD, such that θ varied between . The frequency-dependent amplitude of the pressure received by a PCD was calculated as the average of the complex scattered pressure across its surface as
| (1) |
To represent the pressure received by a small-diameter hydrophone, the complex pressure scattered at was calculated as a function of kas.
The scattered pressure measured by PCDs of f-number 0.5–8 and the corresponding point measurements representing a small-diameter hydrophone were calculated for spherical scatterers composed of silica (sound speed c = 5968 m/s, density g/cm3, Poisson ratio ) and polystyrene (c = 2350 m/s, g/cm3, ), representing relatively rigid and compressible materials, respectively. Normalized sphere sizes of kas up to 15 were investigated, corresponding approximately to frequencies in the megahertz range and scattering spheres of micron-scaled radii, consistent with previous calibration measurements using scattering techniques.5,7 For both scatterer types, simulations of the spatially averaged PCD-measured and corresponding hydrophone-measured pressures were compared to test the equivalence of these measurements, and thus the achievable accuracy of calibrations using bistatic scattering substitution methods, as a function of frequency, PCD geometry, and scatterer type and size.
3. Results
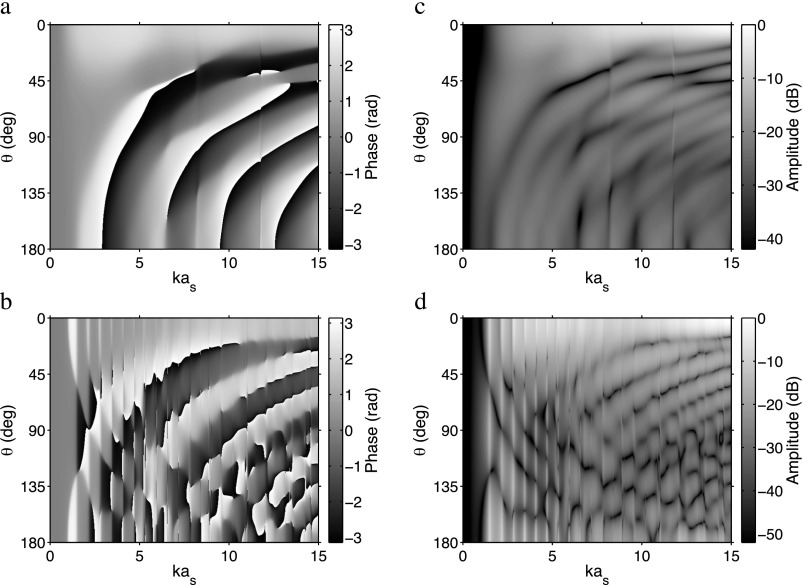
Figure 2 illustrates the far-field scattered waves from silica and polystyrene spheres as a function of kas and scattering angle θ. The scattered field phase is shown in Figs. 2(a) and 2(b), while the scattered field amplitude is shown in Figs. 2(c) and 2(d) as decibel-scaled values relative to the maximum scattered pressure. For both scatterer types, the directivity of scattered sound becomes more complex with increasing kas with greater angle-dependent variations in phase and amplitude. Thus, except over a limited range of relatively low kas values, the scattered pressure measured by a small hydrophone at will substantially differ from that measured by low f-number PCDs, represented by spatial averaging over a broader range of scattering angles about . For PCDs of higher f-number, corresponding to a narrower range of scattering angles about , PCD- and hydrophone-measured pressures will correspond accurately for larger values of kas.
Fig. 2.
The phase and amplitude of the far-field scattered pressure by a silica [(a) and (c)] and polystyrene [(b) and (d)] sphere, respectively, are shown as a function of kas for scattering angles θ of 0–180°. Pressure amplitude values are shown as decibel-scaled values relative to the maximum calculated pressure. The frequency-dependent wave measured across the surface of a PCD with f-number NPCD corresponds to scattering angles centered at , the location of hydrophone measurements, and varying between .
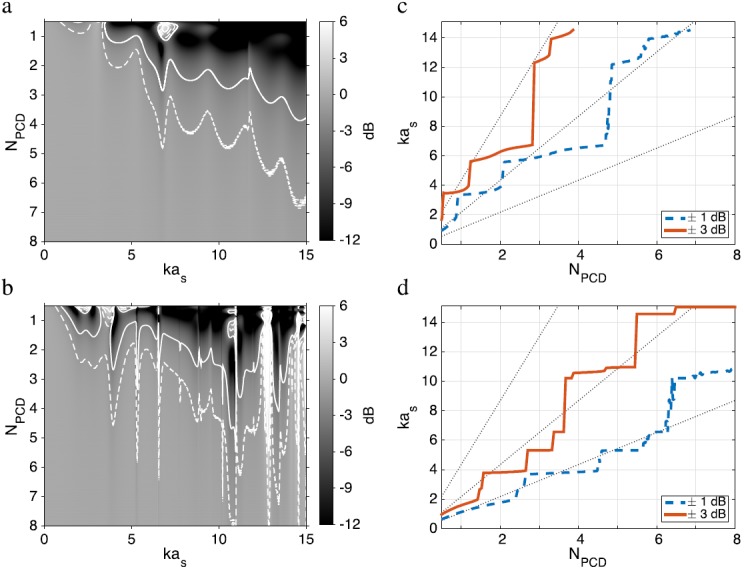
Shown in Figs. 3(a) and 3(b) are decibel-scaled amplitude ratios of the simulated PCD-measured scattered pressure to the simulated hydrophone-measured pressure for silica and polystyrene spheres as a function of kas and PCD f-number. Dashed and solid lines in each figure show contours of amplitude ratios ±1 and ±3 dB as representative accuracy limits. Within these representative accuracy limits for both scatterer types, the viable range of kas for accurate calibration increases with PCD f-number. For any given PCD f-number, the silica scatterer enables higher calibration accuracy over a greater range of sphere sizes.
Fig. 3.

(Color online) (a) Decibel-scaled ratio of simulated PCD-measured to hydrophone-measured pressure for a silica glass sphere as a function of normalized sphere size kas and PCD f-number NPCD. Dashed and solid lines indicate kas values resulting in ratios ±1 or ±3 dB, respectively. (b) Corresponding pressure ratios and contours for a polystyrene sphere. (c) Minimum kas values exceeding pressure ratios of ±1 dB (solid line) and ±3 dB (dashed line) for a silica sphere, as a function of NPCD. Dotted lines indicate kas values corresponding to scatterer diameters 1, 1/2, and 1/4 the corresponding −6 dB PCD beamwidth. (d) Corresponding plots for a polystyrene sphere.
Shown in Figs. 3(c) and 3(d) are the minimum kas values resulting in amplitude ratios greater than ±1 and ±3 dB for a silica and polystyrene scatterer, respectively. For comparison, dotted lines in each plot show kas values associated with sphere diameters equal to 1, 1/2, and 1/4 of the PCD's −6 dB focal beamwidth as a function of its f-number. The −6 dB beamwidth at the focus of the PCD was calculated under the Fresnel approximation as , where NPCD is the PCD f-number and λ is the wavelength. For both scatterers, the maximum sphere size for PCD calibration within a given accuracy limit can be approximately expressed as a fraction of the −6 dB PCD beamwidth. For a silica scatterer [Fig. 3(c)], to maintain ±1 dB agreement between PCD and hydrophone measurements, the sphere diameter must be less than about 1/2 PCD beamwidth over the frequency range of interest. To maintain ±3 dB agreement, the silica sphere diameter must be less than about one PCD beamwidth. To maintain ±1 and ±3 dB agreement between measurements for the polystyrene scatterer [Fig. 3(d)], the sphere diameter must be less than approximately 1/4 and 1/2 PCD beamwidth, respectively.
4. Discussion
In this study, a bistatic scattering substitution method for calibrating the absolute, broadband receive sensitivity of a PCD was numerically investigated. The accuracy of this method was shown to be sensitive to the calibration frequency, PCD dimensions, and scatterer size and material. Best calibration accuracy is achieved when the scattered wave has approximately constant phase and amplitude at the PCD surface, corresponding to lower ultrasound frequencies, higher PCD f-numbers, and smaller scatterers. In particular, for a given scatterer type and frequency, if the sphere diameter is sufficiently smaller than the focal beamwidth of the PCD, the received pressure will match that measured by the hydrophone with relatively high accuracy.
Accuracy limitations were shown to be induced by non-uniform scattering from a silica and polystyrene sphere, resulting in discrepancies between the pressure averaged across the PCD surface and the pressure received by the corresponding small hydrophone. This discrepancy was shown to increase in magnitude as the PCD f-number decreases and as the frequency or scatterer diameter increases. Within limits of acceptable accuracy, represented in Fig. 3 as ±1 and ±3 dB ratios between PCD- and hydrophone-measured pressures, broadband calibration measurements could be conducted for any given PCD geometry with careful consideration of the scatterer material and size. In general, accurate calibrations are feasible over wider frequency ranges for larger PCD f-numbers and for more rigid scattering materials.
For the calibration reported by Collin and Coussios,5 a PCD with a focal beamwidth of approximately 400 μm at 20 MHz, the highest investigated frequency, was calibrated using a 100 μm diameter silica sphere. The sphere diameter was thus approximately 1/4 of the focal beamwidth at the highest frequency calibrated. The simulation results shown here suggest that the accuracy of this calibration over the investigated bandwidth was relatively high with agreement between PCD- and hydrophone-measured pressures likely less than ±1 dB.
In cases causing large discrepancies between PCD and hydrophone pressure measurements, calibration accuracy may be improved by numerical correction of the calibration methods if the properties of the scatterer are known. A correction could be implemented by computing the ratio of the simulated scattered pressure across the PCD to that of the hydrophone, as shown here in Fig. 3(a) and 3(b), over the kas range of interest for the specific PCD and scatterer. Using this calculated ratio, measured values could be numerically compensated to improve calibration accuracy. Additionally, the reference scattered pressure could be simulated instead of measured with scaling based on hydrophone measurements of the incident wavefield at the sphere location, similar to a method used to calibrate phased array transducers.7
Another recently investigated PCD calibration approach is a pitch-catch substitution method that also utilizes three transducers: a focused PCD, a reference hydrophone, and a focused source aligned confocally and coaxially.6 Because the PCD and hydrophone directly measure the transmit beam of the source, the acquired signals provide relatively high signal-to-noise ratio (SNR) over a broad frequency range, limited mainly by the combined bandwidth of the transmit-receive transducer pair. In contrast, the bistatic scattering substitution technique employs a scattered wave with amplitude much smaller than the incident wave, resulting in lower SNR and thus potential limitations in useful bandwidth. The rapid decrease in measurement accuracy at higher frequencies that occurs with the bistatic scattering substitution technique, as shown here in Fig. 3, does not occur for the pitch-catch substitution method, as long as the focused source employed has an f-number equal to or smaller than the PCD f-number.6 Accurate broadband PCD calibrations are feasible with either method as long as appropriate consideration is given to the frequency range of interest, to transducer geometries, and to scatterer properties for the bistatic scattering substitution method.
Acknowledgments
This research was supported by the Mayfield Education and Research Foundation and by National Institutes of Health Grant No. R01 CA158439. The authors thank Kevin Haworth for valuable insight and discussions that greatly assisted this research.
References and links
- 1. Wu J. and Nyborg W. L., “ Ultrasound, cavitation bubbles and their interaction with cells,” Adv. Drug Deliv. Rev. 60(10), 1103–1116 (2008). 10.1016/j.addr.2008.03.009 [DOI] [PubMed] [Google Scholar]
- 2. Coussios C. C., Farny C. H., ter Haar G. R., and Roy R. A., “ Role of acoustic cavitation in the delivery and monitoring of cancer treatment by high-intensity focused ultrasound (HIFU),” Int. J. Hypertherm. 23, 105–120 (2007). 10.1080/02656730701194131 [DOI] [PubMed] [Google Scholar]
- 3. King D. A., Mallow M. J., Roberts A. C., Haak A., Yoder C. C., and W. D. O'Brien, Jr. , “ Determination of postexcitation thresholds for single ultrasound contrast agent microbubbles using double passive cavitation detection,” J. Acoust. Soc. Am. 127(6), 3449–3455 (2010). 10.1121/1.3373405 [DOI] [PMC free article] [PubMed] [Google Scholar]
- 4. Hitchcock K. E., Ivancevich N. M., Haworth K. J., Caudell Stamper D. N., Vela D. C., Sutton J. T., Pyne-Geithman G. J., and Holland C. K., “ Ultrasound-enhanced rt-PA thrombolysis in an ex vivo porcine carotid artery model,” Ultrasound Med. Biol. 37(8), 1240–1251 (2011). 10.1016/j.ultrasmedbio.2011.05.011 [DOI] [PMC free article] [PubMed] [Google Scholar]
- 5. Collin J. R. and Coussios C. C., “ Quantitative observations of cavitation activity in a viscoelastic medium,” J. Acoust. Soc. Am. 130(5), 3289–3296 (2011). 10.1121/1.3626156 [DOI] [PubMed] [Google Scholar]
- 6. Rich K. T. and Mast T. D., “ Methods to calibrate the absolute receive sensitivity of single-element, focused transducers,” J. Acoust. Soc. Am. 138(3), EL193–EL198 (2015). 10.1121/1.4929620 [DOI] [PMC free article] [PubMed] [Google Scholar]
- 7. Sboros V., Pye S. D., MacDonald C. A., Gomatam J., Moran C. M., McDicken W. N., Hallow D. M., Mahajan A. D., McCutchen T. E., and Prausnitz M. R., “ Absolute measurement of ultrasonic backscatter from single microbubbles,” Ultrasound Med. Biol. 31(8), 1063–1072 (2005). 10.1016/j.ultrasmedbio.2005.04.018 [DOI] [PubMed] [Google Scholar]
- 8. J. J. Faran, Jr. , “ Sound scattering by solid cylinders and spheres,” J. Acoust. Soc. Am. 23, 405–418 (1951). 10.1121/1.1906780 [DOI] [Google Scholar]
- 9. Hickling R., “ Analysis of echoes from a solid elastic sphere in water,” J. Acoust. Soc. Am. 34, 1582–1592 (1962). 10.1121/1.1909055 [DOI] [Google Scholar]
- 10. Anderson M. E., “ Faran model solution” (1999). Information available at <http://www.ieee-uffc.org/ultrasonics/software-faran.asp> (Last viewed October 29, 2015).


