

Abstract
The use of different nanocarriers for delivering hydrophobic pharmaceutical agents to tumor sites has garnered major attention. Despite the merits of these nanocarriers, further studies are needed to improve their drug loading capacities (which are typically <10%) and reduce their potential systemic toxicity. Therefore, the development of alternative self-carried nanodrug delivery strategies without using inert carriers is highly desirable. In this study, we developed a self-carried curcumin (Cur) nanodrug for highly effective cancer therapy in vitro and in vivo with real-time monitoring of drug release. With a biocompatible C18PMH-PEG functionalization, the Cur nanoparticles (NPs) showed excellent dispersibility and outstanding stability in physiological environments with drug loading capacities >78 wt.%. Both confocal microscopy and flow cytometry confirmed the cellular fluorescence “OFF-ON” activation and real-time monitoring of the Cur molecule release. In vitro and in vivo experiments clearly show that the therapeutic efficacy of the PEGylated Cur NPs is considerably better than that of free Cur. This self-carried strategy with real-time monitoring of drug release may open a new way for simultaneous cancer therapy and monitoring.
1. Introduction
Cancer challenges the survival of people in the world and accounts for several million deaths every year.1,2 Among the various cancer treatments, chemotherapy is a dominant method because of its high efficiency compared with other treatments. Unfortunately, most conventional anticancer drugs are hydrophobic and have no specific selectivity; therefore, they have led to various problems, including poor bioavailability, rapid blood/renal clearance, low accumulation in tumors, and adverse side effects for healthy tissues.3-9 To overcome these drawbacks, much recent attention has been drawn to using nanostructured carriers for encapsulating active drug molecules. This approach can effectively deliver hydrophobic anticancer drugs to tumor sites with improved therapeutic activity and reduced side effects.10-16 However, as most reported nanocarriers are inert in the human body and have no therapeutic efficacy by themselves, their application raises concerns regarding their possible toxicity and biodegradation. Furthermore, the drug loading capacities of such nanocarrier-based drug delivery systems (DDS) are comparatively low (typically <10%), and this would reduce the effective tumor accumulation and therapeutic efficacy of the anticancer drugs.17-20 Therefore, the development of alternative self-carried nanodrug delivery strategies without using any inert carriers is highly desirable.21-26 In 2012, Kasai et al. modified drug-solvent interactions by joining two drug molecules into a dimer, which enabled the formation of self-carried pure nanodrugs with sizes of 30-50 nm via a reprecipitation method.22 Recently, our group has developed an AAO-template-assisted approach for preparing 20-100 nm sized self-carried nanodrugs with good control of their sizes and morphologies.26 However, to date, most reported self-carried nanodrugs have no or weak fluorescence and thus do not provide signals for tracking their release.
On the other hand, activatable theranostic agents that combine fluorescent and cytotoxic modalities, allowing real-time monitoring of drug release in physiological systems, have recently gained considerable attention.27-33 As most antitumor drugs have no or weak fluorescence, the most prevalent strategy for obtaining such theranostic agents is to load drugs into inert fluorescent NPs or to trap drugs and fluorescent dyes in non-fluorescent NPs (e.g. coumarin, silicon, or carbon).12,14,30,34 However, these inert fluorescent NPs or fluorescent dyes lack therapeutic modalities, which leads to the previously mentioned issues of low drug loading capacity and potential long-term toxicity of carrier-based DDS. Furthermore, the design and synthesis of such multi-component DDS are usually time-consuming and involve complicated procedures. To address these problems, self-carried nanodrugs have been developed and have been demonstrated to have superior performance.21-26 However, to date, most reports on self-carried nanodrugs involve only in vitro cancer therapy, and there are few reports on their in vivo application.20,35 While it is highly desirable to develop self-carried nanodrugs without any redundant fluorophores for in vitro and in vivo cancer therapy with real-time monitoring capacity, this is to date not achieved to the best of our knowledge.
Herein, we chose curcumin (Cur), a hydrophobic polyphenol derived from the rhizome of the herb Curcuma longa, as a model hydrophobic drug to demonstrate the merits of the strategy. Cur exhibits a wide range of pharmacological effects, including anti-inflammatory, anti-cancer, and anti-angiogenic properties, to many tumor cell lines.36,37 Despite Cur’s remarkable anticancer characteristics, its extremely low water solubility and poor bioavailability are impeding its wide clinical use. To address this issue, in previous studies, Cur has been loaded into various inert carriers such as mesoporous silica nanoparticles,38,39 gold nanoparticles40 and polymeric nanoparticles.41,42 However, in addition to their low Cur-loading capacities, the large amounts of inert carriers used could lead to other concerns, including their metabolism and potential long-term toxicity.17-20 Another reason for choosing Cur in this study is that it has different fluorescence characteristics in its solid and molecular forms. While an isolated Cur molecule gives strong green fluorescence (On state), solid Cur shows no emission (OFF state) because of intermolecular aggregation. These two emission states are exploited in this study for monitoring the release of Cur molecules (ON) from drug nanoparticles (OFF) upon cell internalization. In this study, Cur NPs are first prepared by a reprecipitation method, followed by surface functionalization with poly(maleic anhydride-alt-1-octadecene)-polyethylene glycol (C18PMH-PEG) through hydrophobic interactions to achieve better biocompatibility, which exhibit significantly enhanced drug efficacy to colon carcinoma cells (CT-26 cells) with real-time monitoring of drug release and display improved tumor inhibition in CT-26 cell bearing mice compared to free Cur drugs.
2. Results and Discussion
2.1 Preparation, characterization and surface functionalization of Self-carried Cur NPs
Our proposed strategy for preparing self-carried pure Cur NPs for cancer therapy with real-time monitoring of drug release is illustrated in Scheme 1. The self-carried Cur NPs were prepared by reprecipitation method in which Cur dissolved in tetrahydrofuran (THF) solution was rapidly injected into deionized water under vigorous stirring. Due to the sudden change in the solvent environment, the Cur molecules will aggregate and precipitate to form NPs. We chose the well-documented reprecipitation approach here because the technique is very simple but versatile; it is widely employed in many biomedical research studies, including many recent works.43-47 Fig. 1a and Fig. S1a show SEM and TEM images of the Cur NPs, respectively, in the form of well-defined and monodispersed nanospheres of 80-90 nm in diameter. Dynamic light scattering measurement (DLS, Fig. 1b) presents a hydrodynamic diameter of 83.2 nm and a polydispersity index (PDI) value of 0.18.
Scheme 1.
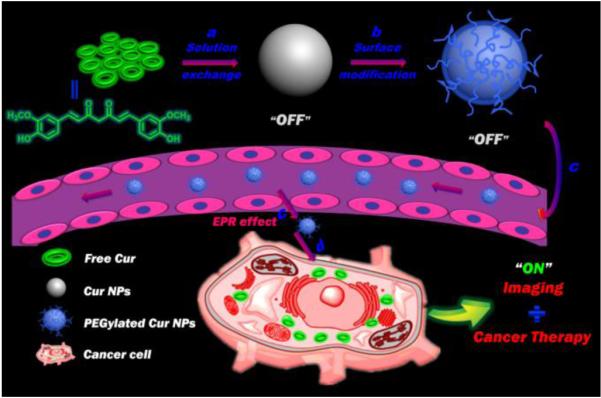
Schematic of functionalized self-carried Cur NPs from nanoparticle formation and PEGylation to delivery. (a) Preparation of pure Cur NPs with no fluorescence (OFF) via a solution exchange method. Upper-left: the chemical structure of Cur. (b) Surface modification of the pure Cur NPs with C18PMH-PEG through hydrophobic interactions. (c) Passive tumor targeting is achieved via the EPR effect, which facilitates the access of the PEGylated Cur NPs to tumors by way of the leaky tumor vasculature. (d) The PEGylated Cur NPs enter tumor cells by endocytosis and release the Cur molecules, which recovers their strong green fluorescence (ON).
Fig. 1.

Characterization and photo-physical properties of Cur NPs. a) A SEM image of the as-prepared Cur NPs (inset is the corresponding TEM image). b) DLS and PDI measurements of the as-prepared Cur NPs in deionized water. c) Absorption and d) fluorescence spectra of free Cur dissolved in THF, the as-prepared Cur NPs and the PEGylated Cur NPs dispersed in deionized water. The inset in (c) shows that a beam of green laser shining through the samples shows scattering from the NPs via the Tyndall effect (c1: as-prepared Cur NPs; c2: the PEGylated Cur NPs). The inset in (d) shows an image of the fluorescence of the three samples (d1: free Cur; d2: as-prepared Cur NPs; d3: the PEGylated Cur NPs).
To enhance their biocompatibility for facilitating further in vivo applications, surface modification of the as-prepared Cur NPs is essential. Previous researchers have demonstrated that PEG is an effective biocompatible building block that has been widely applied to biomaterials for reducing the nonspecific adsorption of biological substances and providing excellent long-term in vivo stability.48-51 Here, C18PMH-PEG was anchored to the surface of the as-prepared Cur NPs by ultrasonication (the product hereafter referred as PEGylated Cur NPs). Fig. S1b shows a TEM image and a DLS measurement (inset) of the PEGylated Cur NPs with sizes of around 100 nm. We also measured zeta potentials of the Cur NPs and the PEGylated Cur NPs and both display negative charges (Fig. S2). Fig. S3 presents digital images of the different samples, including free Cur in THF, free Cur, Cur NPs and PEGylated Cur NPs dispersed in water, which show that the NPs have good dispersibility and better stability compared to the free drug in water. We also observed that while the PEGylated Cur NPs exhibit high stability in water and physiological saline, even over 5 days, the as-prepared Cur NPs show fast agglomeration into larger particles (Fig. S4). This demonstrates that the surface functionalization of Cur NPs was successfully achieved with excellent water stability, thus making the PEGylated Cur NPs in vivo drug delivery possible. An obvious advantage of self-carried pure nanodrug delivery systems is their high drug loading capacities. Owing to no addition of any inert excipients, the average Cur loading efficiency and encapsulation efficiency here were estimated to be 78.5% and 95.8%, respectively, using a standard absorbance technique (Fig. S5). This loading capacity is considerably higher than those achieved with carrier-based DDS (typically <10%) and is the highest value reported among all reported Cur-based nanomedicines (Table S1).
To further investigate the photo-physical properties of the Cur NPs, we measured the absorption and fluorescence spectra of free Cur dissolved in THF, the as-prepared Cur NPs and the PEGylated Cur NPs dispersed in deionized water. As exhibited in Figure 1c, the three samples show similar absorption spectra with the same Cur characteristic absorption peak at about 428 nm, suggesting that the Cur molecular structure remains unchanged in the preparation process. As expected, the free Cur solution shows strong green fluorescence (ON), while the two Cur NP dispersions show no fluorescence (OFF) (Fig. 1d) because of the quenching effect due to aggregation. When the Cur NPs enter tumor cells, the Cur molecule will be released and recover its green fluorescence (ON). Subsequent cell imaging experiments will further confirm the successful implementation of this fluorescent “OFF-ON” system, which enables the self-monitoring of Cur drug release.
2.2 Cumulative drug release profiles
The drug release profile is of great importance for the practical drug delivery applications of the proposed DDS. The concentrations of released Cur were determined via absorption measurements (Fig. S5). As depicted in Fig. 2, in the first 32 hours, the as-prepared Cur NPs reached approximately 46 wt% drug release and the PEGylated Cur NPs exhibited about 36 wt% drug release. Due to the dissolution of the exterior PEG layer, the PEGylated Cur NPs show a slower release compared to the as-prepared Cur NPs. Both of these as-prepared NPs show no initial burst release, but a sustained release feature with over 60%; Cur is released for as long as 300 hours. The slow and steady release without the burst discharge of the Cur NPs is essential for their in vivo applications for improved long-term blood circulation and more efficient delivery to tumors with reduced drug leakage in transit.
Fig. 2.
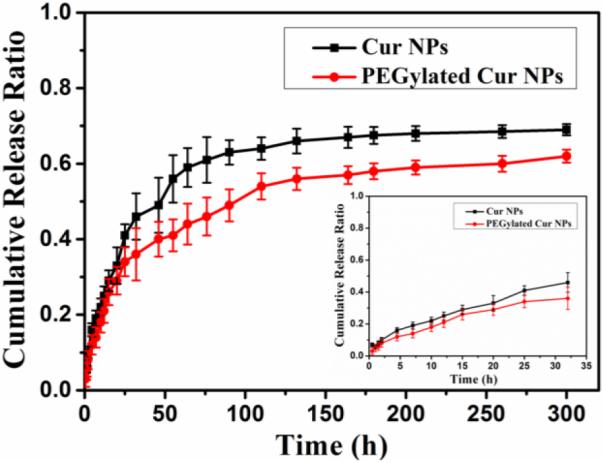
Cumulative drug releases from the as-prepared Cur NPs and the PEGylated Cur NPs as a function of release time in PBS medium over 300 hours. The inset shows the results for the first 32 hours.
2.3 Cellular uptake and imaging of PEGylated Cur NPs
To investigate the cellular uptake and intracellular distribution of the released Cur molecules, CT-26 cells were incubated with PEGylated Cur NPs at 37 °C for 4 h. Fluorescence images of the incubated cells were taken with a confocal laser scanning microscope, in which 4,6-diamidino-2-phenylindole (DAPI) was used as a nucleus located dye. LysoTracker Red and MitoTracker Red were also used for staining lysosomes and mitochondria, respectively. As shown in Fig. 3, the intense homogeneous cytoplasmic green fluorescence around the nuclei confirms that the Cur molecules have been released in the cells. In addition to labeling the lysosomal vesicles, the Cur molecules are also able to stain almost the entire cytoplasm, providing insights into the sub-cellular distribution of the Cur NPs.
Fig. 3.
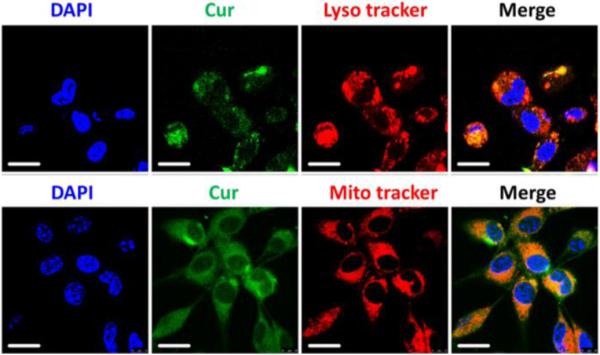
Confocal microscopy images of the colocalization experiment in CT-26 cells. The cell nuclei are stained with DAPI (blue signal) and the lysosomes and mitochondria are stained with Lysotracker Red (red signal) and Mitotracker Red (red signal), respectively. The upper and lower rows of micrographs show that the Cur molecules have been released into the lysosomes and mitochondria, respectively. Scale bar is 20 μm.
We next studied the cellular fluorescence “OFF-ON” and real-time monitoring of the Cur molecule release. CT-26 cells were cultured with PEGylated Cur NPs for different durations (0, 0.5, 1 and 4 h), and fluorescence from the cells was then analyzed with both confocal microscopy and flow cytometry. As mentioned above, the fluorescence of Cur is quenched (OFF) when the Cur molecules are in the form of NPs, but the fluorescence is recovered (ON) when Cur is internalized in the cell as free molecules. As expected, Fig. 4 and Fig. S6 show that after incubation for 30 min or longer, green Cur molecular fluorescence (ON) can be detected, whereas no signal (OFF) can be observed at the beginning of incubation, since Cur is still in the NP state. This demonstrates that the present Cur NPs are promising for monitoring drug release with a cellular fluorescence “OFF-ON” action. To further confirm the real-time monitoring capacity of the NPs, flow cytometric analyses of the CT-26 cells after incubation with PEGylated Cur NPs for different durations were performed and are shown in Figure S7. Enhanced green fluorescence in the cell was observed after 1 and 4 h of incubation, which could be attributed to the gradual release of Cur molecules from the NPs in a cellular environment. These results indicated that the PEGylated Cur NPs possessed a time-dependent cellular release ability.
Fig. 4.

Confocal microscopy images of CT-26 cells treated with the PEGylated Cur NPs. The images were taken immediately (upper row) and 30 min (lower row) after adding 5 μM Cur NPs to the cells. Scale bar is 20 μm.
2.4 In vitro cytotoxic activity
We next studied cytotoxicity profiles of the PEGylated Cur NPs toward CT-26 cells compared with free Cur with a MTT assay. As depicted in Fig. 5 and Fig. S8, the PEGylated Cur NPs show considerably higher cytotoxicity than the free Cur at all doses. The MTT data reveal that the Cur NPs can obviously inhibit the proliferation of the CT-26 cells, as shown by an 8-fold decrease in the half-maximal inhibitory concentration (IC50) values of the free Cur (IC50 = 33.4 μM) compared to the PEGylated Cur NPs (IC50 = 4.2 μM) after 24 h. The improved drug efficiency may be due to the more efficient internalization of the functionalized NPs compared with the free molecules. To check that the observed cytotoxicity is not caused by the PEG coating, an MTT assay was carried out for the C18PMH-PEG surfactant. The results, as presented in Fig. S9, confirm that the surfactant has no cytotoxicity. Moreover, bright field microscopy images of the CT-26 cells were collected to monitor the cell viability directly (Fig. S10). Significant damage to the impregnated CT-26 cells could be clearly observed with the fewest live cells in the PEGylated Cur NPs incubated group; moreover, the control and C18PMH-PEG groups showed no cytotoxicity, which agrees well with the MTT experiments. These results show that the self-carried functionalized Cur NPs have greater inhibitory effects on CT-26 cell growth.
Fig. 5.

Cell viability of free Cur and PEGylated Cur NPs in CT-26 cell line after 24 hours of incubation.
2.5 In vivo cytotoxic activity
Before intravenous injection, a hemolysis assay was performed to confirm the biocompatibility of the PEGylated Cur NPs (Fig. S11). The hemolysis percentages of mice erythrocytes incubated for 3 h at 37 °C with NPs of different concentrations were determined to be insignificant. This confirms that the PEGylated Cur NPs do not cause the erythrocytes to rupture. To evaluate whether the PEGylated Cur NPs have better therapeutic efficacy in vivo, CT-26 tumor-bearing nude mice were intravenously injected with free Cur and the PEGylated Cur NPs. For comparison, physiological saline was used as a control for the intravenous injection. The tumor volumes and body weights of the tumor-bearing mice were monitored for 21 days. At the end of the experiments, the tumor volumes (Fig. 6a) in mice treated with PEGylated Cur NPs were considerably smaller than in those treated with saline and free Cur. After treatment for 21 days, the tumor volumes in the PEGylated Cur NPs group and the free Cur group were only 32% and 87%of that in the saline group, respectively. This shows that the PEGylated Cur NPs do have superior tumor growth inhibitory efficacies compared to saline and free Cur. These observations are in accordance with the results of the in vitro evaluations. In addition, no significant weight loss was observed in the tumor-bearing mice treated with various formulations, indicating the negligible side effect of Cur NPs for tumor therapy at the employed dose (10 mg kg−1 Cur-equivalent) (Fig. 6b). After treatment for 21 days, the mice were sacrificed and the tumors were dissected and photographed (Fig. 6e). The tumor inhibitory rate (TIR) was calculated from the tumor weights (Fig. 6c). Compared with that of the saline group, the TIR of the PEGylated Cur NPs reached up to 45%, which is significantly higher than that of free Cur (5%) (Fig. 7d). All these results confirm that the therapeutic efficacy of the PEGylated Cur NPs is considerably better than that of the free Cur both in vitro and in vivo.
Fig. 6.

In vivo anticancer activity. a) Tumor volumes after intravenous injection of saline, free Cur and PEGylated Cur NPs in CT-26 tumor-bearing nude mice. b) Body weights of CT-26 tumor-bearing mice after treatment with saline, free Cur and PEGylated Cur NPs. c) Mean weight of tumors separated from mice after different treatments. d) The tumor inhibitory rate (TIR) after treatment with free Cur and PEGylated Cur NPs in CT-26 tumor-bearing nude mice. The TIR is calculated using the following equation: TIR (%) = 100 × (mean tumor weight of control group − mean tumor weight of experimental group)/mean tumor weight of control group. Data are represented as average ± standard deviation (n = 5). Statistical significance: *P < 0.005; #P < 0.001. (e) Real-time monitoring of tumor size during the 21-day evaluation period (Left) and representative tumors separated from animals after intravenous injection of saline, free Cur and PEGylated Cur NPs (Right).
Fig. 7.
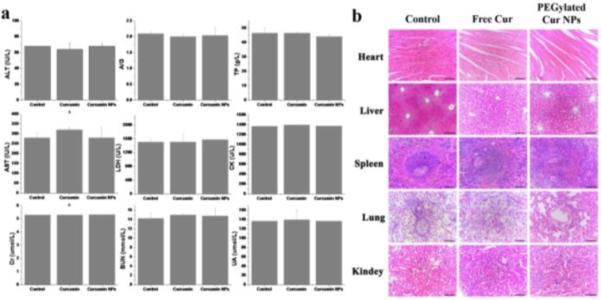
In vivo toxicology study and serum biochemistry results obtained from CT-26-bearing nude mice after intravenous injection with free Cur and PEGylated Cur NPs. a) Blood analysis data of the CT-26-bearing nude mice treated with different formulations after 21 days. Age-matched healthy mice were used as the control group. Data are the mean ± standard deviation from five separate experiments. b) Hematoxylin and eosin (H&E) stained organ slices from the CT-26-bearing nude mice treated with different formulations after 21 days. Age-matched healthy mice were used as the control group.
2.6 In vivo systematic toxicity
The potential for in vivo toxicity has always been a great concern in the development of nanomedicines. In addition to measuring the body weights of the mice in each cohort (Fig. 6b), immunohistochemical analysis was also adopted to assess the in vivo systematic toxicity of the treatments. Age-matched healthy mice were used as a control group. Standard heart function markers, including creatine kinase (CK), aspartate aminotransferase (AST) and lactic dehydrogenase (LDH); liver function markers, including alanine aminotransferase (ALT), albumin/globulin ratio (A/G) and total protein (TP); and kidney function markers, including creatinine (Cr), blood urea nitrogen (BUN) and uric acid (UA), were detected and compared to the control (Fig. 7a). No observable toxicity was noted, suggesting that no obvious heart, liver and kidney dysfunction is induced in mice by the PEGylated Cur NPs treatment. In addition to the blood tests, we collected the main organs of the mice from the control and treated groups and sliced them for hematoxylin and eosin (H&E) staining (Fig. 7b). Neither noticeable organ damage nor inflammation lesions were observed compared with the control group. All these results evidenced that the PEGylated Cur NPs based in vivo cancer treatment induced no significant side effects in the treated mice.
3. Conclusions
In summary, we prepared self-carried Cur nanodrugs for highly effective cancer therapy in vitro and in vivo with real-time monitoring of drug release. With a biocompatible C18PMH-PEG functionalization, the Cur NPs show excellent dispersibility and outstanding stability in physiological environments with a high drug loading capacity >78%. Furthermore, the cellular fluorescence “OFF-ON” activation and real-time monitoring of Cur molecule release were confirmed by both confocal microscopy and flow cytometry, indicating the potential for cancer diagnosis. Finally, both in vitro and in vivo data clearly show that the therapeutic efficacy of the PEGylated Cur NPs is considerably better than that of free Cur; moreover, the NPs show no observable systematic toxicity in vivo. Thus, we believe that this self-carried strategy with real-time monitoring of drug release may open a new way for simultaneous cancer therapy and diagnosis.
4. Experimental
4.1 Materials
Curcumin (Cur), poly(maleic anhydride-alt-1-octadecene) (C18PMH), poly(ethylene glycol)-amine (mPEG-NH2, 5k) and 1-ethyl-3-(3-dimethylaminopropyl)-carbodiimide (EDC) were purchased from Sigma Aldrich. 3-(4,5-Dimethylthiazol-2-yl)-2,5-diphenyl tetrazolium bromide (MTT) was obtained from Sigma-Aldrich and used after drying in vacuo for 24 h. RPMI 1640 culture medium, fetal bovine serum (FBS), Dulbecco’s phosphate buffered saline (PBS), trypsin-EDTA (0.5% trypsin, 5.3 mM EDTA tetra-sodium), and the antibiotic agents penicillin and streptomycin (100 U/ml) were from Invitrogen (USA). High-purity water with a resistivity greater than 18.4 MΩ·cm was collected from an in-line Millipore RiOs/Origin water purification system. Unless otherwise noted, all chemicals were used without further purification. C18PMH-PEG was synthesized following a literature procedure.52,53 Briefly, 10 mg (1 eq) of C18PMH and 143 mg (1 eq) of mPEG-NH2 were dissolved in 5 mL of dichloromethane, 6 µL triethylamine and 10 mg of EDC. After 24 h of stirring, the solvents were evaporated by blowing with dry N2. The leftover solid was dissolved in water, forming a transparent solution, which was dialyzed against distilled water for 3 days in a dialysis bag with a molecular weight cut-off of 14000 Da to remove unreacted mPEG-NH2. After lyophilization, the final product, a white solid, was stored at 4 °C for future use.
4.2 Preparation and functionalization of self-carried Cur NPs
In a typical run, 1.5 mM of Cur was first dissolved in tetrahydrofuran (THF). 200 µL of the solution was then quickly injected into 5 mL of high-purity water under vigorous stirring at room temperature. For the functionalization of the Cur NPs, 300 µL of C18PMH-PEG (0.9 mg) aqueous solution was added to 5 mL of the Cur NPs suspension and sonicated for 5 min. Throughout this process, C18PMH-PEG attached itself to the surface of the Cur NPs by noncovalent hydrophobic interactions.
The drug loading capacity (DLC) and drug loading efficiency (DLE) were calculated according to the following formulae: i) DLC (wt.%) = (weight of loaded drug/weight of PEGylated Cur NPs) × 100% and ii) DLE (%) = (weight of loaded drug/weight of drug in feed) × 100%. The weight of loaded drug and the weight of drug in feed were determined using the UV-Vis absorption spectra at 428 nm and calculated using a standard absorbance technique (Fig. S5). The weight of the PEGylated Cur NPs was calculated using an electronic balance after freeze-drying.
4.3 Characterization of Cur and PEGylated Cur NPs
The sizes and morphologies of the Cur and PEGylated Cur NPs were examined via SEM (HITACHI S-4300) and TEM (JEM-2100). The SEM samples were prepared by drying the nanoparticles onto a Si substrate followed by a 2 nm layer of Au coating. Hydrodynamic sizes of the NPs were measured in aqueous solutions using a DLS instrument (Malvern Zetasizer Nano ZS). Ultraviolet-visible (UV-vis) and fluorescence spectra were respectively recorded with Hitachi U-3900 and a Hitachi F-4600 systems.
4.3 In vitro drug-release
First, Cur NPs and PEGylated Cur NPs were diluted with PBS at pH 7.4. Second, five milliliters of each suspension were added to a dialysis bag (3500 molecular weight cut-off, Fisherbrand®, Pittsburgh, PA, USA) followed by immersion in 200 ml of PBS at 37 °C with constant shaking. Third, aliquots of 2 ml were collected from the solution at certain time points. During the dialysis, the solution volume was maintained at a constant level by topping up with 2 ml of PBS after each sampling. The amount of the released Cur was measured by UV-Vis absorbance. The assay was performed 3 times for each sample.
4.4 Cell culture
CT-26 cells were cultured with RPMI 1640 (Invitrogen, USA) supplemented with 10% FBS (Hyclone Company, South Logan, UT), penicillin (100 μg/mL), and streptomycin (100 μg/mL; Gibco, Grand Island, NY, USA) in 5% CO2 at 37 °C in a humidified incubator.
4.5 Confocal laser scanning microscopy
Imaging of cells was performed using a Leica laser scanning confocal microscope. CT-26 cells were seeded in a 24-well cell-culture plate for 24 h (37 °C, 5% CO2). Then PEGylated Cur NPs were added to the wells. The cells were then incubated for 30 min, 1 h and 4 h (37 °C, 5% CO2). Before observation, the cells were washed three times with PBS and then fixed with 4% paraformaldehyde. Imaging was performed under 488 nm laser excitation and the emission was collected within the range of 515-550 nm. The control group consisted of cells that were not incubated with the NPs.
4.6 In vitro cytotoxicity
Cell cytotoxicity was determined using a standard MTT assay. CT-26 cells were seeded into a 96-well cell-culture plate with 100 μL (5000 cells) per well and then incubated for 24 h at 37°C under 5% CO2. Then, the cells were incubated with free Cur and PEGylated Cur NPs at different concentrations for 24 h and 48 h, respectively, before the MTT assay.
4.7 In vivo antitumor efficacy
Female BALB/c nude mice of 18-20 g were purchased from Vital River Company (Beijing, China) and raised under standard pathogen-free conditions. All animal experiments were performed in accordance with the principles of care and use of laboratory animals. The tumor xenografts were implanted in the BALB/c nude mice by injecting 3 × 10⁶ CT-26 cells into the right flank of each mouse. The xenografted mice were randomly divided into 3 groups (five mice per group) when the tumor volume reached about 100 mm3. Saline, free Cur, and PEGylated Cur NPs were administered by intravenous (i.v.) injection at a Cur-equivalent dose of 10 mg/kg every 3 days. Tumor progression in the mice was then monitored every three days. The mice were sacrificed and their tumors were immediately removed and weighed. Moreover, plasma was collected for biochemical studies, including respective assays for heart, liver and renal functions. Haematoxylin/eosin (H&E) staining of the tumor sections was carried out for tissue studies.
4.8 Statistical Analysis
All data are presented as means ± standard deviation (S.D.). The significant differences between groups were evaluated with Tukey’s method after analysis of variance (ANOVA). In all statistical analyses, p < 0.05 was considered to be statistically significant.
Supplementary Material
Acknowledgements
This work was supported by the Chinese Natural Science Foundation general project (81171455) and key project (31430031), the National Distinguished Young Scholars grant (31225009) from the National Natural Science Foundation of China, the National Key Basic Research Program of China (2009CB930200), the Chinese Academy of Sciences (CAS) “Hundred Talents Program” (07165111ZX), the CAS Knowledge Innovation Program and State High-Tech Development Plan (2012AA020804 and SS2014AA020708), and the Key Basic Research Special Foundation of Science Technology Ministry of Hebei Province (Grant No. 14961302D). This work was also supported in part by NIH/NIMHD 8 G12 MD007597 and USAMRMC W81XWH-10-1-0767 grants. The authors also appreciate the support by the "Strategic Priority Research Program" of the Chinese Academy of Sciences, Grant No. XDA09030301 and support by the external cooperation program of BIC, Chinese Academy of Science, Grant No. 121D11KYSB20130006.
Footnotes
Electronic Supplementary Information (ESI) available: [details of any supplementary information available should be included here]. See DOI: 10.1039/b000000x/
References
- 1.Peer D, Karp JM, Hong S, Farokhzad OC, Margalit R, Langer R. Nat. Nanotechnol. 2007;2:751. doi: 10.1038/nnano.2007.387. [DOI] [PubMed] [Google Scholar]
- 2.Siegel R, Naishadham D, Jemal A. CA Cancer J. Clin. 2013;63:11. doi: 10.3322/caac.21166. [DOI] [PubMed] [Google Scholar]
- 3.Atkins JH, Gershell LJ. Nat. Rev. Cancer. 2002;2:645. [Google Scholar]
- 4.Chabner BA, Roberts TG. Nat. Rev. Cancer. 2005;5:65. doi: 10.1038/nrc1529. [DOI] [PubMed] [Google Scholar]
- 5.Irvine DJ. Nat. Mater. 2011;10:342. doi: 10.1038/nmat3014. [DOI] [PMC free article] [PubMed] [Google Scholar]
- 6.Hubbell JA, Langer R. Nat. Mater. 2013;12:963. doi: 10.1038/nmat3788. [DOI] [PubMed] [Google Scholar]
- 7.Mura S, Nicolas J, Couvreur P. Nat. Mater. 2013;12:991. doi: 10.1038/nmat3776. [DOI] [PubMed] [Google Scholar]
- 8.Cafeo G, Carbotti G, Cuzzola A, Fabbi M, Ferrini S, Kohnke FH, Papanikolaou G, Plutino MR, Rosano C, White AJP. J. Am. Chem. Soc. 2013;135:2544. doi: 10.1021/ja307791j. [DOI] [PubMed] [Google Scholar]
- 9.Wu X, Sun X, Guo Z, Tang J, Shen Y, James TD, Tian H, Zhu W. J. Am. Chem. Soc. 2014;136:3579. doi: 10.1021/ja412380j. [DOI] [PubMed] [Google Scholar]
- 10.Zhou Y, Huang W, Liu J, Zhu X, Yan D. Adv. Mater. 2010;22:4567. doi: 10.1002/adma.201000369. [DOI] [PubMed] [Google Scholar]
- 11.Holme MN, Fedotenko IA, Abegg D, Althaus J, Babel L, Favarger F, Reiter R, Tanasescu R, Zaffalon PL, Ziegler A, Muller B, Saxer T, Zumbuehl A. Nat. Nanotechnol. 2012;7:536. doi: 10.1038/nnano.2012.84. [DOI] [PubMed] [Google Scholar]
- 12.Lee MH, Kim JY, Han JH, Bhuniya S, Sessler JL, Kang C, Kim JS. J. Am. Chem. Soc. 2012;134:12668. doi: 10.1021/ja303998y. [DOI] [PubMed] [Google Scholar]
- 13.Peng F, Su Y, Wei X, Lu Y, Zhou Y, Zhong Y, Lee ST, He Y. Angew. Chem. Int. Ed. 2013;52:1457. doi: 10.1002/anie.201206737. [DOI] [PubMed] [Google Scholar]
- 14.Maiti S, Park N, Han JH, Jeon HM, Lee JH, Bhuniya S, Kang C, Kim JS. J. Am. Chem. Soc. 2013;135:4567. doi: 10.1021/ja401350x. [DOI] [PubMed] [Google Scholar]
- 15.Xing Q, Li N, Chen D, Sha W, Jiao Y, Qi X, Xu Q, Lu J. J. Mater. Chem. B. 2014;2:1182. doi: 10.1039/c3tb21269f. [DOI] [PubMed] [Google Scholar]
- 16.Zhang P, Cheng F, Zhou R, Cao J, Li J, Burda C, Min Q, Zhu J. Angew. Chem. Int. Ed. 2014;53:2371. doi: 10.1002/anie.201308920. [DOI] [PubMed] [Google Scholar]
- 17.Poland CA, Duffin R, Kinloch I, Maynard A, Wallace WAH, Seaton A, Stone V, Brown S, MacNee W, Donaldson K. Nat. Nanotechnol. 2008;3:423. doi: 10.1038/nnano.2008.111. [DOI] [PubMed] [Google Scholar]
- 18.Shen Y, Jin E, Zhang B, Murphy CJ, Sui M, Zhao J, Wang J, Tang J, Fan M, Kirk EV, Murdoch WJ. J. Am. Chem. Soc. 2010;132:4259. doi: 10.1021/ja909475m. [DOI] [PubMed] [Google Scholar]
- 19.Alkilany AM, Shatanawi A, Kurtz T, Caldwell RB, Caldwell RW. Small. 2012;8:1270. doi: 10.1002/smll.201101948. [DOI] [PMC free article] [PubMed] [Google Scholar]
- 20.Huang P, Wang D, Su Y, Huang W, Zhou Y, Cui D, Zhu X, Yan D. J. Am. Chem. Soc. 2014;136:11748. doi: 10.1021/ja505212y. [DOI] [PubMed] [Google Scholar]
- 21.Baba K, Pudavar HE, Roy I, Ohulchanskyy TY, Chen Y, Pandey RK, Prasad PN. Mol Pharm. 2007;4:289. doi: 10.1021/mp060117f. [DOI] [PMC free article] [PubMed] [Google Scholar]
- 22.Kasai H, Murakami T, Ikuta Y, Koseki Y, Baba K, Oikawa H, Nakanishi H, Okada M, Shoji M, Ueda M, Imahori H, Hashida M. Angew. Chem. Int. Ed. 2012;51:10315. doi: 10.1002/anie.201204596. [DOI] [PubMed] [Google Scholar]
- 23.Li W, Yang Y, Wang C, Liu Z, Zhang X, An F, Diao X, Hao X, Zhang X. Chem. Commun. 2012;48:8120. doi: 10.1039/c2cc33214k. [DOI] [PubMed] [Google Scholar]
- 24.Li W, Zhang X, Hao X, Jie J, Tian B, Zhang X. Chem. Commun. 2013;49:10989. doi: 10.1039/c3cc46718j. [DOI] [PubMed] [Google Scholar]
- 25.Huang P, Wang D, Su Y, Huang W, Zhou Y, Cui D, Zhu X, Yan D. J. Am. Chem. Soc. 2014;136:11748. doi: 10.1021/ja505212y. [DOI] [PubMed] [Google Scholar]
- 26.Zhang J, Li Y, An FF, Zhang X, Chen X, Lee CS. Nano Lett. 2015;15:313. doi: 10.1021/nl503598u. [DOI] [PubMed] [Google Scholar]
- 27.Santra S, Kaittanis C, Santiesteban OJ, Perez JM. J. Am. Chem. Soc. 2011;133:16680. doi: 10.1021/ja207463b. [DOI] [PMC free article] [PubMed] [Google Scholar]
- 28.Lee G, Eom K, Park J, Yang J, Haam S, Huh Y, Ryu JK, Kim NH, Yook JI, Lee SW, Yoon DS, Kwon T. Angew. Chem. Int. Ed. 2012;51:5939. doi: 10.1002/anie.201108830. [DOI] [PubMed] [Google Scholar]
- 29.Lai J, Shah BP, Garfunkel E, Lee K. ACS Nano. 2013;7:2741. doi: 10.1021/nn400199t. [DOI] [PMC free article] [PubMed] [Google Scholar]
- 30.Wang Q, Bao Y, Ahire J, Chao Y. Adv. Healthcare Mater. 2013;2:459. doi: 10.1002/adhm.201200178. [DOI] [PubMed] [Google Scholar]
- 31.Tang J, Kong B, Wu H, Xu M, Wang Y, Wang Y, Zhao D, Zheng G. Adv. Mater. 2013;25:6569. doi: 10.1002/adma.201303124. [DOI] [PubMed] [Google Scholar]
- 32.Yuan Y, Chen Y, Tang BZ, Liu B. Chem. Commun. 2014;50:3868. doi: 10.1039/c3cc49516g. [DOI] [PubMed] [Google Scholar]
- 33.Xing Q, Li N, Chen D, Sha W, Jiao Y, Qi X, Xua Q, Lu J. J. Mater. Chem. B. 2014;2:1182. doi: 10.1039/c3tb21269f. [DOI] [PubMed] [Google Scholar]
- 34.Zheng M, Liu S, Li J, Qu D, Zhao H, Guan X, Hu X, Xie Z, Jing X, Sun Z. Adv. Mater. 2014;26:3554. doi: 10.1002/adma.201306192. [DOI] [PubMed] [Google Scholar]
- 35.Yang Y, Zhang X, Yu C, Hao X, Jie J, Zhou M, Zhang X. Adv. Healthcare Mater. 2014;3:906. doi: 10.1002/adhm.201300463. [DOI] [PubMed] [Google Scholar]
- 36.Tang H, Murphy CJ, Zhang B, Shen Y, Kirk EAV, Murdoch WJ, Radosz M. Biomaterials. 2010;31:7139. doi: 10.1016/j.biomaterials.2010.06.007. [DOI] [PubMed] [Google Scholar]
- 37.Barui S, Saha S, Mondal G, Haseena S, Chaudhuri A. Biomaterials. 2014;35:1643. doi: 10.1016/j.biomaterials.2013.10.074. [DOI] [PubMed] [Google Scholar]
- 38.Jin D, Park KW, Lee JH, Song K, Kim JG, Seo ML, Jung JH. J. Mater. Chem. 2011;21:3641. [Google Scholar]
- 39.Xu C, Niu Y, Popat A, Jambhrunkar S, Karmakar S, Yu C. J. Mater. Chem. B. 2014;2:253. doi: 10.1039/c3tb21431a. [DOI] [PubMed] [Google Scholar]
- 40.Dey S, Sreenivasan K. J. Mater. Chem. B. 2015;3:824. doi: 10.1039/c4tb01731e. [DOI] [PubMed] [Google Scholar]
- 41.Wang H, Zhao S, Agarwal P, Dumbleton J, Yu J, Lu X, He X. Chem. Commun. 2015;51:7733. doi: 10.1039/c5cc01833a. [DOI] [PubMed] [Google Scholar]
- 42.Stigliano C, Key J, Ramirez M, Aryal S, Decuzzi P. Adv. Funct. Mater. 2015;25:3371. [Google Scholar]
- 43.Zhang J, An F, Li Y, Zheng C, Yang Y, Zhang X, Zhang X. Chem. Commun. 2013;49:8072. doi: 10.1039/c3cc43413c. [DOI] [PubMed] [Google Scholar]
- 44.Yu C, Zhou M, Zhang X, Wei W, Chen X, Zhang X. Nanoscale. 2015;7:5683. doi: 10.1039/c5nr00290g. [DOI] [PubMed] [Google Scholar]
- 45.Pu K, Shuhendler AJ, Jokerst JV, Mei J, Gambhir SS, Bao Z, Rao J. Nat. Nanotechnol. 2014;9:233. doi: 10.1038/nnano.2013.302. [DOI] [PMC free article] [PubMed] [Google Scholar]
- 46.Shuhendler AJ, Pu K, Cui L, Uetrecht JP, Rao J. Nat. Biotech. 2014;32:373. doi: 10.1038/nbt.2838. [DOI] [PMC free article] [PubMed] [Google Scholar]
- 47.Wu IC, Yu J, Ye F, Rong Y, Gallina ME, Fujimoto BS, Zhang Y, Chan YH, Sun W, Zhou XH, Wu C, Chiu DT. J. Am. Chem. Soc. 2015;137:173. doi: 10.1021/ja5123045. [DOI] [PMC free article] [PubMed] [Google Scholar]
- 48.Prencipe G, Tabakman SM, Welsher K, Liu Z, Goodwin AP, Zhang L, Henry J, Dai H. J. Am. Chem. Soc. 2009;131:4783. doi: 10.1021/ja809086q. [DOI] [PMC free article] [PubMed] [Google Scholar]
- 49.Fuhrmann K, Schulz JD, Gauthier MA, Leroux J. ACS Nano. 2012;6:1667. doi: 10.1021/nn2046554. [DOI] [PubMed] [Google Scholar]
- 50.Logie J, Owen SC, McLaughlin CK, Shoichet MS. Chem. Mater. 2014;26:2847. [Google Scholar]
- 51.Qhattal HSS, Hye T, Alali A, Liu X. ACS Nano. 2014;8:5423. doi: 10.1021/nn405839n. [DOI] [PMC free article] [PubMed] [Google Scholar]
- 52.Wang C, Cheng L, Liu Z. Biomaterials. 2011;32:1110. doi: 10.1016/j.biomaterials.2010.09.069. [DOI] [PubMed] [Google Scholar]
- 53.Wang C, Ma XX, Ye SQ, Cheng L, Yang K, Guo L, Li CH, Li YG, Liu Z. Adv. Funct. Mater. 2012;22:2363. [Google Scholar]
Associated Data
This section collects any data citations, data availability statements, or supplementary materials included in this article.