Abstract
Accurate assessment of hip fracture risk is very important to prevent hip fracture and to monitor the effect of a treatment. A subject-specific QCT-based finite element model was constructed to assess hip fracture risk at the critical locations of femur during the single-leg stance and the sideways fall. The aim of this study was to improve the prediction of hip fracture risk by introducing a novel failure criterion to more accurately describe bone failure mechanism. Hip fracture risk index was defined using cross-section strain energy, which is able to integrate information of stresses, strains, and material properties affecting bone failure. It was found that the femoral neck and the intertrochanteric region have higher fracture risk than other parts of the femur, probably owing to the larger content of cancellous bone in these regions. The study results also suggested that women are more prone to hip fracture than men. The findings in this study have a good agreement with those clinical observations reported in the literature. The proposed hip fracture risk index based on strain energy has the potential of more accurate assessment of hip fracture risk. However, experimental validation should be conducted before its clinical applications.
1. Introduction
Two of the major determinants of proximal femur fractures among the elderly are osteoporosis and sideways fall. The most common serious injury associated with the fall of an elderly person is hip fracture. Furthermore, hip fracture is associated with an up to 20% chance of death, a 25% chance of long term institutionalization, and less than a 50% chance of full recovery [1]. The total number of hip fractures in men and women in 1990 was estimated to be 338,000 and 917,000, respectively, over the world [2]. Assuming no change in the age- and sex-specific incidence, the number of hip fractures is estimated to approximately double to 2.6 million by the year 2025 and 4.5 million by the year 2050 over the world [2]. By the increasing trend in hip fractures because of the aging of the population, the worldwide annual costs of hip fractures in the year 2050 have been estimated to be $131.5 billion [3]. So, hip fracture risk should be assessed in individuals who are at a risk for an osteoporotic hip fracture to provide proper plans to prevent future probable fractures.
Statistical models and bone mineral density (BMD) captured by Dual-Energy X-ray Absorptiometry (DXA) are used for in vivo osteoporotic fracture risk assessment [4, 5]. However, their accuracy in assessment of fractures is limited; most osteoporotic fractures actually occur with BMD measurements that are above the conventional osteoporotic threshold [6]. Fracture Risk Assessment Tool (FRAX) is a tool to evaluate an individual's fracture probability in the next 10 years, adopted by the WHO in 2008 [7]. FRAX does not take into account fall-induced impact force that is critically important in the hip fracture risk assessment [8, 9]. The main limitations of the FRAX include the following: it is a statistical model and fracture risk is not consistent within 10 years with some of the treatment results [10]. Hip structure analysis (HSA) program is now commercially available and is used to automatically assess the geometric and structural parameters of the femur. Whereas HSA is based on a beam model, the deformation of bone is oversimplified, especially in the femoral neck and the intertrochanteric region where osteoporotic femoral fractures most often occur; therefore the deformation is too complicated to be described as a beam model [11].
Finite element models constructed from quantitative computed tomography (QCT) are very helpful in assessing hip fracture risk, as they are based on well-established biomechanical principles and theories. In QCT-based finite element modeling, choosing a proper failure criterion is very important to accurate assessment of hip fracture risk. Commonly used bone failure criteria include von Mises stress and strain criteria [12–15], maximum principle stress and strain criteria [16–19], maximum shear stress criterion [20], and maximum distortion energy criterion [20]. The femur consists of inhomogeneous (porous) cancellous bone and nearly homogenous cortical bone, and their failure mechanisms are different due to their different microstructure. Failure mechanism of the cancellous bone is mostly in the form of spicule (trabecula) buckling, and the failure of denser cancellous bone and the cortical bone is mostly characterized by local cracking [21, 22]. Cortical and cancellous bone have different properties. Cortical bone is usually more brittle [23], while cancellous bone is more ductile. The current failure criteria are not convenient in describing their properties. Therefore, the total strain energy, which integrates all information of stress, strain, and material properties, is a better option [21]. Mirzaei et al. [21, 24] predicted failure strength and failure patterns of human proximal femur and human vertebrae using the strain energy criterion with a QCT-based FE model. Their predictions of the failure loads and failure locations were in a good agreement with the experimental findings. The strain energy criterion is widely used in fracture analysis of engineering materials. It is usually used in crack problems [25–27], composite laminates [28, 29], and bone cement analysis [30]. Therefore, computation of hip fracture risk index (FRI) over a region of interest (ROI) based on the strain energy criterion theoretically should be more accurate for assessing hip fracture risk. To the best of our knowledge, there are currently no published studies that use the strain energy criterion for the hip fracture risk assessment. The objective of this study is to improve the hip fracture risk assessment procedure previously developed by Luo et al. [11] by introducing the strain energy criterion.
2. Materials and Methods
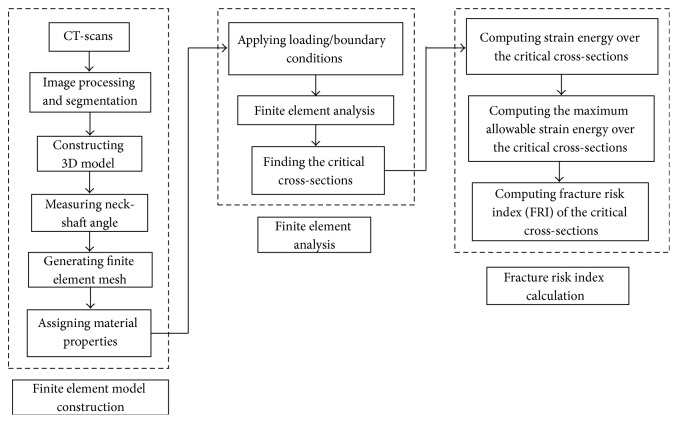
The proposed methodology for assessment of hip fracture risk in the critical regions of femur using the strain energy criterion determined from QCT-based finite element model is shown in Figure 1. The procedure is explained in detail in the following.
Figure 1.
The proposed methodology for calculating hip fracture risk index using the strain energy criterion.
2.1. QCT-Based Finite Element Model
2.1.1. QCT-Scan of Femur
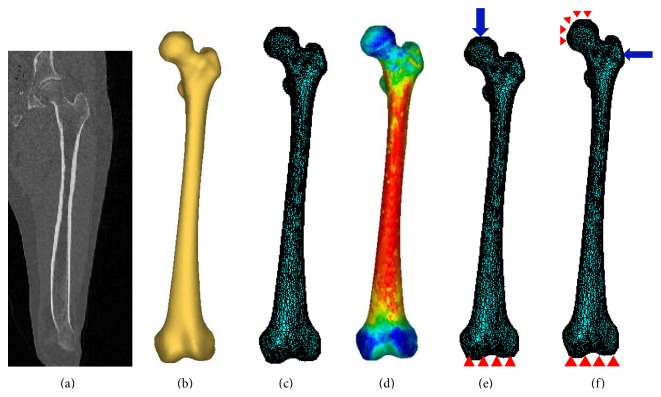
The purpose of this study is to accurately assess hip fracture risk, so, a 3D finite element model of subject's femur is required to achieve it. The 3D model can be constructed from the subject's femur QCT images. QCT slices are produced using multiple scanners with a set of proper acquisition and reconstruction parameters (Figure 2(a)). Slice thickness of 1 mm is commonly used. The scanned QCT images are stored in the format of Digital Imaging and Communications in Medicine (DICOM), which can be used for the construction of a 3D FE model. A proper segmentation is done to separate the femur for constructing the 3D model. Each voxel in the QCT-scan has an intensity (or grey scale) that is expressed as Hounsfield Unit (HU), which is correlated to bone density [31, 32]. Threshold value for the cancellous bone is from 100 HU to 200 HU and for the cortical bone is between 200 HU and 2000 HU. QCT images of 60 clinical cases (30 females and 30 males) were acquired from the Winnipeg Health Science Centre in an anonymous way under a human research ethics approval. The subjects are in the age scope from 50 to 82 years (average of 65 years). Statistical information of the clinical cases is listed in Table 1.
Figure 2.
QCT-based finite element modeling: (a) QCT-scan of the subject's femur; (b) 3D model generated from the QCT images; (c) 3D finite element model; (d) distribution of elasticity modulus; (e) single-leg stance configuration; and (f) sideways fall configuration.
Table 1.
Statistical information of the 60 clinical cases.
| Gender | Age (years) | Height (cm) | Body weight (kg) | BMI (kg/m2) | |
|---|---|---|---|---|---|
| Female | Range | 50–82 | 149–174.7 | 51.7–110.9 | 21.01–43.36 |
| Average | 65 | 163.92 | 77.58 | 28.81 | |
|
| |||||
| Male | Range | 50–78 | 163.4–193.2 | 61.5–126.6 | 18.83–40.96 |
| Average | 64.71 | 175.74 | 86.22 | 27.9 | |
2.1.2. Generation of Finite Element Mesh
In the first step, the geometrical model of the femur is generated from clinical QCT images using Mimics (Materialise, Leuven, Belgium). QCT images (in DICOM format) are imported to Mimics for segmentation (Figure 2(a)) and construction of 3D geometric model of the femur (Figure 2(b)). With the 3D geometric model, a FE mesh is generated using the 3-matic module in Mimics (Figure 2(c)). The 4-node linear tetrahedral element SOLID72 in ANSYS was used in this study. To investigate model convergence, FE models with different maximum element edge lengths were created. For each FE model, displacement was calculated under the same loading and boundary conditions. The maximum element edge length that produced converged finite element solutions was obtained and used in all the rest of FE simulations. The number of elements for each case is assigned based on the maximum element edge length that provided converged FE solution, meaning that the number of elements is different from case to case.
2.1.3. Assignment of Material Properties
To construct a more faithful FE model, bone material properties are considered inhomogeneous and isotropic in this study. Information on the inhomogeneous isotropic mechanical properties of the bone can be derived from the CT data using a mathematical relationship between the CT numbers and the mechanical properties of bone. The following empirical equation was used to determine bone ash density (ρ ash) from HU number [33, 34]:
| (1) |
Equations (2) and (3), derived by Keller [35], were, respectively, used to assign Young's modulus (E) and yield stress (σ Y) according to the bone ash density:
| (2) |
| (3) |
A constant Poisson's ratio (ν = 0.4) was considered as suggested in the literature [13, 36, 37]. To assign material properties, elements are grouped into a number of discrete material bins using Mimics (Materialise, Leuven, Belgium), to approximately represent the continuous distribution of the inhomogeneous bone mechanical properties. To determine the maximum number of material bins, convergence study was performed. Models with different material bins were created for convergence study. For each FE model, displacement was calculated under the same loading and boundary conditions. The maximum number of material bins that generated converged finite element solutions was obtained. Figure 2(d) shows the isotropic inhomogeneous distribution of material properties.
2.2. Finite Element Analysis Using ANSYS
The finite element model of femur with the assigned material properties was output from Mimics and then imported to ANSYS for finite element analysis. For a precise assessment of hip fracture risk during the single-leg stance and the sideways fall, loading and boundary conditions simulating the single-leg stance and the sideways fall configurations are required in the FE model. To simulate the single-leg stance configuration, 2.5 times the patient's body weight was applied as a distributed load on the femoral head in direction of femoral shaft axis [38] and femur was fixed at the distal end [13, 39]; see Figure 2(e). Consider
| (4) |
where w is the subject's body weight in Newton (N). To simulate sideways fall, the distal end of femur was completely fixed and the surface of femoral head was fixed in the loading direction (Figure 2(f)) [40, 41]. The impact force during the sideways fall acting on the greater trochanter perpendicularly (Figure 2(f)) is given by [38, 42]:
| (5) |
where h is the height of the subject in centimeter (cm). Loading and boundary conditions on the greater trochanter, the femoral head, and the distal end of femur were applied to a group of nodes using APDL codes (Figures 2(e) and 2(f)). After importing the QCT-based FE model and applying the loading and boundary conditions, finite element analysis was performed and finite element solutions were obtained. In all the analysis, the nodal displacements, stresses, and strains were obtained for each subject.
2.3. Detection of the Three Critical Cross-Sections on the Femur
Hip fractures usually occur at one of the anatomical locations: the femoral neck, the intertrochanter, and the subtrochanter as illustrated in Figure 3. According to clinical observations, 49 percent of hip fractures are intertrochanteric, 37 percent are at femoral neck, and 14 percent are subtrochanteric [43]. Therefore, the smallest femoral neck cross-section (SFN CS), the intertrochanteric cross-section (IntT CS), and the subtrochanteric cross-section (SubT CS) are the three critical cross-sections of femur that usually have the highest fracture risk (Figure 3). To determine the smallest femoral neck cross-section and the intertrochanteric cross-section, neck-shaft angle is needed. The neck-shaft angle is the angle between the femoral neck axis and the femoral shaft axis. This angle traditionally is measured on conventional radiography images, or using 2D images projected from CT/MRI data. In spite of their popularity, these methods are based on oversimplification of the real 3D anatomy and may lead to large errors due to the inaccuracies in selection of the measurement plane [44–46]. In this study, the neck-shaft angle was measured using a 3D measurement technique based on fitting functions. In this technique, the shapes of particular parts of the femur are approximated using geometric entities such as circle, cylinder, and sphere, which are well fitted to the actual anatomy, and the geometrical relationships between these entities are obtained to estimate the neck-shaft angle.
Figure 3.
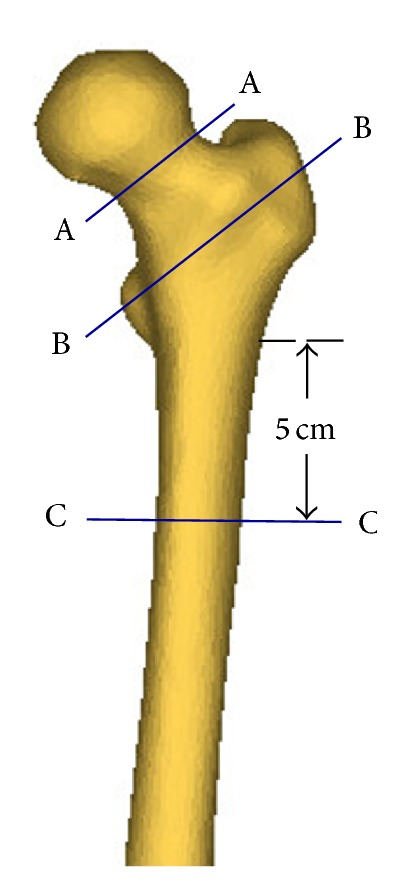
Three critical cross-sections of femur: the smallest femoral neck cross-section (A-A), the intertrochanteric cross-section (B-B), and the subtrochanteric cross-section (C-C).
First, a sphere was fitted to the femoral head, to obtain the position of the joint's centre of rotation, which is also the femoral head centre. Then, the femoral neck axis and the femoral shaft axis are identified by applying the “fit ruled surface direction” function on the femoral neck and shaft. All fitting functions were applied using the 3-matic module in Mimics. The neck-shaft angle was also measured by 3-matic module of Mimics (Figure 4). With the femoral neck-shaft angle, the intertrochanteric cross-section and the smallest femoral neck cross-section were found using in-house computer codes. The smallest femoral neck cross-section is chosen as the cross-section with the smallest area in the neck region and the intertrochanteric cross-section is chosen as the cross-section that has the largest area in the intertrochanteric region [47]. By using APDL codes, perpendicular planes on the femoral neck axis were determined and then areas of the cross-sections were calculated. The planes with the smallest and the largest areas were chosen, respectively, as the smallest femoral neck cross-section and the intertrochanteric cross-section. The subtrochanteric cross-section is considered five centimeters below the lesser trochanter [48] (Figure 3).
Figure 4.
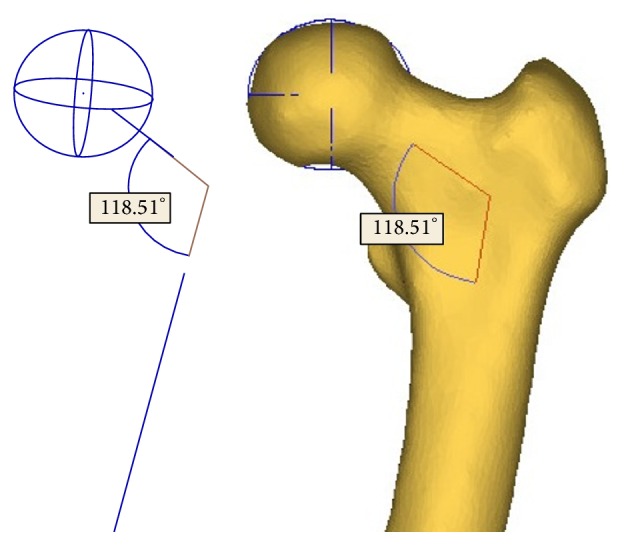
Neck-shaft angle measured by the fitting functions in the 3-matic module of Mimics.
2.4. Hip Fracture Risk Index Definition Using the Strain Energy Criterion
Based on the previous discussion of the bone failure mechanism and microstructure, the strain energy criterion is theoretically more favourable for hip fracture risk assessment. The strain energy at the three critical cross-sections of femur induced by the applied forces was computed using in-house developed MATLAB codes and the data extracted by APDL codes from the obtained finite element solutions. The plane boundaries of the three critical cross-sections, extracted from the finite element mesh, were imported to MATALB to generate a 2D mesh for calculating the cross-section strain energy. Figure 5 shows the generated triangle elements over the smallest femoral neck cross-section, the intertrochanteric cross-section, and the subtrochanteric cross-section.
Figure 5.
Generated triangle elements over (a) the smallest femoral neck cross-section, (b) the intertrochanteric cross-section, and (c) the subtrochanteric cross-section.
The strain energy at the three critical cross-sections induced by the applied forces is the sum of strain energy in all the triangle elements; that is,
| (6) |
where U e is the strain energy in Element e induced by the applied forces and m is the number of triangle elements created over the concerned cross-section. Gaussian integration method was used to calculate the strain energy in elements. Integration points in each triangle element were determined using in-house MATLAB codes. By using Gaussian integration method, the strain energy of Element e induced by the applied forces is calculated as
| (7) |
where is the strain energy density of Element e; is the strain energy density at the integration point i of in Element e; W i is the weight at the integration point; |J| is the determinant of the Jacobean matrix of the triangle element; and n is the number of integration points over the triangle element. The strain energy density at an integration point (i) was determined from the finite element solutions obtained by the QCT-based FE model; that is,
| (8) |
where {σ} = [D]{ε} and {ε} = [B]{d}. The strain energy density at each integration point can be expressed by the finite element solutions as
| (9) |
where {d} is the displacement vector consisting of displacements at the nodes of Element e; matrix [B] consists of the derivatives of shape functions of the element; and [D] is the material property matrix. Consider
| (10) |
where Poisson's ratio is constant (ν = 0.4) and Young's modulus is a function of the bone density as given in (2). For each integration point, its Young's modulus is determined by the bone density at the point.
The maximum allowable strain energy over a critical cross-section of the femur was also computed from the obtained finite element solutions using in-house MATLAB codes. The maximum allowable strain energy (or the yield strain energy) over a critical cross-section is obtained as
| (11) |
where U Y e is the yield strain energy in Element e and m is the number of triangle elements over the concerned cross-section. The Gaussian integration method was also used to calculate the maximum allowable strain energy in each triangle element. The maximum allowable strain energy that a triangle element (e) can sustain is given by
| (12) |
where is the yield strain energy density in Element e; n is the number of integration points; and is the yield strain energy density at integration point i and is calculated as
| (13) |
where σ Yi and E i are, respectively, the yield stress and Young's modulus at the integration point. Both of them are function of bone density, as given in (2) and (3).
Hip fracture risk index (η) at a critical cross-section is defined as
| (14) |
where U and U Y are, respectively, obtained from (6) and (11).
3. Results
3.1. Convergence Studies
3.1.1. Element Size in Femur Finite Element Analysis
The convergence of finite element solutions in a representative case is shown in Figure 6. The convergence study showed that the finite element displacements converged with the maximum element edge length smaller than 8 mm. Therefore, in construction of the rest of femur FE models, the maximum element edge length was set to 8 mm.
Figure 6.
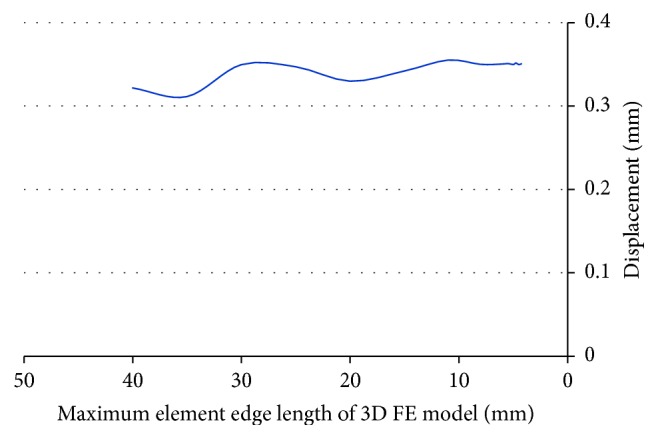
Convergence of finite element solutions with element size.
3.1.2. Assignment of Inhomogeneous Material Properties
For convergence study in assigning the inhomogeneous material properties, 3D femur FE models with different material bins were created. For each FE model with different material bins, the maximum displacement at the smallest femoral neck cross-section was monitored under the same loading and boundary conditions. Data on the displacement were compared among the FE models with different material bins. The results of the convergence study showed that the displacement did not change significantly with the number of material bins larger than 50. Therefore, in the assignment of material properties for all the cases, 50 discrete material bins were considered.
3.1.3. Element Size in Calculating Cross-Section Strain Energy
Convergence study was also performed to determine the element size used in integrating cross-section strain energy, as it affects the calculated fracture risk index (FRI). The FRI at the concerned cross-section was calculated with different maximum element edge lengths. The results are plotted in Figure 7. The FRI did not change significantly with the maximum element edge length smaller than 5 mm. Therefore, the maximum element edge length was set to 5 mm in calculating cross-section strain energy.
Figure 7.
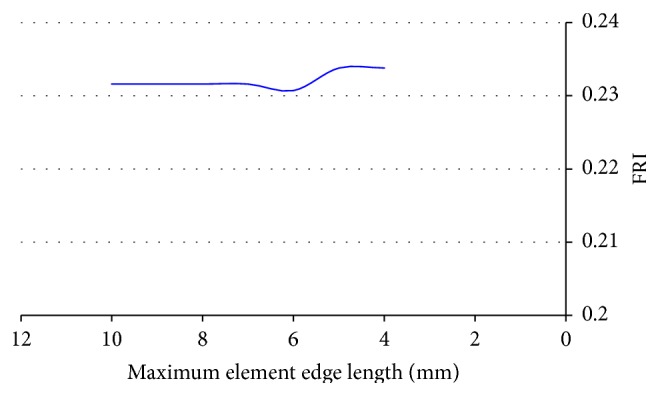
Convergence of FRI.
3.1.4. The Number of Integration Points in Calculating Cross-Section Strain Energy
The effect of the number of integration points on the calculated FRI was investigated. FRI at the smallest femoral neck cross-section was computed for 5 clinical cases with different number of integration points. The relative errors between FRIs obtained with 3 and 7 integration points are shown in Table 2. As it can be seen, the errors are not significant. Therefore, the 3-point integration rule was used in this study to reduce computational time.
Table 2.
Femoral neck FRI obtained with different number of integration points.
| Case number | FRI | Relative error (%) | |
|---|---|---|---|
| 3 integration points | 7 integration points | ||
| 1 | 0.239 | 0.2416 | 1.07 |
| 2 | 0.6898 | 0.6975 | 1.1 |
| 3 | 0.2966 | 0.2976 | 0.33 |
| 4 | 0.8885 | 0.899 | 1.16 |
| 5 | 1.1482 | 1.1701 | 1.87 |
3.2. Stress and Strain Patterns at the Three Critical Cross-Sections
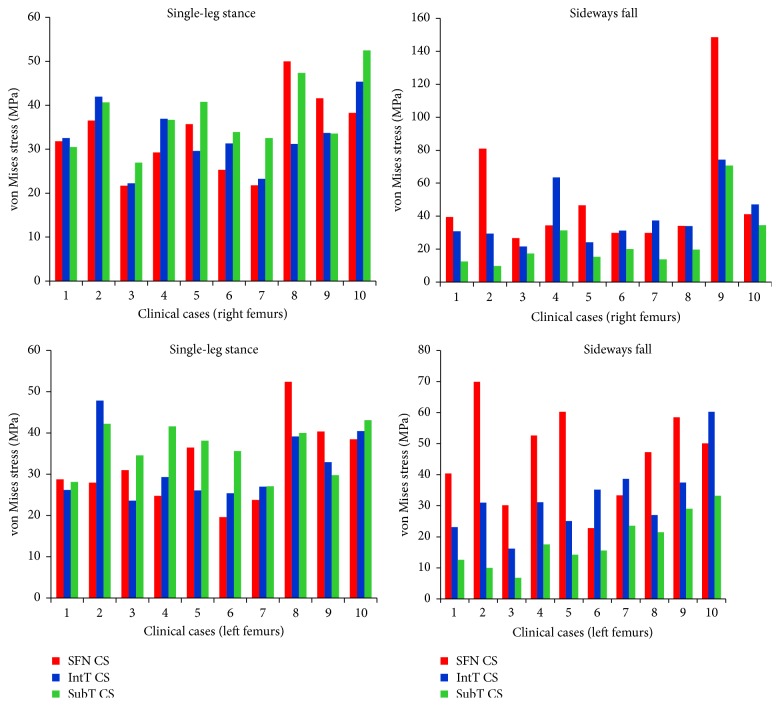
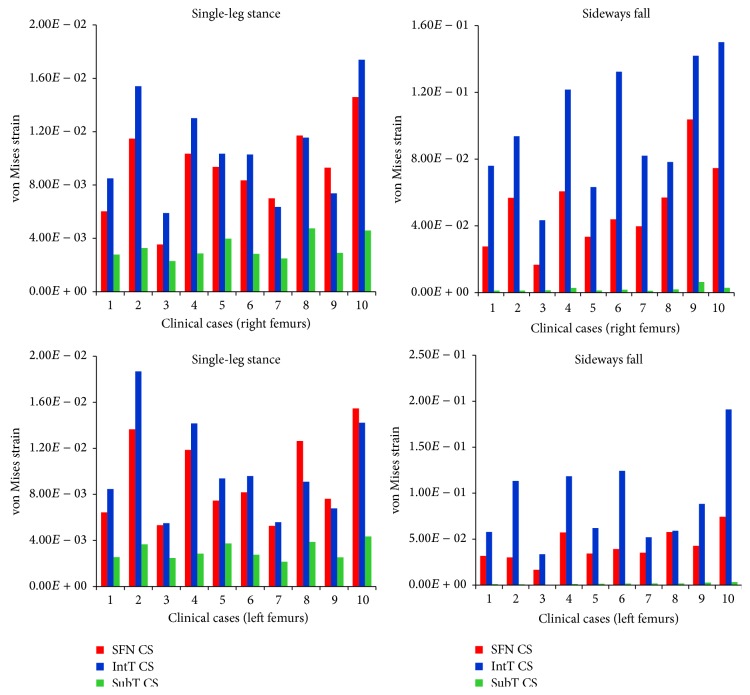
For the 10 clinical cases (5 females and 5 males, totally 20 right and left femurs), the maximum von Mises stress and strain at the three critical cross-sections of femur during both the single-leg stance and the sideways fall are shown in Figures 8 and 9. It can be observed that, during the sideways fall, the femoral neck and the intertrochanteric region received higher stresses than the subtrochanteric region (Table 4). But during the single-leg stance, the patterns in the stresses are different (Table 3); first, the differences between the stresses over the three regions are much smaller; for some cases, the stresses at the subtrochanteric region are higher than those in the other two regions (Figure 8). Strains in the three regions have similar patterns during both the single-leg stance and the sideways fall (Tables 5 and 6).
Figure 8.
The maximum von Mises stress (Mpa) at the smallest femoral neck cross-section (SFN CS), the intertrochanteric cross-section (IntT CS), and the subtrochanteric cross-section (SubT CS) of right and left femurs of 10 clinical cases during the single-leg stance and the sideways fall.
Figure 9.
The maximum von Mises strain at the smallest femoral neck cross-section (SFN CS), the intertrochanteric cross-section (IntT CS), and the subtrochanteric cross-section (SubT CS) of right and left femurs of 10 clinical cases during the single-leg stance and the sideways fall.
Table 4.
Average maximum von Mises stress (MPa) at the smallest femoral neck cross-section (SFN CS), the intertrochanteric cross-section (IntT CS), and the subtrochanteric cross-section (SubT CS) of right and left femurs of 10 clinical cases during the sideways fall.
| Maximum von Mises stress (MPa) | ||||||
|---|---|---|---|---|---|---|
| Right femurs | Left femurs | |||||
| SFN CS | IntT CS | SubT CS | SFN CS | IntT CS | SubT CS | |
| Range | 26.69–148.53 | 21.57–74.3 | 9.8–70.63 | 22.78–69.97 | 16.2–60.3 | 6.73–33.2 |
| Average | 57.22 | 40.74 | 27.08 | 46.52 | 33.48 | 18.66 |
Table 3.
Average maximum von Mises stress (MPa) at the smallest femoral neck cross-section (SFN CS), the intertrochanteric cross-section (IntT CS), and the subtrochanteric cross-section (SubT CS) of right and left femurs of 10 clinical cases during the single-leg stance.
| Maximum von Mises stress (MPa) | ||||||
|---|---|---|---|---|---|---|
| Right femurs | Left femurs | |||||
| SFN CS | IntT CS | SubT CS | SFN CS | IntT CS | SubT CS | |
| Range | 21.7–49.96 | 22.23–45.37 | 26.93–52.47 | 19.56–52.38 | 23.55–47.8 | 27.09–43.04 |
| Average | 33.63 | 32.97 | 37.89 | 32.93 | 32.41 | 35.84 |
Table 5.
Average maximum von Mises strain at the smallest femoral neck cross-section (SFN CS), the intertrochanteric cross-section (IntT CS), and the subtrochanteric cross-section (SubT CS) of right and left femurs of 10 clinical cases during the single-leg stance.
| Range | Average | ||
|---|---|---|---|
| Right femurs | |||
| SFN CS | 3.54E − 03–1.46E − 02 | 9.15E − 03 | |
| IntT CS | 5.89E − 03–1.74E − 02 | 1.08E − 02 | |
| Maximum von Mises strain | SubT CS | 2.3E − 03–4.75E − 03 | 3.32E − 03 |
| Left femurs | |||
| SFN CS | 5.25E − 03–1.55E − 02 | 9.55E − 03 | |
| IntT CS | 5.49E − 03–1.87E − 02 | 1.05E − 02 | |
| SubT CS | 2.14E − 03–4.34E − 03 | 3.11E − 03 |
Table 6.
Average maximum von Mises strain at the smallest femoral neck cross-section (SFN CS), the intertrochanteric cross-section (IntT CS), and the subtrochanteric cross-section (SubT CS) of right and left femurs of 10 clinical cases during the sideways fall.
| Range | Average | ||
|---|---|---|---|
| Right femurs | |||
| SFN CS | 1.67E − 02–1.04E − 01 | 5.29E − 02 | |
| IntT CS | 4.34E − 02–1.50E − 01 | 9.80E − 02 | |
| Maximum von Mises strain | SubT CS | 12E − 03–6.38E − 03 | 2.44E − 03 |
| Left femurs | |||
| SFN CS | 1.67E − 02–7.43E − 02 | 4.26E − 02 | |
| IntT CS | 3.35E − 02–1.91E − 01 | 9.37E − 02 | |
| SubT CS | 5.08E − 04–3.31E − 03 | 1.74E − 03 |
3.3. Comparison of Hip Fracture Risk at the Three Critical Cross-Sections
For the 60 clinical cases (30 females and 30 males), hip fracture risk indices based on the strain energy criterion were calculated for the smallest femoral neck, the intertrochanteric, and the subtrochanteric cross-section of femur during the single-leg stance and the sideways fall. The calculated fracture risk indices are shown in Figures 10 and 11.
Figure 10.
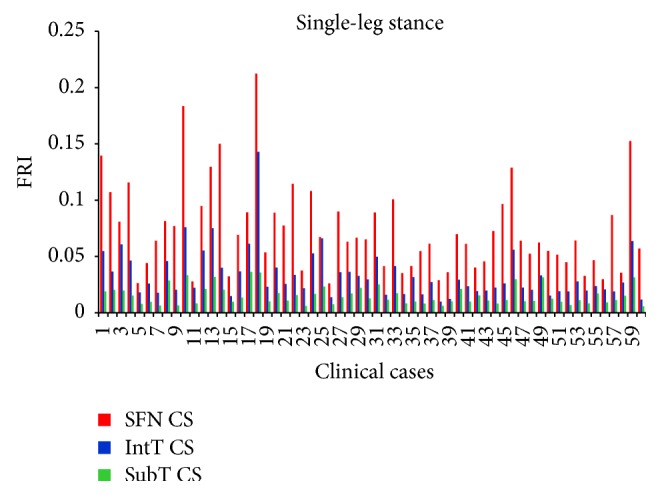
Fracture risk index in single-leg stance configuration.
Figure 11.
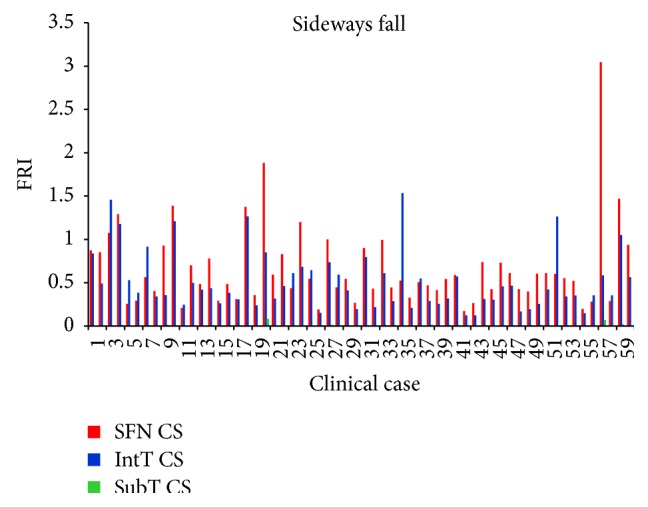
Fracture risk index in sideways fall configuration.
As shown in Tables 7, 8, 9, and 10 and Figures 12 and 13, the average FRI at the smallest femoral neck was higher than those at the intertrochanteric and the subtrochanteric cross-section during both the single-leg stance and sideways fall.
Table 7.
Average FRI at the three critical cross-sections of 60 right femurs during the single-leg stance.
| FRI | |||
|---|---|---|---|
| Smallest femoral neck cross-section | Intertrochanteric cross-section | Subtrochanteric cross-section | |
| Range | 0.0261–0.2124 | 0.0099–0.143 | 0.0058–0.0363 |
| Average | 0.0752 | 0.0351 | 0.0155 |
Table 8.
Average FRI at the three critical cross-sections of 60 left femurs during the single-leg stance.
| FRI | |||
|---|---|---|---|
| Smallest femoral neck cross-section | Intertrochanteric cross-section | Subtrochanteric cross-section | |
| Range | 0.023–0.1936 | 0.0095–0.1078 | 0.0037–0.0337 |
| Average | 0.0681 | 0.0329 | 0.0142 |
Table 9.
Average FRI at the three critical cross-sections of 60 right femurs during the sideways fall.
| FRI | |||
|---|---|---|---|
| Smallest femoral neck cross-section | Intertrochanteric cross-section | Subtrochanteric cross-section | |
| Range | 0.1725–3.0448 | 0.1226–1.534 | 0.0004–0.0812 |
| Average | 0.6944 | 0.5245 | 0.0091 |
Table 10.
Average FRI at the three critical cross-sections of 60 left femurs during the sideways fall.
| FRI | |||
|---|---|---|---|
| Smallest femoral neck cross-section | Intertrochanteric cross-section | Subtrochanteric cross-section | |
| Range | 0.1599–1.8301 | 0.116–1.5493 | 0.0004–0.0585 |
| Average | 0.6395 | 0.4864 | 0.0083 |
Figure 12.
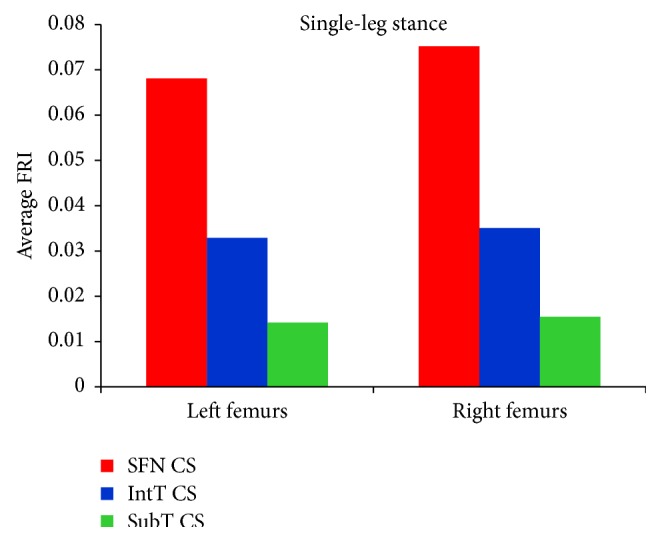
Average FRI at the smallest femoral neck cross-section (SFN CS), the intertrochanteric cross-section (IntT CS), and the subtrochanteric cross-section (SubT CS) of 60 right femurs and 60 left femurs during the single-leg stance.
Figure 13.
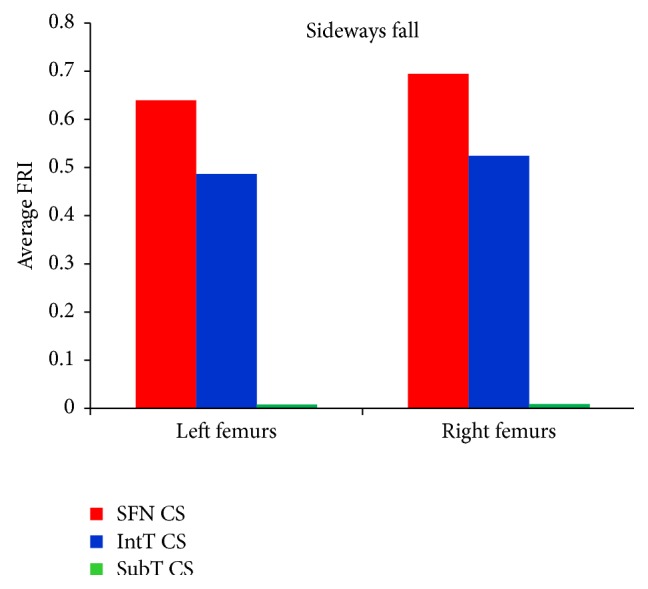
Average FRI at the smallest femoral neck cross-section (SFN CS), the intertrochanteric cross-section (IntT CS), and the subtrochanteric cross-section (SubT CS) of 60 right femurs and 60 left femurs during the sideways fall.
For the single-leg stance, FRIs for all cases at the three critical cross-sections are much lower than one (FRI ≪ 1), indicating that the possibility of hip fracture incidence in the single-leg stance was low. For the sideways fall, FRIs of 8 right femurs and 7 left femurs at the smallest femoral neck cross-section and FRIs of 7 right femurs and 5 left femurs at the intertrochanteric cross-section were higher than one (FRI > 1), meaning that there is possibility for fracture occurring in these regions; but the FRIs at the subtrochanteric cross-section in all cases were much lower than one (FRI ≪ 1), indicating that there is lower possibility of fracture in this region. Figure 14 shows the number of possible fractures at the three critical cross-sections of femur during the sideways fall, that is, the cases that have FRI larger than one (FRI > 1) at one of the three critical cross-sections.
Figure 14.
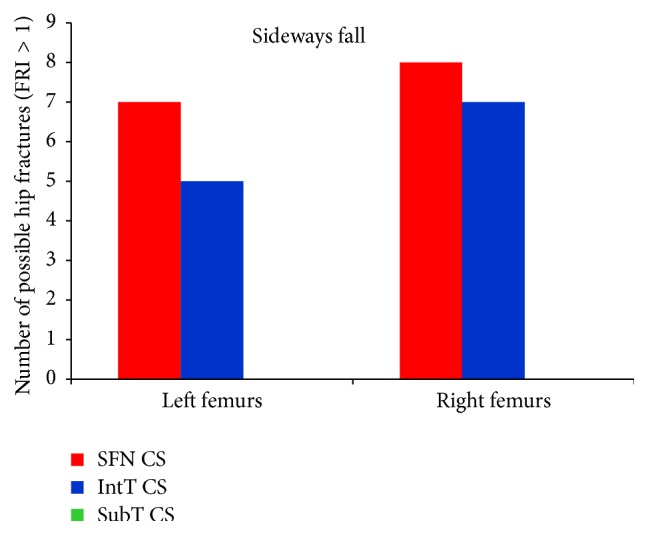
Number of possible hip fractures occurring at the smallest femoral neck cross-section (SFN CS), the intertrochanteric cross-section (IntT CS), and the subtrochanteric cross-section (SubT CS) of 60 right femurs and 60 left femurs during the sideways fall, that is, cases that have the FRI higher than one (FRI > 1) at one of the three critical cross-sections.
3.4. Comparison of Hip Fracture Risk in Women and Men
In this study, hip fracture risk for the 30 females and 30 males was assessed. The average hip fracture risk of females was generally higher than that of males. As it can be seen from Tables 11 –13 and Figures 15 and 16, the average FRI at the smallest femoral neck cross-section, the intertrochanteric cross-section, and the subtrochanteric cross-section of the 30 females is higher than that of the 30 males for both the single-leg stance and the sideways fall. Figure 17 shows the number of possible hip fractures in women and men during the sideways fall for the studied cases.
Table 11.
Average FRI at the smallest femoral neck cross-section of 30 females and 30 males during the single-leg stance and the sideways fall.
| FRI at the smallest femoral neck cross-section | ||||
|---|---|---|---|---|
| Single-leg stance | Sideways fall | |||
| Female | Male | Female | Male | |
| Range | 0.023–0.2124 | 0.0231–0.1628 | 0.1826–1.8809 | 0.1599–3.0448 |
| Average | 0.0816 | 0.0611 | 0.7035 | 0.6315 |
Table 12.
Average FRI at the intertrochanteric cross-section of 30 females and 30 males during the single-leg stance and the sideways fall.
| FRI at the intertrochanteric cross-section | ||||
|---|---|---|---|---|
| Single-leg stance | Sideways fall | |||
| Female | Male | Female | Male | |
| Range | 0.0138–0.143 | 0.0095–0.0637 | 0.1398–1.4572 | 0.116–1.5493 |
| Average | 0.042 | 0.0253 | 0.5666 | 0.4433 |
Table 13.
Average FRI at the subtrochanteric cross-section of 30 females and 30 males during the single-leg stance and the sideways fall.
| FRI at the subtrochanteric cross-section | ||||
|---|---|---|---|---|
| Single-leg stance | Sideways fall | |||
| Female | Male | Female | Male | |
| Range | 0.0037–0.0363 | 0.0053–0.0315 | 0.0004–0.0812 | 0.0004–0.0694 |
| Average | 0.0167 | 0.0129 | 0.0087 | 0.0088 |
Figure 15.
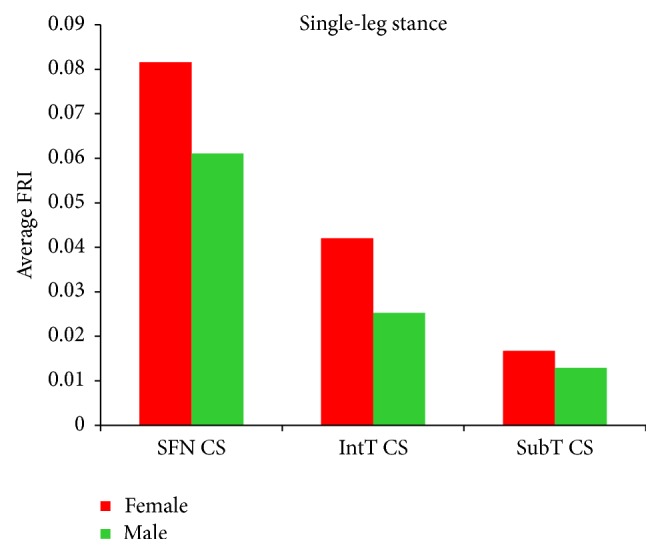
Average FRI at the smallest femoral neck cross-section (SFN CS), the intertrochanteric cross-section (IntT CS), and the subtrochanteric cross-section (SubT CS) of 30 females and 30 males during the single-leg stance.
Figure 16.
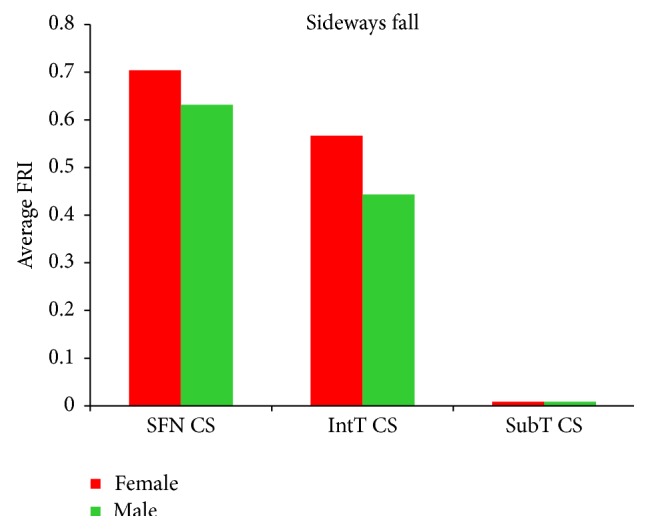
Average FRI at the smallest femoral neck cross-section (SFN CS), the intertrochanteric cross-section (IntT CS), and the subtrochanteric cross-section (SubT CS) of 30 females and 30 males during the sideways fall.
Figure 17.
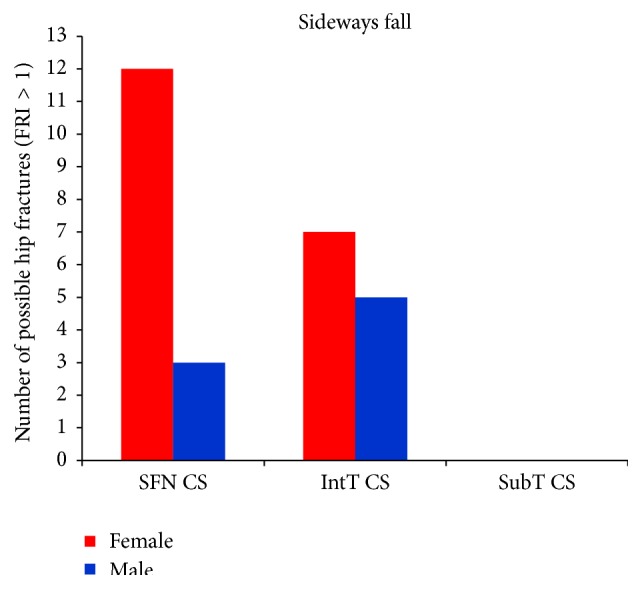
Number of possible hip fractures occurring at the smallest femoral neck cross-section (SFN CS), the intertrochanteric cross-section (IntT CS), and the subtrochanteric cross-section (SubT CS) of 30 females and 30 males during the sideways fall.
4. Discussion
Hip fracture may occur anywhere from the articular cartilage of the hip joint to the femur shaft [48]. Not only the location of the fracture types but also the etiology differs. It was reported that women with the intertrochanteric fracture have significantly lower BMD than those with the femoral neck fracture [49–51]. On the other hand, the femoral neck fracture may not be mainly attributed to low BMD but may be related to external causes such as sideways fall [52]. Femoral neck and intertrochanteric fractures are often the result of falls from standing height and impact onto the greater trochanter, particularly for the elderly. The subtrochanteric fractures, on the other hand, are typically the result of high energy impacts such as motor vehicle accidents and falls from a height [53].
The selection of bone failure criterion is challenging. In literatures, stress and strain based failure criteria such as the von Mises stress and strain criteria and the maximum principle stress and strain criteria were commonly used to assess hip fracture risk. To the best of our knowledge, the strain energy based failure criterion has not been used yet for hip fracture risk assessment. Whereas the cancellous bone failure is in the form of buckling and deformation (strain intensity) and the cortical bone failure is related to its local cracking (stress intensity), strain energy failure criterion, which is a combination of both stress and strain intensities, is theoretically more reasonable than other failure criteria for hip fracture risk assessment. The differences between the strains in the three critical regions of femur during both the single-leg stance and the sideways fall (Figure 9, Tables 5 and 6) are much higher than the differences between the corresponding stresses (Figure 8, Tables 3 and 4), indicating that bone failure is more sensitive to the strains because of its fragility property and the effects of strains should also be considered in bone fracture risk assessment.
Results of this study show that the femoral neck and the intertrochanteric region have higher fracture risk than the subtrochanteric region (Figures 12 and 13 and Tables 7–10), which is consistent with the fact that the femoral neck and the intertrochanteric region have a larger proportion of cancellous bone than the subtrochanteric region; and the cancellous bone is generally weaker than the cortical bone. Therefore, hip fracture is most likely to initiate first at the femoral neck and then in the intertrochanteric region or in the subtrochanteric region. For all subjects, there is very low hip fracture risk during the single-leg stance (FRI < 1). Among all the cases, during the sideways fall, 15 femurs at the femoral neck and 12 femurs at the intertrochanteric region have FRI higher than one (FRI > 1), while there is very low fracture risk at the subtrochanteric region for all the subjects (FRI < 1) (Figure 14). Our findings have a good agreement with the previous clinical observations. According to the clinical observations, the femoral neck is the most common location for a hip fracture, accounting for 45% to 53% of hip fractures; the intertrochanteric fractures account for approximately 38% to 50% of all hip fractures; and the subtrochanteric fractures are less common than the femoral neck and intertrochanteric fractures, accounting for approximately 5% to 15% of hip fractures [54, 55]. Also it was observed that, in old people with age between 65 and 99, femoral neck and intertrochanteric fractures occurred with approximately the same frequency [56]. Data on 176 geriatric patients with hip fractures showed that 59% were the intertrochanteric fractures while the rest (41%) were the intracapsular neck fractures [57]. In another study by Michelson et al. [43], it was observed that 37% of hip fractures are in the femoral neck, 49% are intertrochanteric, and 14% are subtrochanteric. Therefore, the femoral neck and the intertrochanteric region are more disposed to fracture than the subtrochanteric region.
Both the fracture risk level and the potential fracture location are patient-dependent and depend on BMD and other conditions that have not been studied in this paper. We have found that women generally have lower bone strength than men and thus are exposed to higher hip fracture risk during both the single-leg stance and the sideways fall (Figures 15 and 16 and Tables 11–13). Based on the calculated FRI, in the 30 women potentially there are 12 femoral neck fractures and 7 intertrochanteric fractures, while for the 30 men there are only 3 potential femoral neck and 5 potential intertrochanteric fractures (Figure 17). Our finding is consistent with other studies that have found that hip fracture risk in women is generally higher than in men. The results of a worldwide study by Dhanwal et al. [58] on incidence and epidemiology of hip fractures in Asia, Africa, Europe, Latin America, North America, and Oceania show that women are more disposed to the hip fracture risk than men in different countries over the world. In the study by Jacobsen et al. [59], the age-adjusted hip fracture incidence rates in white US males and females were 4.3 and 8.1 per 1,000 per year, respectively. Higher hip fracture risk in women may be related to their lower BMD.
5. Conclusion
A reliable methodology to assess hip fracture risk in individuals is crucially important for preventing hip fracture and initiating a treatment. The purpose of this study is to propose a more effective hip fracture risk index that is based on the strain energy failure criterion, and it is able to better describe bone failure mechanism and microstructure. The proposed fracture risk index can predict not only the fracture risk level, but also the potential fracture location. The results of this study showed that there is a very low hip fracture risk during the single-leg stance, while, during the sideways fall, there is a high fracture risk at the femoral neck and the intertrochanteric region, compared to the subtrochanteric region. Based on the results obtained from this study, women are more prone to hip fracture than men. The procedure described in this study can be implemented into computer programming and used in hip fracture prevention and monitoring of osteoporosis treatments in the elderly. The method may also help design more effective hip protectors by providing feedback information such as stresses/strains in the hip for adjusting the design parameters. The main limitation of this study is that no experiment has been conducted to validate the predicted fracture risk levels and potential fracture locations, which has been set as future work.
Conflict of Interests
The authors declare that there is no conflict of interests regarding the publication of this paper.
References
- 1.Resnick N. M., Greenspan S. L. ‘Senile’ osteoporosis reconsidered. Journal of the American Medical Association. 1989;261(7):1025–1029. doi: 10.1001/jama.1989.03420070075034. [DOI] [PubMed] [Google Scholar]
- 2.Gullberg B., Johnell O., Kanis J. A. World-wide projections for hip fracture. Osteoporosis International. 1997;7(5):407–413. doi: 10.1007/PL00004148. [DOI] [PubMed] [Google Scholar]
- 3.Johnell O. The socioeconomic burden of fractures: today and in the 21st century. The American Journal of Medicine. 1997;103(2):20S–26S. doi: 10.1016/s0002-9343(97)90023-1. [DOI] [PubMed] [Google Scholar]
- 4.Bauer J. S., Link T. M. Advances in osteoporosis imaging. European Journal of Radiology. 2009;71(3):440–449. doi: 10.1016/j.ejrad.2008.04.064. [DOI] [PubMed] [Google Scholar]
- 5.Albertsson D. M., Mellström D., Petersson C., Eggertsen R. Validation of a 4-item score predicting hip fracture and mortality risk among elderly women. Annals of Family Medicine. 2007;5(1):48–56. doi: 10.1370/afm.602. [DOI] [PMC free article] [PubMed] [Google Scholar]
- 6.Marshall D., Johnell O., Wedel H. Meta-analysis of how well measures of bone mineral density predict occurrence of osteoporotic fractures. British Medical Journal. 1996;312(7041):1254–1259. doi: 10.1136/bmj.312.7041.1254. [DOI] [PMC free article] [PubMed] [Google Scholar]
- 7.Kanis J. A., Johansson H., Oden A., McCloskey E. V. Assessment of fracture risk. European Journal of Radiology. 2009;71(3):392–397. doi: 10.1016/j.ejrad.2008.04.061. [DOI] [PubMed] [Google Scholar]
- 8.Kaptoge S., Benevolenskaya L. I., Bhalla A. K., et al. Low BMD is less predictive than reported falls for future limb fractures in women across Europe: results from the European Prospective Osteoporosis Study. Bone. 2005;36(3):387–398. doi: 10.1016/j.bone.2004.11.012. [DOI] [PubMed] [Google Scholar]
- 9.Järvinen T. L. N., Sievänen H., Khan K. M., Heinonen A., Kannus P. Shifting the focus in fracture prevention from osteoporosis to falls. British Medical Journal. 2008;336(7636):124–126. doi: 10.1136/bmj.39428.470752.ad. [DOI] [PMC free article] [PubMed] [Google Scholar]
- 10.McClung M. R. To FRAX or not to FRAX. Journal of Bone and Mineral Research. 2012;27(6):1240–1242. doi: 10.1002/jbmr.1651. [DOI] [PubMed] [Google Scholar]
- 11.Luo Y., Ferdous Z., Leslie W. D. A preliminary dual-energy X-ray absorptiometry-based finite element model for assessing osteoporotic hip fracture risk. Proceedings of the Institution of Mechanical Engineers Part H: Journal of Engineering in Medicine. 2011;225(12):1188–1195. doi: 10.1177/0954411911424975. [DOI] [PubMed] [Google Scholar]
- 12.Luo Y., Ferdous Z., Leslie W. D. Precision study of DXA-based patient-specific finite element modeling for assessing hip fracture risk. International Journal for Numerical Methods in Biomedical Engineering. 2013;29(5):615–629. doi: 10.1002/cnm.2548. [DOI] [PubMed] [Google Scholar]
- 13.Keyak J. H., Rossi S. A., Jones K. A., Skinner H. B. Prediction of femoral fracture load using automated finite element modeling. Journal of Biomechanics. 1997;31(2):125–133. doi: 10.1016/S0021-9290(97)00123-1. [DOI] [PubMed] [Google Scholar]
- 14.Lotz J. C., Cheal E. J., Hayes W. C. Fracture prediction for the proximal femur using finite element models: part I—linear analysis. Journal of Biomechanical Engineering. 1991;113(4):353–360. doi: 10.1115/1.2895412. [DOI] [PubMed] [Google Scholar]
- 15.Lotz J. C., Cheal E. J., Hayes W. C. Fracture prediction for the proximal femur using finite element models: part II—nonlinear analysis. Journal of Biomechanical Engineering. 1991;113(4):361–365. doi: 10.1115/1.2895413. [DOI] [PubMed] [Google Scholar]
- 16.Testi D., Viceconti M., Baruffaldi F., Cappello A. Risk of fracture in elderly patients: a new predictive index based on bone mineral density and finite element analysis. Computer Methods and Programs in Biomedicine. 1999;60(1):23–33. doi: 10.1016/s0169-2607(99)00007-3. [DOI] [PubMed] [Google Scholar]
- 17.Ota T., Yamamoto I., Morita R. Fracture simulation of the femoral bone using the finite-element method: how a fracture initiates and proceeds. Journal of Bone and Mineral Metabolism. 1999;17(2):108–112. doi: 10.1007/s007740050072. [DOI] [PubMed] [Google Scholar]
- 18.Schileo E., Taddei F., Cristofolini L., Viceconti M. Subject-specific finite element models implementing a maximum principal strain criterion are able to estimate failure risk and fracture location on human femurs tested in vitro. Journal of Biomechanics. 2008;41(2):356–367. doi: 10.1016/j.jbiomech.2007.09.009. [DOI] [PubMed] [Google Scholar]
- 19.Gong H., Zhang M., Fan Y., Kwok W. L., Leung P. C. Relationships between femoral strength evaluated by nonlinear finite element analysis and BMD, material distribution and geometric morphology. Annals of Biomedical Engineering. 2012;40(7):1575–1585. doi: 10.1007/s10439-012-0514-7. [DOI] [PubMed] [Google Scholar]
- 20.Keyak J. H., Rossi S. A. Prediction of femoral fracture load using finite element models: an examination of stress- and strain-based failure theories. Journal of Biomechanics. 2000;33(2):209–214. doi: 10.1016/s0021-9290(99)00152-9. [DOI] [PubMed] [Google Scholar]
- 21.Mirzaei M., Keshavarzian M., Naeini V. Analysis of strength and failure pattern of human proximal femur using quantitative computed tomography (QCT)-based finite element method. Bone. 2014;64:108–114. doi: 10.1016/j.bone.2014.04.007. [DOI] [PubMed] [Google Scholar]
- 22.Stölken J. S., Kinney J. H. On the importance of geometric nonlinearity in finite-element simulations of trabecular bone failure. Bone. 2003;33(4):494–504. doi: 10.1016/s8756-3282(03)00214-x. [DOI] [PubMed] [Google Scholar]
- 23.Cordey J., Gautier E. Strain gauges used in the mechanical testing of bones. Part I: theoretical and technical aspects. Injury. 1999;30(1):SA7–SA13. doi: 10.1016/s0020-1383(99)00120-5. [DOI] [PubMed] [Google Scholar]
- 24.Mirzaei M., Zeinali A., Razmjoo A., Nazemi M. On prediction of the strength levels and failure patterns of human vertebrae using quantitative computed tomography (QCT)-based finite element method. Journal of Biomechanics. 2009;42(11):1584–1591. doi: 10.1016/j.jbiomech.2009.04.042. [DOI] [PubMed] [Google Scholar]
- 25.Sih G. C. Strain-energy-density factor applied to mixed mode crack problems. International Journal of Fracture. 1974;10(3):305–321. doi: 10.1007/bf00035493. [DOI] [Google Scholar]
- 26.Sih G. C. Mechanics of Fracture Initiation and Propagation. Dordrecht, The Netherlands: Springer; 1991. [DOI] [Google Scholar]
- 27.Wei Y. An extended strain energy density failure criterion by differentiating volumetric and distortional deformation. International Journal of Solids and Structures. 2012;49(9):1117–1126. [Google Scholar]
- 28.Wolfe W. E., Butalia T. S. A strain-energy based failure criterion for non-linear analysis of composite laminates subjected to biaxial loading. Composites Science and Technology. 1998;58(7):1107–1124. doi: 10.1016/s0266-3538(96)00145-5. [DOI] [Google Scholar]
- 29.Butalia T. S., Wolfe W. E. A strain-energy-based non-linear failure criterion: comparison of numerical predictions and experimental observations for symmetric composite laminates. Composites Science and Technology. 2002;62(12-13):1697–1710. doi: 10.1016/s0266-3538(01)00203-2. [DOI] [Google Scholar]
- 30.Vasu R., Carter D. R., Harris W. H. Evaluation of bone cement failure criteria with applications to the acetabular region. Journal of Biomechanical Engineering. 1983;105(4):332–337. doi: 10.1115/1.3138429. [DOI] [PubMed] [Google Scholar]
- 31.Keyak J. H., Meagher J. M., Skinner H. B., Mote C. D., Jr. Automated three-dimensional finite element modelling of bone: a new method. Journal of Biomedical Engineering. 1990;12(5):389–397. doi: 10.1016/0141-5425(90)90022-f. [DOI] [PubMed] [Google Scholar]
- 32.Keaveny T. M., Borchers R. E., Gibson L. J., Hayes W. C. Trabecular bone modulus and strength can depend on specimen geometry. Journal of Biomechanics. 1993;26(8):991–1000. doi: 10.1016/0021-9290(93)90059-N. [DOI] [PubMed] [Google Scholar]
- 33.Les C. M., Keyak J. H., Stover S. M., Taylor K. T., Kaneps A. J. Estimation of material properties in the equine metacarpus with use of quantitative computed tomography. Journal of Orthopaedic Research. 1994;12(6):822–833. doi: 10.1002/jor.1100120610. [DOI] [PubMed] [Google Scholar]
- 34.Dragomir-Daescu D., Buijs J. O. D., McEligot S., et al. Robust QCT/FEA models of proximal femur stiffness and fracture load during a sideways fall on the hip. Annals of Biomedical Engineering. 2011;39(2):742–755. doi: 10.1007/s10439-010-0196-y. [DOI] [PMC free article] [PubMed] [Google Scholar]
- 35.Keller T. S. Predicting the compressive mechanical behavior of bone. Journal of Biomechanics. 1994;27(9):1159–1168. doi: 10.1016/0021-9290(94)90056-6. [DOI] [PubMed] [Google Scholar]
- 36.Reilly D. T., Burstein A. H. The elastic and ultimate properties of compact bone tissue. Journal of Biomechanics. 1975;8(6):393–405. doi: 10.1016/0021-9290(75)90075-5. [DOI] [PubMed] [Google Scholar]
- 37.van Buskirk W. C., Ashman R. B. The elastic moduli of bone. Transaction of American Society of Mechanical Engineers. 1981;45:131–143. [Google Scholar]
- 38.Yoshikawa T., Turner C. H., Peacock M., et al. Geometric structure of the femoral neck measured using dual-energy x-ray absorptiometry. Journal of Bone and Mineral Research. 1994;9(7):1053–1064. doi: 10.1002/jbmr.5650090713. [DOI] [PubMed] [Google Scholar]
- 39.Bessho M., Ohnishi I., Matsumoto T., et al. Prediction of proximal femur strength using a CT-based nonlinear finite element method: differences in predicted fracture load and site with changing load and boundary conditions. Bone. 2009;45(2):226–231. doi: 10.1016/j.bone.2009.04.241. [DOI] [PubMed] [Google Scholar]
- 40.Koivumäki J. E. M., Thevenot J., Pulkkinen P., et al. Ct-based finite element models can be used to estimate experimentally measured failure loads in the proximal femur. Bone. 2012;50(4):824–829. doi: 10.1016/j.bone.2012.01.012. [DOI] [PubMed] [Google Scholar]
- 41.Nishiyama K. K., Gilchrist S., Guy P., Cripton P., Boyd S. K. Proximal femur bone strength estimated by a computationally fast finite element analysis in a sideways fall configuration. Journal of Biomechanics. 2013;46(7):1231–1236. doi: 10.1016/j.jbiomech.2013.02.025. [DOI] [PubMed] [Google Scholar]
- 42.Robinovitch S. N., Hayes W. C., McMahon T. A. Prediction of femoral impact forces in falls on the hip. Journal of Biomechanical Engineering. 1991;113(4):366–374. doi: 10.1115/1.2895414. [DOI] [PubMed] [Google Scholar]
- 43.Michelson J. D., Myers A., Jinnah R., Cox Q., Van Natta M. Epidemiology of hip fractures among the elderly: risk factors for fracture type. Clinical Orthopaedics and Related Research. 1995;(311):129–135. [PubMed] [Google Scholar]
- 44.Kim J. S., Park T. S., Park S. B., Kim J. S., Kim I. Y., Kim S. I. Measurement of femoral neck anteversion in 3D. Part 1: 3D imaging method. Medical and Biological Engineering and Computing. 2000;38(6):603–609. doi: 10.1007/BF02344864. [DOI] [PubMed] [Google Scholar]
- 45.Atilla B., Oznur A., Caǧlar O., Tokgözoǧlu M., Alpaslan M. Osteometry of the femora in Turkish individuals: a morphometric study in 114 cadaveric femora as an anatomic basis of femoral component design. Acta orthopaedica et Traumatologica Turcica. 2007;41(1):64–68. [PubMed] [Google Scholar]
- 46.Sariali E., Mouttet A., Pasquier G., Durante E. Three-dimensional hip anatomy in osteoarthritis: analysis of the femoral offset. Journal of Arthroplasty. 2009;24(6):990–997. doi: 10.1016/j.arth.2008.04.031. [DOI] [PubMed] [Google Scholar]
- 47.Nikander R., Kannus P., Dastidar P., et al. Targeted exercises against hip fragility. Osteoporosis International. 2009;20(8):1321–1328. doi: 10.1007/s00198-008-0785-x. [DOI] [PubMed] [Google Scholar]
- 48.Abrahamsen B., van Staa T., Ariely R., Olson M., Cooper C. Excess mortality following hip fracture: a systematic epidemiological review. Osteoporosis International. 2009;20(10):1633–1650. doi: 10.1007/s00198-009-0920-3. [DOI] [PubMed] [Google Scholar]
- 49.Vega E., Mautalen C., Gómez H., Garrido A., Melo L., Sahores A. O. Bone mineral density in patients with cervical and trochanteric fractures of the proximal femur. Osteoporosis International. 1991;1(2):81–86. doi: 10.1007/bf01880448. [DOI] [PubMed] [Google Scholar]
- 50.Nakamura N., Kyou T., Takaoka K., Ohzono K., Ono K. Bone mineral density in the proximal femur and hip fracture type in the elderly. Journal of Bone and Mineral Research. 1992;7(7):755–759. doi: 10.1002/jbmr.5650070705. [DOI] [PubMed] [Google Scholar]
- 51.Greenspan S. L., Myers E. R., Maitland L. A., Kido T. H., Krasnow M. B., Hayes W. C. Trochanteric bone mineral density is associated with type of hip fracture in the elderly. Journal of Bone and Mineral Research. 1994;9(12):1889–1894. doi: 10.1002/jbmr.5650091208. [DOI] [PubMed] [Google Scholar]
- 52.Mautalen C. A., Vega E. M., Einhorn T. A. Are the etiologies of cervical and trochanteric hip fractures different? Bone. 1996;18(3, supplement):133S–137S. doi: 10.1016/8756-3282(95)00490-4. [DOI] [PubMed] [Google Scholar]
- 53.Birrer R. B. Field Guide to Fracture Management. Lippincott Williams & Wilkins; 2005. [Google Scholar]
- 54.Koval K. J., Zuckerman J. D. Hip fractures: I. Overview and evaluation and treatment of femoral-neck fractures. Journal of the American Academy of Orthopaedic Surgeons. 1994;2(3):141–149. doi: 10.5435/00124635-199405000-00002. [DOI] [PubMed] [Google Scholar]
- 55.Fixing Hip Fractures. March 2015, http://www.hopkinsmedicine.org/gec/series/fixing_hip_fractures.
- 56.Karagas M. R., Lu-Yao G. L., Barrett J. A., Beach M. L., Baron J. A. Heterogeneity of hip fracture: age, race, sex, and geographic patterns of femoral neck and trochanteric fractures among the US elderly. American Journal of Epidemiology. 1996;143(7):677–682. doi: 10.1093/oxfordjournals.aje.a008800. [DOI] [PubMed] [Google Scholar]
- 57.Trikha V., Rastogi S. Epidemiology and rehabilitation of hip fractures in the geriatric population. Indian Journal of Physical Medicine and Rehabilitation. 2005;16(1):16–19. [Google Scholar]
- 58.Dhanwal D. K., Dennison E. M., Harvey N. C., Cooper C. Epidemiology of hip fracture: worldwide geographic variation. Indian Journal of Orthopaedics. 2011;45(1):15–22. doi: 10.4103/0019-5413.73656. [DOI] [PMC free article] [PubMed] [Google Scholar]
- 59.Jacobsen S. J., Goldberg J., Miles T. P., Brody J. A., Stiers W., Rimm A. A. Hip fracture incidence among the old and very old: a population-based study of 745,435 cases. The American Journal of Public Health. 1990;80(7):871–873. doi: 10.2105/ajph.80.7.871. [DOI] [PMC free article] [PubMed] [Google Scholar]


