

Abstract
Inflammation, which may be present in a subgroup of individuals with major depressive disorder (MDD), activates the kynurenine metabolic pathway to produce kynurenine metabolites kynurenic acid (KynA) and quinolinic acid (QA). We have previously reported an association between the ratio of KynA to QA and hippocampal volume in MDD. In animals, inflammation leads to deficits in incentive motivation. Given the central role of the nucleus accumbens (NAcc) and other regions of the striatum in motivated behavior, reward processing, and anhedonia, we hypothesized that abnormalities in the concentrations of kynurenine pathway metabolites would be associated with striatal volumes. As previously reported, after controlling for relevant confounds, the KynA/QA ratio was reduced in the serum of unmedicated patients with MDD (n=53) versus healthy controls (HC, n=47) and there was a non-significant trend in the correlation between KynA/QA and severity of anhedonia (r=−0.27, p<0.1). There was no significant difference between the MDD and HC groups in any of the individual kynurenine metabolites or volume of the striatum defined as the sum of the volumes of the NAcc, caudate, and putamen. After regressing out the effects of sex, analysis batch, and supratentorial volume, the kynurenine concentration and the ratio of kynurenine to tryptophan were inversely associated with striatal volumes in the MDD sample (p<0.05, uncorrected). Further, striatal volume was correlated with the items, “concentration difficulties”, “lassitude”, and “pessimism” from the Montgomery-Asberg Depression Rating Scale. Our results raise the possibility that activation of the kynurenine pathway is a marker of an inflammatory process that leads to reductions in striatal volume. However, unlike the hippocampus, the association does not appear to be mediated by the relative balance between KynA and QA.
Keywords: Kynurenine metabolic pathway, quinolinic acid, inflammation, striatum, anhedonia, magnetic resonance imaging
Introduction
Reductions in hippocampal volume are widely reported in major depressive disorder (MDD) and are thought to reflect dendritic atrophy (Savitz and Drevets, 2009; Stockmeier et al., 2004). We previously reported that the ratio of kynurenic acid (KynA, an NMDA receptor antagonist) to quinolinic acid (QA, an NMDA receptor agonist) in serum was positively correlated with hippocampal volume, raising the possibility of an inflammatory, glutamate-mediated contribution to certain structural brain abnormalities observed in MDD. The current paper builds on this work by addressing the regional specificity of these findings. We focused on the striatum given the relationship between inflammation-induced deficits in incentive motivation and anhedonia (Dantzer et al., 2011; Vichaya et al., 2014; Yirmiya et al., 2000), evidence for reductions in striatal volume in MDD (Kempton et al., 2011), and reports of interferon α-induced changes in glutamatergic neurotransmission in the striatum that correlated with motivation and fatigue (Capuron et al., 2007; Haroon et al., 2014), as well as interferon α and endotoxin-induced decreases in the hemodynamic response to rewarding stimuli in the ventral striatum (Capuron et al., 2012; Eisenberger et al., 2010).
Methods
Subjects provided written informed consent as approved by the IRB.
The clinical characteristics of the sample, neuroimaging procedures, and kynurenine metabolite measurements have been described in detail elsewhere (Savitz et al., 2015a). Briefly, MDD and HC participants were interviewed with the Structured Clinical Interview for the DSM-IV-TR and in addition, unstructured interviews with psychiatrists were obtained on all MDD subjects. The severity of depressive symptoms was assessed with the Hamilton Depression Rating Scale (HAM-D, 24-item) and the Montgomery Asberg Depression Rating Scale (MADRS); the majority of the MDD participants were moderately-to-severely depressed (table 1). Anhedonic symptoms were assessed with the Snaith-Hamilton Pleasure Scale (SHAPS).
Table 1.
Means and standard deviations of demographic data, clinical ratings, basal ganglia volumes, and kynurenine metabolite concentrations in the MDD and HC groups.
| MDD | Healthy | Statistic | |
|---|---|---|---|
| N | 53 | 47 | - |
| Age | 34.6±9.80 | 34.3±11.4 | t99=0.885 |
| Sex (% F) | 79 | 62 | X2=3.7, p=0.054 |
| BMI | 27.5±5.20 | 26.8±6.31 | t99=0.567 |
| HAM-D (24) | 23.7±8.8 | 0.9±1.6 | t99<0.001 |
| MADRS | 27.5±10.0 | 0.7±1.7 | t97<0.001 |
| SHAPS | 30.4±6.3 | 18.8±5.3 | t94<0.001 |
| Striatum | 18400±2147 | 18699±2004 | F3,100=1.4, p=0.240 Ψ |
| NAcc | 1096±176 | 1106±214 | F3,100=3.0, p=0.084 Ψ |
| Caudate | 7057±1033 | 7223±1004 | F3,100=0.9, p=0.350 Ψ |
| Putamen | 10053±1163 | 10370±1009 | F3,100=0.1, p=0.743 Ψ |
| Supratentorial | 986931±87387 | 1039414±11072 | F3,100=3.6, p=0.061 Φ |
| hs-CRP | 2.65±2.96 | 2.61±3.60 | F2, 75=1.3, p=0.263 Φ |
| TRP | 52.4±9.8 | 56.6±11.9 | F3,100=0.1, p=0.706 Ω |
| Kyn | 1.90±0.48 | 1.95±0.49 | F3,100=0.2, p=0.667 Ω |
| KynA | 38.0±11.4 | 40.6±14.0 | F3,91=0.8, p=0.361 Ω |
| 3HK | 37.2±12.6 | 35.9±17.4 | F3,100=0.01, p=0.950 Ω |
| QA | 382.8±172.8 | 340.1±102.8 | F3,100=1.3, p=0.252 Ω |
| Kyn/TRP | 0.037±0.013 | 0.034±0.009 | F3,100=0.1, p=0.862 Ω |
| KynA/3HK | 1.059±0.35 | 1.236±0.40 | F3,91=2.9, p=0.091 Ω |
| KynA/QA | 0.107±0.04 | 0.125±0.04 | F3,91=5.2, p=0.024 Ω |
Note: CRP data were available for 76 individuals and KYNA data were available for 91 individuals. One healthy control with a BMI of 35 was an outlier with a CRP score of 26.8. After including this individual the mean CRP score of the HC was 3.27±4.69.
after controlling for sex and supratentorial volume
after controlling for sex
after controlling for sex and batch
Abbreviations: MDD=major depressive disorder, BMI=body mass index, HAM-D 24= Hamilton Depression Rating Scale (24 item version), MADRS = Montgomery-Asberg Depression Rating Scale, SHAPS=Snaith Hamilton Pleasure Scale, NAcc=nucleus accumbens, hs-CRP=high-sensitivity c-reactive protein, TRP=tryptophan, Kyn=kynurenine, KynA=kynurenic acid, 3HK=3-hydroxykynurenine, QA=quinolinic acid, Kyn/TRP=ratio of kynurenine to tryptophan, KynA/3HK= ratio of kynurenic acid to 3-hydroxykynurenine, KynA/QA=ratio of kynurenic acid to quinolinic acid.
The unmedicated MDD participants had not received any psychotropic medication for at least 3 weeks (8 for fluoxetine) prior to the blood-draw and MRI scan. Exclusion criteria were as follows: serious suicidal behavior; medical conditions or concomitant medications likely to influence CNS or immunological function including cardiovascular, respiratory, endocrine and neurological diseases, and a history of drug or alcohol abuse within 6 months or a history of drug or alcohol dependence within 1 year. Healthy controls met the same entrance criteria and in addition had no first-degree relative with a psychiatric disorder.
Participants fasted overnight and blood was sampled between 8am–11am. Serum samples were collected within 3 days of the MRI scan with BD Vacutainer serum tubes, processed according to the standard BD Vacutainer protocol, and stored at −80° C. Concentrations of tryptophan (TRP), kynurenine (KYN), kynurenic acid (KynA), 3-hydroxykynurenine (3HK), and quinolinic acid (QA) were measured blind to diagnosis by Brains Online, LLC in 3 separate batches. The metabolite concentrations were determined by high performance liquid chromatography with tandem mass spectrometry detection using their standard protocols. High-sensitivity C-reactive protein (CRP) was measured using the Kamiya Biomedical K-Assay.
Images were acquired on a 3T GE MRI scanner with a 32 channel coil using a magnetization-prepared, rapid gradient echo (MP-RAGE) pulse sequence with sensitivity encoding optimized for tissue contrast resolution. The automated segmentation program, FreeSurfer (http://surfer.nmr.mgh.harvard.edu/) was used to obtain unbiased GM volumes of the NAcc, caudate, putamen, and supratentorial volume using the default analysis settings (Figure 1). Total striatal volume was defined as the sum of the NAcc, caudate, and putamen.
Figure 1.
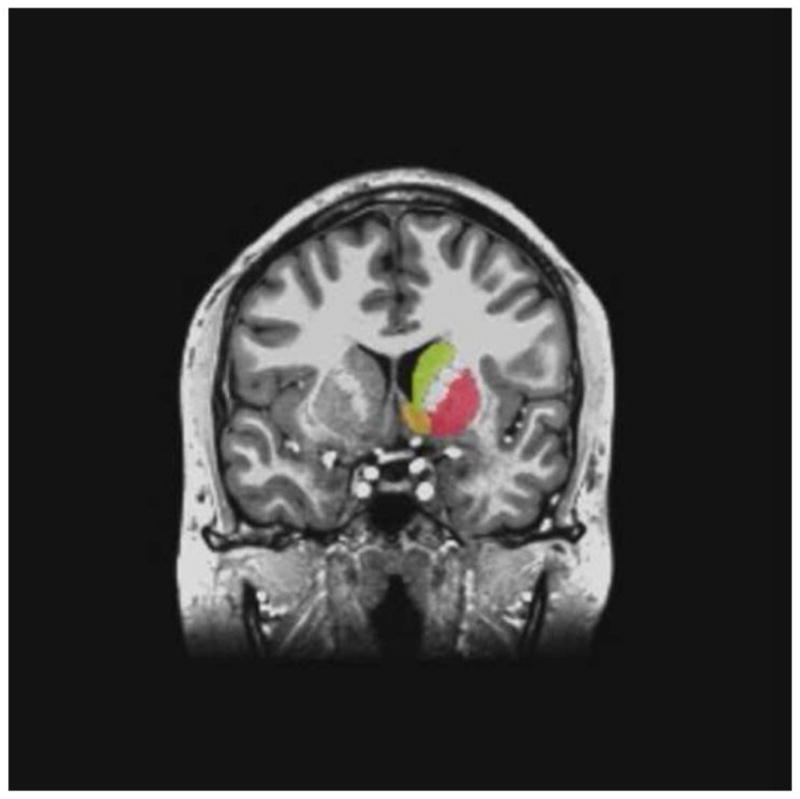
Representative example of the segmentation of the caudate (yellow), nucleus accumbens (orange), and putamen (red) by FreeSurfer shown in the coronal plane. The FreeSurfer mask is shown for the right hemisphere with the corresponding unsegmented structures in the left hemisphere.
Non-normally distributed variables (the Kolmogorov-Smirnov test) were log normalized. Diagnostic group differences in kynurenine metabolites and striatal volumes were evaluated with ANOVA (two-tailed, p<0.05). Sex, which trended towards differing among the subject groups (Table 1), and analysis batch were used as covariates for the kynurenine metabolite analysis. Supratentorial volume and sex were added as covariates for the volumetric analysis. Linear regression analyses were used to test whether the kynurenine metabolites were associated with striatal volumes within the MDD group. Where significant associations with striatal volumes were observed, post-hoc exploratory analyses of the NAcc, caudate, and putamen were conducted in order to address the specificity of the finding.
Results
After adjusting for sex and supratentorial volume, there was no difference between the MDD and HC groups in the total striatal volume (F3,100=1.4, p=0.240, table 1). Further, there was no significant association between depression severity or anhedonia rating scale scores and striatal volume in the MDD group although the association between striatal volume and MADRS scores approached significance (r=−0.25, p=0.071). Because the association between MADRS scores and striatal volume approached statistical significance, we analyzed the correlation coefficients between striatal volume and the individual items of the MADRS. There were significant inverse correlations between striatal volume and the following items “concentration difficulties” (r=−0.45, p=0.004), “lassitude” (r=−0.45, p=0.004), and “pessimism” (r=−0.50, p=0.001). Since the MADRS consists of 10 items, all 3 of these correlations remained significant after Bonferroni correction.
Consistent with the known effects of inflammation on indoleamine 2,3-deoxygenase (IDO) and kynurenine monooxygenase (KMO), in the combined sample of healthy and depressed participants, CRP was significantly correlated with 3HK (rs=0.39, p=0.001), QA (rs=0.24, p=0.034), KynA/3HK (rs=−0.31, p=0.009), and KynA/QA (r=−0.35, p=0.038), and showed a non-significant trend in the case of Kyn/TRP (rs=0.22, p=0.058).
Consistent with our previous reports in two overlapping samples (Savitz et al., 2015a; Savitz et al., 2015b) KynA/QA was reduced in the MDD versus the HC groups after controlling for sex and the batch in which the kynurenine metabolite data were analyzed (F3,91=5.2, p=0.024). Further, the association between anhedonic symptoms and KynA/QA trended significant (r=−0.27, p=0.072). The sample studied herein contains 10 healthy controls and 13 patients with MDD that were not previously included in either of the previous papers. The mean KynA/QA ratio of this small subset of new participants was 0.088±0.042 for the MDD group and 0.098±0.033 for the HC group.
After adjusting for batch effects there was no significant association between KynA/QA and striatal volume in the MDD subjects. However, log Kyn/TRP (β=−0.28, p=0.049), a surrogate marker of IDO activity, was significantly associated with striatal volume in the MDD group. After adjusting for batch, sex, and supratentorial volume there was no significant association between KynA/QA and striatal volume in the MDD subjects but the association between log Kyn/TRP and striatal volume remained significant (β=−0.21, p=0.041). Further, the association between log kynurenine and striatal volume was significant (β=−0.22, p=0.036) after adjusting for batch, sex, and supratentorial volumes. Post-hoc, exploratory analyses indicated that kynurenine and Kyn/TRP were not significantly associated with volumes of the NAcc, caudate or putamen after controlling for batch, sex, and supratentorial volume.
Because kynurenine and Kyn/TRP were significantly associated with striatal volume in the MDD group, a similar analysis was conducted in the HC group, and no significant association between log10 kynurenine (β=0.06, p=0.591) or log10 Kyn/TRP (β=0.09, p=0.440) and striatal volumes was found.
Discussion
The principal findings of this study are that activation of the kynurenine pathway is inversely associated with volume of the striatum in depressed but not healthy participants; this despite the fact that neither the Kyn/TRP quotient nor the striatal volumes differed between the HC and MDD groups. We were unable, however, to extend our previous results demonstrating an association between hippocampal volume and KynA/QA in MDD to the striatum.
Regarding the first finding, IDO activity is increased in the context of inflammation and thus the inverse relationship between Kyn/TRP and striatal volume is potentially consistent with the abnormal response to rewarding stimuli observed in patients treated with pro-inflammatory medications (Capuron et al., 2007; Haroon et al., 2014), HCs given endotoxin (Eisenberger et al., 2010), and patients with primary MDD (Savitz and Drevets, 2009). How does one then explain the absence of differences in Kyn/TRP between the groups? Because of the necessity of matching for BMI, both the MDD and HC groups showed on average evidence of inflammation (mean CRP scores of 2.65 and 2.61, respectively, table 1) and thus approximately equal activation of the kynurenine pathway. In order to explain why IDO activation is associated with striatal volumes in MDD patients but not healthy controls despite similar Kyn/Trp concentrations in the two groups we hypothesize that inflammation has functional rather than structural effects in the striatum, affecting mainly dopamine signaling (Felger et al., 2015; Felger and Miller, 2012).
IDO-associated changes in dopamine may in turn be linked to striatal volume because the mesostriatal dopamine projections impinge on the axon terminals of afferent glutamatergic projections within the striatum and dopaminergic transmission thereby modulates the release of glutamate at synapses on striatal neurons. A reduction in mesostriatal dopamine release thus could disinhibit glutamatergic transmission from corticolimbic projections into the striatum.
A recent meta-analysis reported that depression-associated reductions in striatal volume are relatively modest with an effect size of 0.22–0.25 versus for example, 0.47 for the hippocampus (Kempton et al., 2011). In contrast, the reduction in striatal volume observed here was subtle (~2%), translating into an effect size of 0.07, although the NAcc volume did trend lower in the MDD group (p=0.084) after controlling for sex and supratentorial volume (table 1). Conceivably, the discrepancy in results may relate to the fact that our sample was unmedicated and moderately-to-severely depressed as the only other study that measured striatal volumes in unmedicated MDD subjects using FreeSurfer also found no volumetric differences between MDD and HC subjects although depression severity and anhedonia was inversely correlated with caudate volume in the MDD group (Pizzagalli et al., 2009). Here the inverse correlation between total striatal volume and MADRS scores trended significant (r=−0.25, p=0.071), and reached significance in the case of the right striatum (r=−0.27, p=0.049) and right putamen (r=−0.25, p=0.050). Further, the individual item level analysis showed that striatal volumes were associated with “concentration difficulties”, “lassitude”, and “pessimism” (p<0.05, corrected). Interestingly, (Capuron et al., 2011) previous reported that tryptophan concentration was inversely correlated with the MADRS items - “lassitude” and “pessimism” in a healthy elderly sample. Thus it appears that striatal volume is of clinical relevance and may be related to depression severity even when volumes do not differ between depressed and healthy subjects. Notably, several studies have demonstrated a positive correlation between volume of the striatum and reductions in BOLD signal or functional connectivity in response to rewards (Yip et al., 2015), suggesting the histopathology reflected by volumetric changes influences striatal function.
Notably, KynA and QA reportedly act as weak NMDA receptor antagonists and agonists, respectively, and given the evidence from MRS, PET, and fMRI studies that glutamatergic signaling in the striatum is altered by inflammatory stimuli (Capuron et al., 2007; Eisenberger et al., 2010; Haroon et al., 2014), the fact that we were unable to extend our previous results demonstrating an association between hippocampal volume and KynA/QA in MDD to the striatum was intriguing. One possibility is that the striatal neurons are less vulnerable to undergoing dendritic atrophy under chronic or repeated stress or increased glutamatergic transmission. Another possibility is that even though the dopaminergic system plays a key role in depression and anhedonia, the primary pathology is located in afferent structures such as the hippocampus (Belujon and Grace, 2015). It has been proposed that activation of the hippocampal subiculum results in an increase in the number of spontaneously active neurons in the ventral tegmental area (VTA), and because burst firing (phasic neurotransmission) can only occur in spontaneously activated neurons (tonically activated), the subiculum effectively controls the number of neurons that can be phasically activated (Belujon and Grace, 2015). Conceivably, abnormal concentrations of KynA and/or QA may negatively impact the hippocampus such that the function of the glutamatergic projections from the subiculum to the striatum is impaired.
Given that we tested the relationship between striatal volume and 9 different metabolites, a Bonferroni correction for multiple comparisons would require the use of a statistical threshold of p<0.006. However, a Bonferroni correction is overly conservative in cases such as this one where the metabolites comprise one biological pathway and thus are clearly not independent of each other. Further, we conducted two-tailed tests despite the directionality of our original hypotheses. Nevertheless, given the modest p-values, we cannot rule out the possibility of Type I error and our results require replication in an independent sample.
The main limitation of the study is the use of peripheral immune markers. However, 3HK and kynurenine can cross the blood brain barrier while peripheral levels of KynA are important because increased production of KynA from kynurenine is putatively neuroprotective since less kynurenine can enter into the brain to be transformed into QA in the context of inflammation (Agudelo et al., 2014). This may explain why consistent with our finding of decreased KynA/QA in the serum of MDD patients, chronic decreases in KynA and elevations in QA have been reported in the cerebrospinal fluid of suicide attempters (Bay-Richter et al., 2015). Theoretically, the negative results reported herein may have been due to a lack of statistical power. While, we previously reported an association between hippocampal volume and KynA/QA in a sample of 29 MDD subjects (Savitz et al., 2015a), if the effect of KynA/QA on striatal volumes has a substantially lower effect size than the relationship between KynA/QA and hippocampal volumes, then our study may have been under-powered to detect a true effect.
In sum, our results raise suggest that activation of the kynurenine pathway affects striatal volume in MDD patients to an extent that has clinical significance even in the absence of gross reductions in striatal volume in depressed subjects relative to HCs.
Highlights.
The ratio of kynurenic acid (KynA) to quinolinic acid (QA) was reduced in MDD
KynA/QA was not associated with striatal volume in the MDD group
Activation of the kynurenine pathway was associated with striatal volume in MDD
Acknowledgments
The authors acknowledge Marieke van der Hart, Ph.D., at Brains Online for excellence in HPLC sample analysis.
The authors also thank all the research participants and wish to acknowledge the contributions of Brenda Davis, Debbie Neal, Chibing Tan, and Ashlee Taylor from the laboratory of TKT at the University of Oklahoma Integrative Immunology Center towards the transport, processing and handling of all blood samples.
Footnotes
Financial Disclosures
This study was funded by a grant from the National Institute of Mental Health to JS (K01MH096077). JS, BEW, TAV, BNF, HMM, and JB received support from The William K. Warren Foundation. The funders of the study played no role in the collection, analysis, and interpretation of data; in the writing of the manuscript; and in the decision to submit the manuscript for publication.
Dr. Savitz declares no competing interests but in the spirit of full disclosure notes that in the past 3 years he has received research funding from Janssen Pharmaceuticals for an independent study and a lecture honorarium from University of Kansas-Wichita. Dr. Dantzer has received consulting fees from Ironwood Pharma, Cambridge, MA, and an honorarium from Pfizer, France. Wayne Drevets, M.D. is an employee of Janssen Pharmaceuticals of Johnson & Johnson, Inc., Titusville, NJ, USA, and received within the past 3 years lecture honoraria or consulting fees from Johns-Hopkins University and The University of Illinois at Chicago. The other authors have no disclosures.
Publisher's Disclaimer: This is a PDF file of an unedited manuscript that has been accepted for publication. As a service to our customers we are providing this early version of the manuscript. The manuscript will undergo copyediting, typesetting, and review of the resulting proof before it is published in its final citable form. Please note that during the production process errors may be discovered which could affect the content, and all legal disclaimers that apply to the journal pertain.
References
- Agudelo LZ, Femenia T, Orhan F, Porsmyr-Palmertz M, Goiny M, Martinez-Redondo V, Correia JC, Izadi M, Bhat M, Schuppe-Koistinen I, Pettersson AT, Ferreira DM, Krook A, Barres R, Zierath JR, Erhardt S, Lindskog M, Ruas JL. Skeletal muscle PGC-1alpha1 modulates kynurenine metabolism and mediates resilience to stress-induced depression. Cell. 2014;159:33–45. doi: 10.1016/j.cell.2014.07.051. [DOI] [PubMed] [Google Scholar]
- Bay-Richter C, Linderholm KR, Lim CK, Samuelsson M, Traskman-Bendz L, Guillemin GJ, Erhardt S, Brundin L. A role for inflammatory metabolites as modulators of the glutamate N-methyl-d-aspartate receptor in depression and suicidality. Brain Behav Immun. 2015;43:110–117. doi: 10.1016/j.bbi.2014.07.012. [DOI] [PubMed] [Google Scholar]
- Belujon P, Grace AA. Regulation of dopamine system responsivity and its adaptive and pathological response to stress. Proc Biol Sci. 2015;282 doi: 10.1098/rspb.2014.2516. [DOI] [PMC free article] [PubMed] [Google Scholar]
- Capuron L, Pagnoni G, Demetrashvili MF, Lawson DH, Fornwalt FB, Woolwine B, Berns GS, Nemeroff CB, Miller AH. Basal ganglia hypermetabolism and symptoms of fatigue during interferon-alpha therapy. Neuropsychopharmacology. 2007;32:2384–2392. doi: 10.1038/sj.npp.1301362. [DOI] [PubMed] [Google Scholar]
- Capuron L, Pagnoni G, Drake DF, Woolwine BJ, Spivey JR, Crowe RJ, Votaw JR, Goodman MM, Miller AH. Dopaminergic mechanisms of reduced basal ganglia responses to hedonic reward during interferon alfa administration. Archives of General Psychiatry. 2012;69:1044–1053. doi: 10.1001/archgenpsychiatry.2011.2094. [DOI] [PMC free article] [PubMed] [Google Scholar]
- Capuron L, Schroecksnadel S, Feart C, Aubert A, Higueret D, Barberger-Gateau P, Laye S, Fuchs D. Chronic low-grade inflammation in elderly persons is associated with altered tryptophan and tyrosine metabolism: role in neuropsychiatric symptoms. Biol Psychiatry. 2011;70:175–182. doi: 10.1016/j.biopsych.2010.12.006. [DOI] [PubMed] [Google Scholar]
- Dantzer R, O’Connor JC, Lawson MA, Kelley KW. Inflammation-associated depression: from serotonin to kynurenine. Psychoneuroendocrinology. 2011;36:426–436. doi: 10.1016/j.psyneuen.2010.09.012. [DOI] [PMC free article] [PubMed] [Google Scholar]
- Eisenberger NI, Berkman ET, Inagaki TK, Rameson LT, Mashal NM, Irwin MR. Inflammation-induced anhedonia: endotoxin reduces ventral striatum responses to reward. Biol Psychiatry. 2010;68:748–754. doi: 10.1016/j.biopsych.2010.06.010. [DOI] [PMC free article] [PubMed] [Google Scholar]
- Felger JC, Hernandez CR, Miller AH. Levodopa reverses cytokine-induced reductions in striatal dopamine release. Int J Neuropsychopharmacol. 2015;18 doi: 10.1093/ijnp/pyu084. [DOI] [PMC free article] [PubMed] [Google Scholar]
- Felger JC, Miller AH. Cytokine effects on the basal ganglia and dopamine function: the subcortical source of inflammatory malaise. Front Neuroendocrinol. 2012;33:315–327. doi: 10.1016/j.yfrne.2012.09.003. [DOI] [PMC free article] [PubMed] [Google Scholar]
- Haroon E, Woolwine BJ, Chen X, Pace TW, Parekh S, Spivey JR, Hu XP, Miller AH. IFN-alpha-induced cortical and subcortical glutamate changes assessed by magnetic resonance spectroscopy. Neuropsychopharmacology. 2014;39:1777–1785. doi: 10.1038/npp.2014.25. [DOI] [PMC free article] [PubMed] [Google Scholar]
- Kempton MJ, Salvador Z, Munafo MR, Geddes JR, Simmons A, Frangou S, Williams SC. Structural neuroimaging studies in major depressive disorder. Meta-analysis and comparison with bipolar disorder. Archives of General Psychiatry. 2011;68:675–690. doi: 10.1001/archgenpsychiatry.2011.60. [DOI] [PubMed] [Google Scholar]
- Pizzagalli DA, Holmes AJ, Dillon DG, Goetz EL, Birk JL, Bogdan R, Dougherty DD, Iosifescu DV, Rauch SL, Fava M. Reduced caudate and nucleus accumbens response to rewards in unmedicated individuals with major depressive disorder. The American journal of psychiatry. 2009;166:702–710. doi: 10.1176/appi.ajp.2008.08081201. [DOI] [PMC free article] [PubMed] [Google Scholar]
- Savitz J, Drevets WC. Bipolar and major depressive disorder: neuroimaging the developmental-degenerative divide. Neuroscience and biobehavioral reviews. 2009;33:699–771. doi: 10.1016/j.neubiorev.2009.01.004. [DOI] [PMC free article] [PubMed] [Google Scholar]
- Savitz J, Drevets WC, Smith CM, Victor TA, Wurfel BE, Bellgowan PS, Bodurka J, Teague TK, Dantzer R. Putative neuroprotective and neurotoxic kynurenine pathway metabolites are associated with hippocampal and amygdalar volumes in subjects with major depressive disorder. Neuropsychopharmacology. 2015a;40:463–471. doi: 10.1038/npp.2014.194. [DOI] [PMC free article] [PubMed] [Google Scholar]
- Savitz J, Drevets WC, Wurfel BE, Ford BN, Bellgowan PS, Victor TA, Bodurka J, Teague TK, Dantzer R. Reduction of kynurenic acid to quinolinic acid ratio in both the depressed and remitted phases of major depressive disorder. Brain Behav Immun. 2015b;46:55–59. doi: 10.1016/j.bbi.2015.02.007. [DOI] [PMC free article] [PubMed] [Google Scholar]
- Stockmeier CA, Mahajan GJ, Konick LC, Overholser JC, Jurjus GJ, Meltzer HY, Uylings HB, Friedman L, Rajkowska G. Cellular changes in the postmortem hippocampus in major depression. Biol Psychiatry. 2004;56:640–650. doi: 10.1016/j.biopsych.2004.08.022. [DOI] [PMC free article] [PubMed] [Google Scholar]
- Vichaya EG, Hunt SC, Dantzer R. Lipopolysaccharide reduces incentive motivation while boosting preference for high reward in mice. Neuropsychopharmacology. 2014;39:2884–2890. doi: 10.1038/npp.2014.141. [DOI] [PMC free article] [PubMed] [Google Scholar]
- Yip SW, Worhunsky PD, Rogers RD, Goodwin GM. Hypoactivation of the ventral and dorsal striatum during reward and loss anticipation in antipsychotic and mood stabilizer-naive bipolar disorder. Neuropsychopharmacology. 2015;40:658–666. doi: 10.1038/npp.2014.215. [DOI] [PMC free article] [PubMed] [Google Scholar]
- Yirmiya R, Pollak Y, Morag M, Reichenberg A, Barak O, Avitsur R, Shavit Y, Ovadia H, Weidenfeld J, Morag A, Newman ME, Pollmacher T. Illness, cytokines, and depression. Annals of the New York Academy of Sciences. 2000;917:478–487. doi: 10.1111/j.1749-6632.2000.tb05412.x. [DOI] [PubMed] [Google Scholar]