Abstract
To investigate how the striatum integrates sensory information with reward information for behavioral guidance, we recorded single-unit activity in the dorsal striatum of head-fixed rats participating in a probabilistic Pavlovian conditioning task with auditory conditioned stimuli (CSs) in which reward probability was fixed for each CS but parametrically varied across CSs. We found that the activity of many neurons was linearly correlated with the reward probability indicated by the CSs. The recorded neurons could be classified according to their firing patterns into functional subtypes coding reward probability in different forms such as stimulus value, reward expectation, and reward prediction error. These results suggest that several functional subgroups of dorsal striatal neurons represent different kinds of information formed through extensive prior exposure to CS-reward contingencies.
Keywords: single-unit recording, head-fixed rats, Pavlovian conditioning
the striatum, an input stage of the basal ganglia, receives projections from almost all areas of the cerebral cortices (Bolam et al. 2000) as well as from dopamine neurons in the substantia nigra pars compacta (SNc; Anden et al. 1964). These diverse anatomic inputs make the striatum a structure ideal for integrating sensory and motor information from the cerebral cortex with reward information from the SNc. Previous studies have shown that striatal neurons are activated at various events within a trial in a behavioral task such as instruction cue, delay, and execution of the movement leading to reward delivery (Apicella et al. 1992; Hikosaka et al. 1989a,b; Kimura 1990; Rolls et al. 1983) and that such task-related activity is modulated by the likeliness of obtaining the reward (Cromwell and Schultz 2003; Hassani et al. 2001; Hollerman et al. 1998; Kawagoe et al. 1998; Nakamura et al. 2012). Furthermore, investigators using behavioral tasks in which the probability of obtaining reward by one or another action dynamically changed found striatal neurons to track the value of a specific action (Samejima et al. 2005) or that of the one actually chosen (Lau and Glimcher 2008).
A useful way to investigate how the striatum integrates information from the SNc and the cerebral cortex is to record single-unit activity in these structures while animals are performing the same task. The activity of dopamine neurons in the SNc has been widely investigated using a probabilistic Pavlovian conditioning task in which the association between the conditioning stimulus (CS) and subsequent reward (US) is varied parametrically across the full probability range (P = 0–1). Using such a task, Schultz and colleagues have found that dopamine neurons code reward prediction error in their phasic response to the stimulus and the reward and that they also code reward uncertainty in their tonic activity between the CS and the outcome (Fiorillo et al. 2003). We have recently recorded single-unit activity in the rat dorsal striatum and SNc during a probabilistic Pavlovian conditioning task and found that a group of neurons in the dorsal striatum codes reward prediction error information in the same manner as dopamine neurons in the SNc (Oyama et al. 2010). Whereas in that study we focused on the neurons coding reward prediction error, in this study we analyzed the same data set looking for any task-related variation of activity. Furthermore, we analyzed data from an additional experiment extending the delay duration.
MATERIALS AND METHODS
Subjects.
Twenty-one male albino Wistar rats weighing 220–300 g were used as subjects. They were individually housed under a 12:12-h light-dark cycle with light onset at 8:00 PM. Throughout the experiments, they were treated in accordance with the National Institutes of Health (NIH) Guide for the Care and Use of Laboratory Animals, the Tohoku University Guidelines for Animal Care and Use, and the American Physiological Society (APS) Guiding Principles for the Care and Use of Vertebrate Animals in Research and Training. The experimental plan of the present study was approved and licensed (2015LSA-011) by the Institutional Animal Care and Use Committee of Tohoku University.
Apparatus.
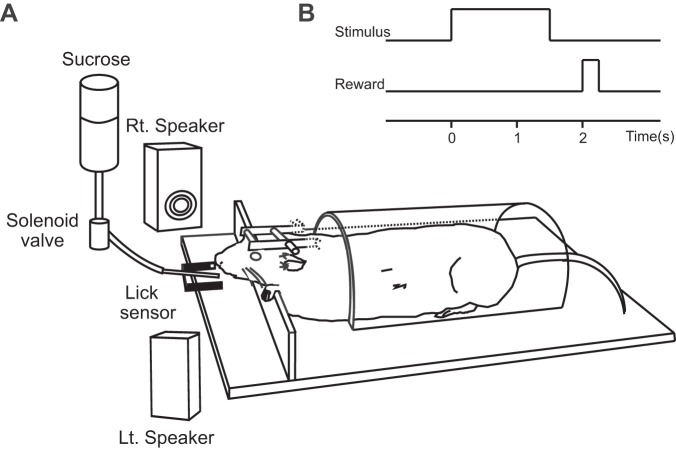
Experiments were conducted in a dimly lit, sound-attenuated room. Brief auditory CSs were generated by a personal computer and presented diagonally from two loudspeakers (ASP-701; ELECOM) 30 cm from the head of the rat. An infrared sensor system was used to detect conditioned and unconditioned spout-licking movement.
Behavioral procedure and task.
Before behavioral training, a head-fixation device consisting of two metal tubes and a stainless steel screw as a grounded reference electrode were fixed to the skull with dental cement under anesthesia induced by a combination of ketamine (80.0 mg/kg) and xylazine (0.8 mg/kg). After recovery from the surgery, each rat was habituated to an acrylic half-cylinder restraining device (diameter: 8.5 cm, length: 15 cm) that was combined with a stereotaxic head-fixation frame (SR-5R; Narishige). During the task training and single-unit recording sessions, the rat was placed in the restraining device with its head fixed firmly and painlessly in a stereotaxic device (Fig. 1A).
Fig. 1.
Outline of the behavioral paradigm. A: the apparatus. The rats were involved in a probabilistic Pavlovian conditioning task with the head stabilized with a head-fixation device and with body movement restricted by an acrylic half-cylinder. The auditory stimuli used in this study were generated by a personal computer and presented from 2 loudspeakers 30 cm from the head of the rat. A sucrose solution was given through a spout in front of the rat's mouth, and an infrared sensor system was used to detect spout-licking movements. Rt., right; Lt., left. B: time sequence of task events in a trial.
The rats were trained with a probabilistic classic conditioning procedure. Five different auditory stimuli with the same intensity but with different frequencies ranging from 1.2 to 14 kHz (1.2, 2, 5, 9, and 14 kHz) were used as CSs, each indicating a different reward probability (P = 0, 0.25, 0.5, 0.75, or 1.0). Combinations of tone frequencies and reward probabilities were varied between rats. To dissociate reward-probability-dependent neuronal activity from the auditory sensory response, the combinations of tone frequencies and reward probabilities were organized so that a reward-probability-dependent tuning of response amplitude would appear as multipeaked tuning when responses are plotted against log-aligned tone frequency. This allowed us to dissociate reward-probability-dependent activity from typical sensory responses that would be expressed as single-peaked tuning when activity is plotted against tone frequency (Bordi and LeDoux 1992; Doron et al. 2002; Sally and Kelly 1988; Sutter and Schreiner 1991).
In each trial, a 1.5-s CS was followed by a 0.5-s delay. Whether reward occurred immediately after the delay was determined probabilistically depending on the CS, and in a rewarded trial a solenoid valve opened for 250 ms and delivered 50 μl of a sucrose solution through a spout in front of the rat's mouth. The intertrial interval (ITI) was usually set to one of six durations, each consisting of a fixed 4 s plus an exponentially distributed interval with a mean of 5 s. The exception was when an unpredicted reward was given during the ITI. In that case, the time between the end of the previous trial and the unpredicted reward and the time between the unpredicted reward and the start of the next trial were both set to 1 of the above regular ITI durations. Trial sequence was predetermined by a personal computer so that each of the 5 CSs and the unpredicted reward appeared twice in a block of 10 trials. A daily session consisted of 600 trials.
An additional experiment was conducted to identify the task events to which the activity of the recorded neurons was time-locked. In this experiment, 6 rats were used as subjects. The length of the delay period was extended in a stepwise fashion, and three different auditory stimuli were used as CSs indicating reward probabilities of 0, 50, and 100%. Again, an unpredicted reward was occasionally given during the ITI. The CS indicating a reward probability of 50% appeared twice as often as the CSs indicating reward probabilities of 0 or 100%. As a consequence, the number of rewarded trials in the 50% condition was the same as that in the 100% condition. Each recording session for a delay duration consisted of 60–90 trials, and the initial 20–30 trials after delay extension were excluded from analysis (allowing rats to adapt to the new timing of the reward delivery). After a neuron was isolated, the neuronal activity was 1st recorded with a 0.5-s delay, and then the delay duration (i.e., the time without an explicit timing cue) was extended to 1.5 s. The delay was then extended from 1.5 to 3.5 s and, finally, set back to 0.5 s.
Single-unit recording.
The recording session began after the rat's anticipatory licking responses discriminated between probabilities during the CS and delay period. Chronic access to the brain was provided by using a second surgical procedure to open a hole in the skull and attach a recording chamber over it. The position of the hole (anteroposterior = +2.0 to −1.5 mm from bregma; lambda = 1.0–4.5 mm from the midline) was determined according to the standard stereotaxic atlas (Paxinos and Watson 2005). After recovery from surgery, the activity of single neurons was recorded extracellularly, using tungsten microelectrodes with a platinized tip (1–3 MΩ measured at 1 kHz, 0.125-mm-diameter shaft; FHC), while the rat performed the Pavlovian conditioning task. The electrode was attached to a hydraulic microdrive (MO-15; Narishige) so that it could be advanced into the brain. Electrophysiological signals were amplified (10,000 times) and band-pass filtered (low-cut: 100 Hz; high-cut: 10,000 Hz) with a standard biophysical amplifier (BioAmp A2-v6; Supertech) and were displayed on an oscilloscope (CS-4125A; Kenwood). The amplified signals were also rendered audible and presented to the experimenter through headphones. The action potentials of isolated neurons were sorted by a window discriminator (DDIS-1; Bak Electronics) and displayed on a digital storage oscilloscope (DCS-7040; Kenwood). The recorded electrophysiological signals were digitized at 25 kHz by using an analog-to-digital conversion interface (Power1401; CED) and then stored on a hard disk of a personal computer (X100; IBM). The times of the detected action potentials, licking movements, and task events were also stored on the hard disk. Rasters and histograms showing the neuronal activity recorded under each probability condition and the response to the unpredicted reward were displayed online on a liquid-crystal display (LCD) video screen. If visual inspection suggested that the neural activity was related to one or more task events (CS, delay, and/or reward) or to the unpredicted reward given during the ITI, we stored the recorded data on the computer for offline analysis. The data set included the activity recorded in at least 7 trials for each probability condition, and in this study the activity was subjected to further analysis.
Analysis of neuronal activity.
When analyzing the activity of each neuron, we focused on the activity during 4 time periods within the trial: stimulus-related activity from CS onset until 750 ms after the CS onset (1st half of the CS presentation), stimulus-related activity from 750 ms before the CS offset to CS offset (2nd half of the CS presentation), reward expectation activity from 1,000 ms before reward delivery until reward delivery, and reward activity (and prediction error response) from reward onset until 500 ms after reward delivery.
We classified neurons into 3 groups according to which of the 3 prereward time windows was the 1 in which the neuron showed the greatest change in activity (in this analysis, we excluded the time window after reward delivery, as we wanted to classify neurons based on the activity before receipt of the reward). We calculated the t-value by comparing the baseline activity (500 ms before CS onset) and the activity in each time window. The time window that yielded the largest absolute t-value was considered the 1 with the greatest change in activity. Neurons showing the greatest change during the 750 ms after the CS onset (1st half of the CS presentation), during the 750 ms before the CS offset (2nd half of the CS presentation), and during the 1,000 ms before reward delivery were classified as CS phasic, CS tonic, and US buildup neurons, respectively.
To analyze the information content coded by each neuron in each time window, we conducted a multiple linear regression analysis on a trial-by-trial basis with the reward probability and uncertainty as regressors (P < 0.05, uncorrected for multiple regressors). Uncertainty was quantified as relative variance, which is 1 at P = 0.5 and is 0 at P = 0 and at P = 1. When analyzing the activity within the 500 ms after the reward onset, we used only the rewarded trials. The response to an unpredicted reward given during the ITI served as an approximation of the reward response in the P = 0 condition in the multiple regression analysis. Neurons showing greater activity within 500 ms after the onset of an unpredicted reward than they did within 500 ms before the onset were judged to be responsive to reward.
We used Wilcoxon signed-rank test to determine whether the distributions of the standardized β-coefficients obtained in each neuron from the multiple linear regression analysis for probability and uncertainty deviated significantly (P < 0.05) from 0. To compare the effect size of each regressor, we compared the absolute values of the standardized β-coefficients for reward probability and uncertainty using paired t-test (P < 0.05) in each time window. We also conducted a permutation test to test whether the number of neurons showing a statistical significance was greater than chance level (P < 0.05). To construct population-averaged histograms, we used the following procedure. First, for each neuron, we subtracted the baseline firing rate from the firing rate in each bin. We then normalized the firing rate of each bin by the firing rate of the bin with the highest firing rate. Finally, the normalized activity of each neuron was averaged across neuronal population.
Histology.
Electrolytic lesions were made by passing electrical current through the tip of the electrode and into the brain tissue. After the rat was killed with an overdose of pentobarbital, it was transcardially perfused first with 0.9% saline and then with 10% formalin. Then, the brain was removed from the skull and stored in a 10% formalin solution. For histological inspection, the brain was sliced into 50-μm coronal sections and stained with thionine. Slices were examined under a light microscope to verify lesion site and electrode tracks. Electrode placements were finally verified using the rat brain atlas (Paxinos and Watson 2005). The plots of recording sites were superimposed at 0.5-mm intervals on corresponding coronal sections of the left hemisphere.
RESULTS
We trained 15 head-fixed rats in a probabilistic Pavlovian conditioning task (Fig. 1). After 2–3 mo of training, the rats exhibited probability-dependent spout-licking movement (i.e., longer cumulative duration of licking for higher reward probability) during the CS and/or delay period (Oyama et al. 2010). The training was considered complete with the emergence of discriminative anticipatory licking responses during the CS and delay period.
Temporal response profiles of dorsal striatal neurons during the probabilistic Pavlovian conditioning task.
After the completion of training, we recorded single-unit activity in the dorsal striatum during the performance of the probabilistic Pavlovian conditioning task. Of the 1,102 striatal neurons for which activity was isolated, 18% (n = 194) were judged from the experimenter's visual inspection to show changed activity (more or less firing than the baseline level) during a trial, and their activity was recorded on the computer.
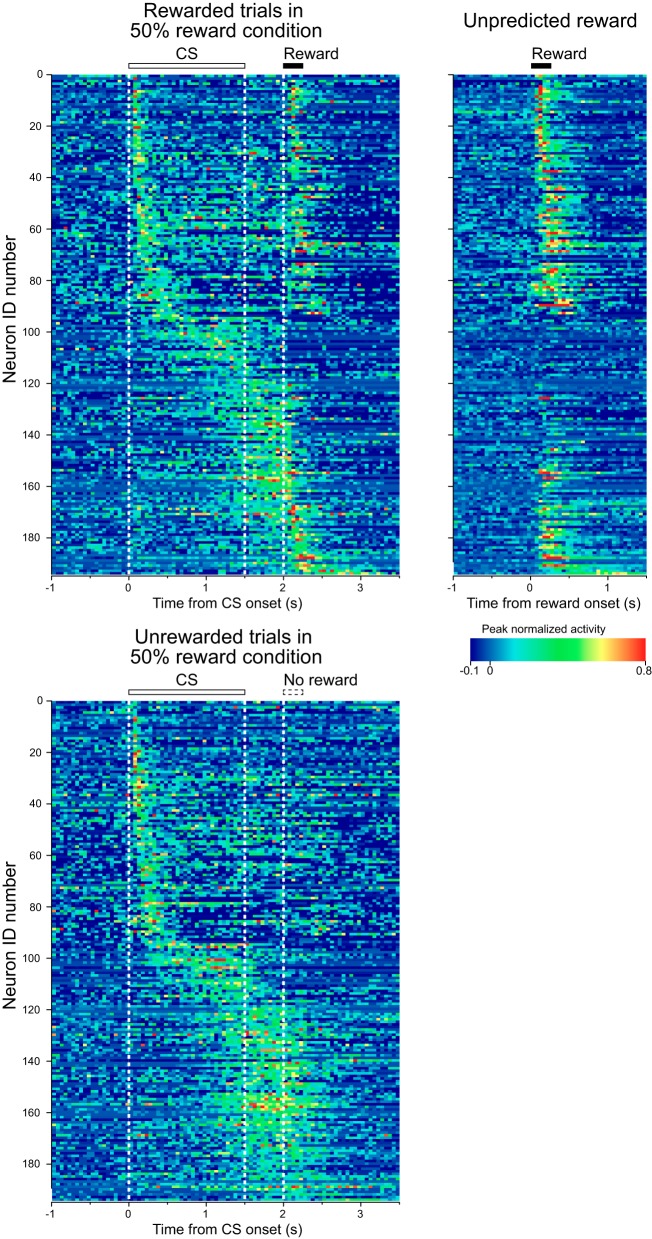
Figure 2 shows the activity of every recorded neuron in rewarded (top left) and unrewarded trials (bottom) in the 50% reward-probability condition normalized by the peak response. We rank-sorted neuronal activities by occurrence of their peak response in the trial as calculated in the pooled data from all reward-probability conditions including both rewarded and unrewarded trials. We also show the activity of each neuron around the delivery of the unpredicted reward (Fig. 2, right). By visual inspection, there appeared to be several subtypes of neurons that had different firing patterns. The 1st consisted of neurons showing a phasic response to the CS presentation and to the delivery of the reward [neuron identification (ID) #1 to around #100], the 2nd consisted of neurons showing a tonic response during CS presentation (neuron ID around #101 to around #120), and the 3rd consisted of neurons showing a buildup activity toward the time of reward delivery (neuron ID around #121 to #194).
Fig. 2.
Temporal response profiles of all 194 neurons for which activity was recorded during the probabilistic Pavlovian conditioning task. Top left shows the activity in rewarded trials, and bottom shows the activity in unrewarded trials of the 50% condition. Right shows the activity around the time of delivery of the unpredicted reward. Each row represents peak-normalized and baseline-subtracted activity for a single neuron, and the data are sorted from top to bottom by peak response time. For neurons that showed responses to both the conditioning stimulus (CS)/delay and the reward, the peak response time of their CS/delay response was used to align them. The horizontal bars above the histograms and white dashed lines indicate the durations and times of CS presentation and reward delivery. We used the moving-window method to calculate the peak response time of each neuron. A 50-ms window was moved in 10-ms steps from the onset of the CS to the end of the delay period, and the peak response time was determined as the center of the 50-ms window showing maximum bin height. ID, identification.
We classified neurons into 3 groups according to which of the 3 prereward time windows was the 1 in which the neuron showed the greatest change in activity (see materials and methods). Of the 194 recorded neurons, 39% (76: all excitatory) showed the greatest change during the 750 ms after the CS onset (1st half of the CS presentation), 12% (23: 17 excitatory and 6 inhibitory) showed the greatest change during the 750 ms before the CS offset (2nd half of the CS presentation), and 49% (95: 91 excitatory and 4 inhibitory) showed the greatest change during the 1,000 ms before reward delivery. Hereafter, we refer to the neurons showing the greatest activity change during the 1st half of the CS presentation, 2nd half of the CS presentation, and before reward as CS phasic, CS tonic, and US buildup neurons, respectively. We will focus on the firing patterns of these neurons.
Neurons with phasic CS response (CS phasic neurons).
Of the 194 recorded neurons, 39% (76/194) were classified as CS phasic neurons. They typically showed a phasic response after the CS onset. Most of them (76%, 58/76) also showed a significant response to the reward. We then assessed the specific correlation of activity to reward probability. We conducted a multiple linear regression analysis to test whether the activity in each time window (1st half of the CS presentation, 2nd half of the CS presentation, 1,000 ms before reward delivery, and 500 ms after reward delivery) was linearly related to reward probability or reward uncertainty, which can be quantified as relative variance (1 at P = 0.5 and 0 at P = 0 and 1). In this paper, we have used the term uncertainty according to the definition by Fiorillo et al. (2003), although recent studies have also referred to uncertainty as “risk” (e.g., Burke and Tobler 2011). We included uncertainty in the regression model because tonic activity of midbrain dopamine neurons is correlated with reward uncertainty (Fiorillo et al. 2003). Table 1 summarizes the results of the multiple linear regression analysis. The proportions of neurons that showed a positive correlation between the activity and reward probability were highest in the 3 time windows before the reward delivery, especially during the 1st half of the CS presentation. In that time window, the majority (53%, 40/76) showed a positive correlation between CS response and reward probability. On the other hand, half of the CS phasic neurons (50%, 38/76) showed a negative correlation between reward response and reward probability. In total, 34% (26/76) showed a positive correlation between the CS response and reward probability and showed a negative correlation between the reward response and reward probability.
Table 1.
Summary of the relationship between the activity of each type of neuron and reward probability or uncertainty
| Type | Window (ms) | Probability |
Uncertainty |
||
|---|---|---|---|---|---|
| Positive | Negative | Positive | Negative | ||
| CS phasic, n = 76 | CS 1st half (0–750) | 40 (53*) | 2 (3) | 0 (0) | 2 (3) |
| CS 2nd half (750–1,500) | 16 (21*) | 8 (11*) | 5 (7*) | 2 (3) | |
| Before reward (1,000–2,000) | 17 (22*) | 5 (7*) | 6 (8*) | 2 (3) | |
| After reward (2,000–2,500) | 1 (1) | 38 (50*) | 2 (3) | 6 (8*) | |
| CS tonic, n = 23 | CS 1st half (0–750) | 12 (52*) | 0 (0) | 1 (4) | 3 (13*) |
| CS 2nd half (750–1,500) | 13 (57*) | 1 (4) | 2 (9*) | 1 (4) | |
| Before reward (1,000–2,000) | 12 (52*) | 1 (4) | 2 (9*) | 2 (9*) | |
| After reward (2,000–2,500) | 0 (0) | 2 (9*) | 0 (0) | 0 (0) | |
| US buildup, n = 95 | CS 1st half (0–750) | 26 (27*) | 3 (3) | 5 (5) | 5 (5) |
| CS 2nd half (750–1,500) | 46 (48*) | 1 (1) | 5 (5) | 3 (3) | |
| Before reward (1,000–2,000) | 65 (68*) | 1 (1) | 10 (11*) | 3 (3) | |
| After reward (2,000–2,500) | 28 (29*) | 10 (11*) | 7 (7*) | 7 (7*) | |
Numbers in parentheses below the title of the time window show the time from the conditioning stimulus (CS) onset. Numbers in parentheses in each cell show percentages of the neurons. Asterisks indicate that the proportion is greater than chance level (permutation test, P < 0.05).
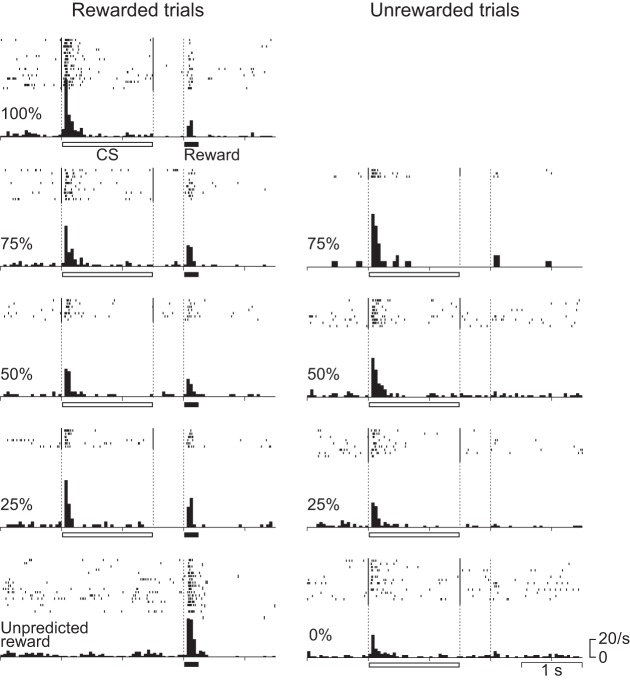
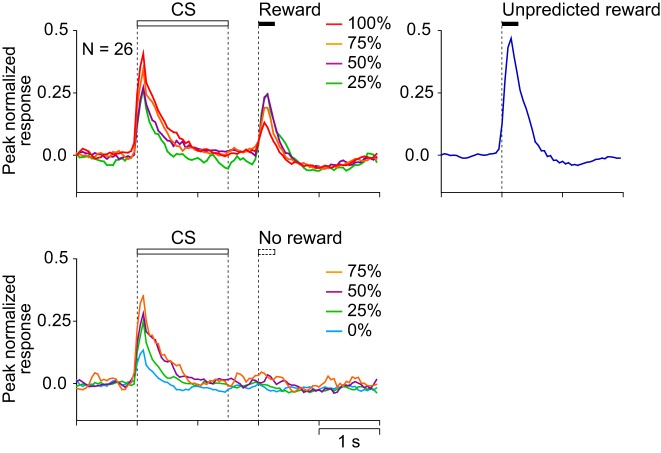
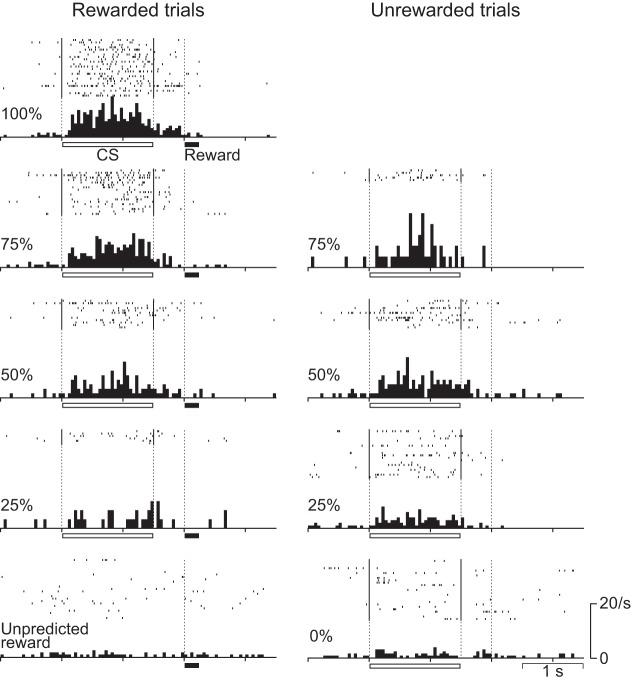
Figures 3 and 4 show the activity of a representative CS phasic neuron and the average histograms of the activity of 26 CS phasic neurons that showed CS and reward responses positively and negatively related to the reward probability. They showed a phasic response both to the CS and to the reward. The response during the 1st half of the CS was positively related to reward probability (r = 0.55, P < 0.0001), whereas the reward response was negatively related to reward probability (r = −0.44, P < 0.0001) and was highest for the unpredicted reward. These neurons were considered to code a reward prediction error: the discrepancy between the prediction and occurrence of a reward. These neurons were almost the same population as the one we have previously reported as reward prediction error-coding neurons (Oyama et al. 2010).
Fig. 3.
Activity of a representative CS phasic neuron. Rasters and histograms (bin width = 50 ms) show the activity recorded in different reward-probability conditions. Rasters and histograms are aligned to the CS onset. The horizontal bars below the histograms indicate the durations of CS presentation and reward delivery.
Fig. 4.
Population activity of CS phasic neurons that showed CS and reward responses positively and negatively related to the reward probability (n = 26). Peak-normalized and baseline activity-subtracted population histograms (bin width = 50 ms) are shown for rewarded trials (top left), for unrewarded trials (bottom left), and for unpredicted reward (right). Lines of different colors represent the neuronal activity recorded in different reward-probability conditions (red = 100%, orange = 75%, purple = 50%, green = 25%, and light blue = 0%) and during delivery of unpredicted rewards (blue). Each bin was smoothed by a moving average of 3 bins.
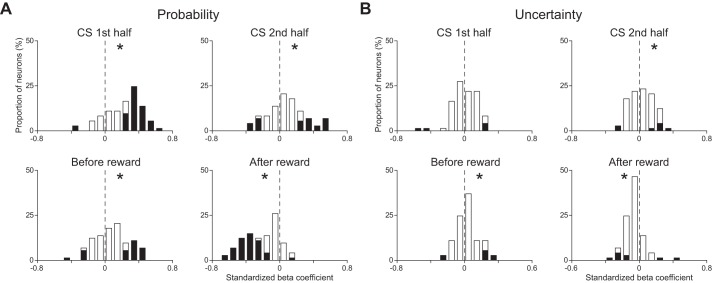
Figure 5 shows the distributions of the standardized β-coefficients for reward probability and uncertainty of all CS phasic neurons in each time window. In the three time windows before the reward delivery, the distribution for reward probability showed a positive deviation from 0 (P < 0.05, Wilcoxon signed-rank test; Fig. 5A). On the other hand, the distribution of the reward responses for reward probability showed a negative deviation (P < 0.05, Wilcoxon signed-rank test; Fig. 5A). The distribution for uncertainty did not show any deviation during the first half of the CS presentation (P > 0.05, Wilcoxon signed-rank test), that during the second half of the CS presentation and that before reward showed positive deviations from 0 (P < 0.05, Wilcoxon signed-rank test), and that after the reward delivery showed a negative deviation (P < 0.05, Wilcoxon signed-rank test; Fig. 5B).
Fig. 5.
Distributions of the standardized β-coefficients of CS phasic neurons obtained from the multiple linear regression analysis. A: distribution of the standardized β-coefficients for reward probability. B: distribution of the standardized β-coefficients for uncertainty. Time windows used for the analyses are 1st half of the CS presentation (top left), 2nd half of the CS presentation (top right), 1,000 ms before reward delivery (bottom left), and 500 ms after reward delivery (bottom right), respectively. Asterisks at upper right or upper left in the graph indicate that the distribution showed a positive or negative deviation from 0 (P < 0.05, Wilcoxon signed-rank test), respectively.
To compare the effect size of each regressor, we compared the absolute values of the standardized β-coefficients for reward probability and uncertainty. In every time window, the absolute value of the standardized β-coefficient for reward probability was greater than that of the standardized β-coefficient for uncertainty (P < 0.05, paired t-test). We also confirmed this tendency in the proportion of neurons that showed a statistically significant activity change during the 1st half of the CS presentation and after the reward (χ2-test, P < 0.05 with Bonferroni correction).
Neurons with tonic CS response (CS tonic neurons).
Of the 194 recorded neurons, 12% (23/194) were classified as CS tonic neurons. They typically showed a tonic response during the CS presentation, and 30% of those neurons (7/23) showed a significant response to the reward. The proportions of neurons that showed a positive correlation between activity and reward probability were highest in the 3 time windows before the reward delivery, especially during the 2nd half of the CS presentation (Table 1). In that time window, the majority (57%, 13/23) showed a positive correlation between CS response and reward probability.
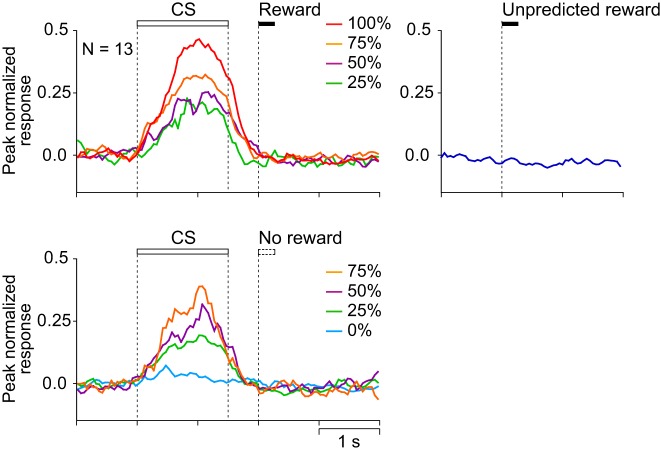
Figures 6 and 7 show the activity of a representative CS tonic neuron and the average histograms of the activity of 13 CS tonic neurons that showed a CS response positively related to the reward probability. The neurons were tonically active during the presentation of the CS and showed no response to reward delivery. The CS response was positively related to reward probability (r = 0.78, P < 0.0001).
Fig. 6.
Activity of a representative CS tonic neuron. Conventions are the same as in Fig. 3.
Fig. 7.
Population activity of CS tonic neurons that showed CS response positively related to reward probability (n = 13). Conventions are the same as in Fig. 4.
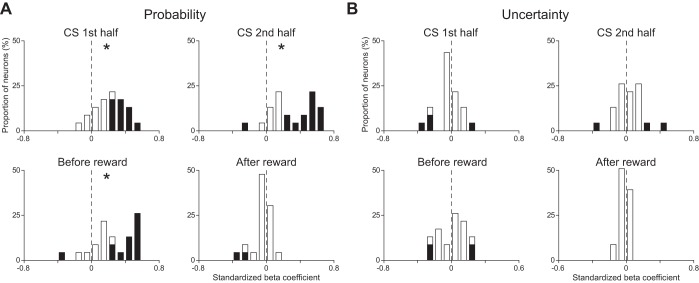
Figure 8 shows the distribution of the standardized β-coefficients for reward probability and uncertainty of all CS tonic neurons in each time window. In the three time windows before the reward delivery, the distribution for reward probability showed a positive deviation from 0 (P < 0.05, Wilcoxon signed-rank test; Fig. 8A). The distribution of reward responses for reward probability did not show any deviation (P > 0.05, Wilcoxon signed-rank test; Fig. 8A). In every time window, the distribution for uncertainty did not show any deviation (P > 0.05, Wilcoxon signed-rank test; Fig. 8B). In the three time windows before the reward delivery, the absolute value of the standardized β-coefficient for reward probability was greater than that of the standardized β-coefficient for uncertainty (P < 0.05, paired t-test). We also confirmed this tendency in the proportion of neurons that showed a statistically significant activity change during the 2nd half of the CS presentation (χ2-test, P < 0.05 with Bonferroni correction).
Fig. 8.
Distributions of the standardized β-coefficients of CS tonic neurons. Conventions are the same as in Fig. 5.
Neurons with pre-US buildup activity (US buildup neurons).
Of the 194 recorded neurons, 49% (95/194) were classified as US buildup neurons. They typically showed gradually increasing activity toward the time of reward delivery. Of them, 47% (45/95) also showed a significant response to the reward, whereas 53% (50/95) did not. The proportions of neurons that showed a positive correlation between the activity and reward probability were highest in every time window, especially during the 1,000 ms before the reward delivery (Table 1). In that time window, the majority (68%, 65/95) showed a positive correlation between CS response and reward probability.
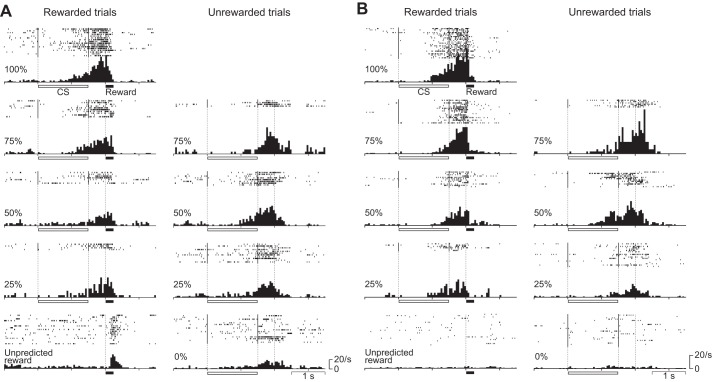
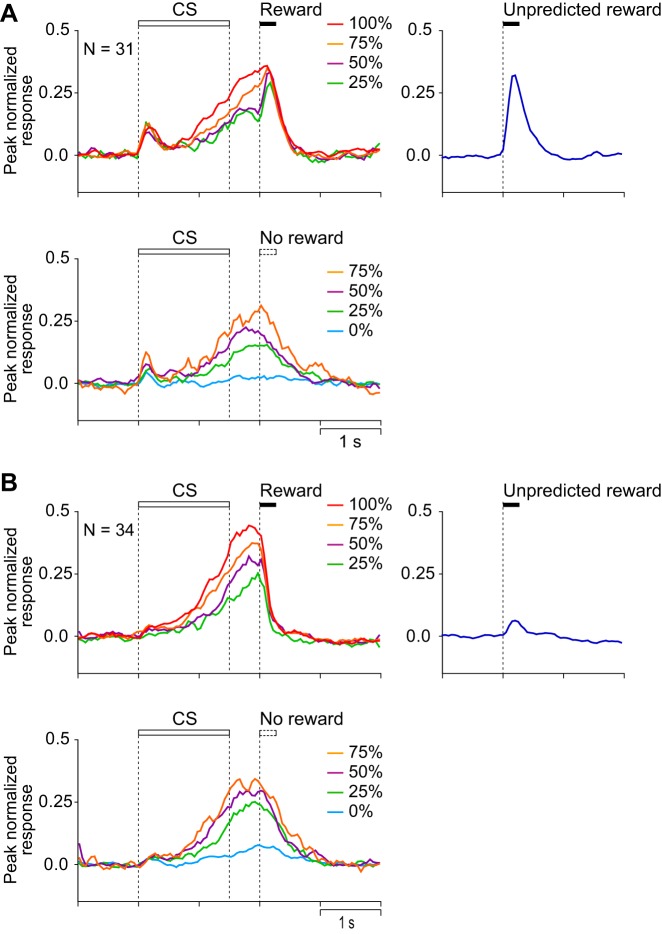
Figures 9A and 10A show the activity of a representative US buildup neuron and the average histograms of the activity of 31 US buildup neurons that showed prereward activity positively related to reward probability with a reward response. The activity of these neurons gradually increased toward the time of reward delivery and also was high after the reward. The activity during the 1,000 ms before the reward delivery was positively related to reward probability (r = 0.68, P < 0.0001), whereas the activity after the time of reward delivery was not (P > 0.1).
Fig. 9.
Activity of 2 representative US buildup neurons, 1 with a reward response (A) and the other without a reward response (B). Conventions are the same as in Fig. 3.
Fig. 10.
Population activity of US buildup neurons. A: peak-normalized and baseline activity-subtracted population histograms of the US buildup neurons that showed prereward activity positively related to reward probability with a reward response (n = 31). B: peak-normalized and baseline activity-subtracted population histograms of the US buildup neurons that showed prereward activity positively related to reward probability without a reward response (n = 34). Conventions are the same as in Fig. 4.
Figures 9B and 10B show the activity of a representative US buildup neuron and the average histograms of the activity of the 34 US buildup neurons that showed prereward activity positively related to reward probability without a reward response. As in the reward-responsive class of US buildup neurons, activity gradually increased toward the time of the reward delivery. The activity of these neurons, however, steeply decreased after reward delivery. The activity during the 1,000 ms before the reward delivery was positively and linearly related to reward probability (r = 0.70, P < 0.0001). The activity after the time of the reward delivery showed a positive correlation with reward probability (r = 0.35, P < 0.0001), but this may simply reflect the preceding probability-dependent buildup activity. The activity after the usual time of reward was higher in unrewarded trials than in rewarded trials (comparison in intermediate reward-probability conditions; 75, 50, and 25%; P < 0.0001, 2-way ANOVA).
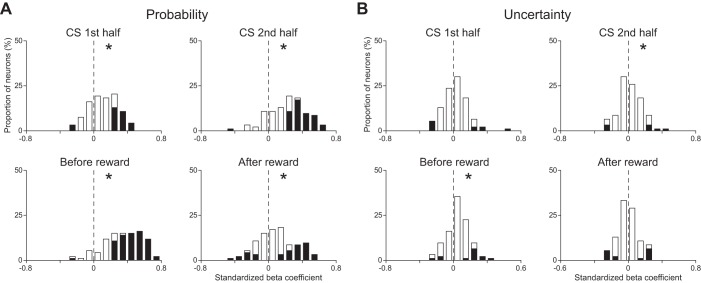
Figure 11 shows the distribution of the standardized β-coefficients for reward probability and uncertainty of all US buildup neurons in each time window. In every time window, the distribution for reward probability showed a positive deviation from 0 (P < 0.05, Wilcoxon signed-rank test; Fig. 11A). The distribution for uncertainty did not show any deviation during the first half of the CS presentation (P > 0.05, Wilcoxon signed-rank test), that during the second half of the CS presentation and that before reward showed a positive deviation from 0 (P < 0.05, Wilcoxon signed-rank test), and that after the reward delivery did not show any deviation from 0 (P < 0.05, Wilcoxon signed-rank test; Fig. 11B). In every time window, the absolute value of the standardized β-coefficient for reward probability was greater than that of the standardized β-coefficient for uncertainty (P < 0.05, paired t-test). We also confirmed this tendency in the proportion of neurons that showed a statistically significant activity difference during the 1,000 ms before the reward delivery (χ2-test, P < 0.05 with Bonferroni correction).
Fig. 11.
Distributions of the standardized β-coefficients of US buildup neurons. Conventions are the same as in Fig. 5.
Impact of delay extensions.
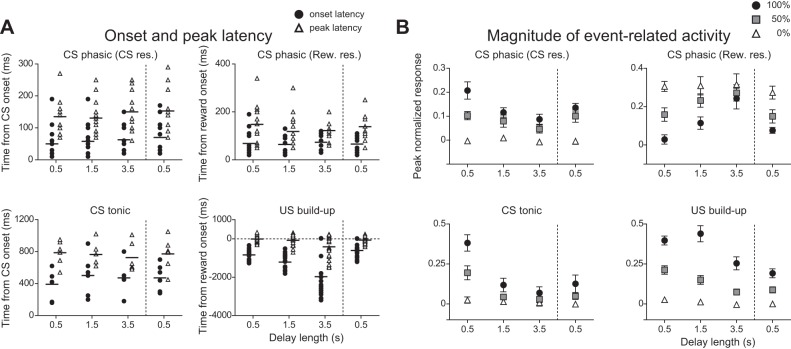
In classifying the neurons as above, we assumed that the activity between the CS onset and the reward onset of CS phasic and CS tonic neurons was time-locked to the CS onset and that of US buildup neurons was time-locked to the reward onset. To test this assumption, we conducted an additional experiment in which we recorded the activity of neurons while we changed the length of the delay from 0.5 to 1.5 s, then to 3.5 s, and finally back to 0.5 s. The activity of representative CS phasic, CS tonic, and US buildup neurons in this delay manipulation is shown in Fig. 12, A–C. We calculated the onset and peak latency of event-related activity in each neuron (Fig. 13A). In CS phasic neurons, the onset and the peak latency of activity related to the CS onset remained unchanged (P > 0.05, Kruskal-Wallis test). The responses related to the reward onset occurred similarly, irrespective of delay duration. In CS tonic neurons, the onset and the peak latency of responses related to the CS remained unchanged (P > 0.05, Kruskal-Wallis test). Thus we confirmed that the prereward activity of CS phasic and CS tonic neurons was time-locked to the CS onset, whereas the postreward activity of CS phasic neurons was time-locked to the reward onset. In strong contrast to the prereward responses of CS phasic and CS tonic neurons, the onset times of prereward responses in US buildup neurons shifted away from the CS onset when the delay to reward increased (P < 0.0001, Kruskal-Wallis test). The peak response times with respect to the reward onset remained unchanged (P > 0.05, Kruskal-Wallis test). Thus in terms of peak response time, the activity of US buildup neurons was time-locked to the reward onset.
Fig. 12.
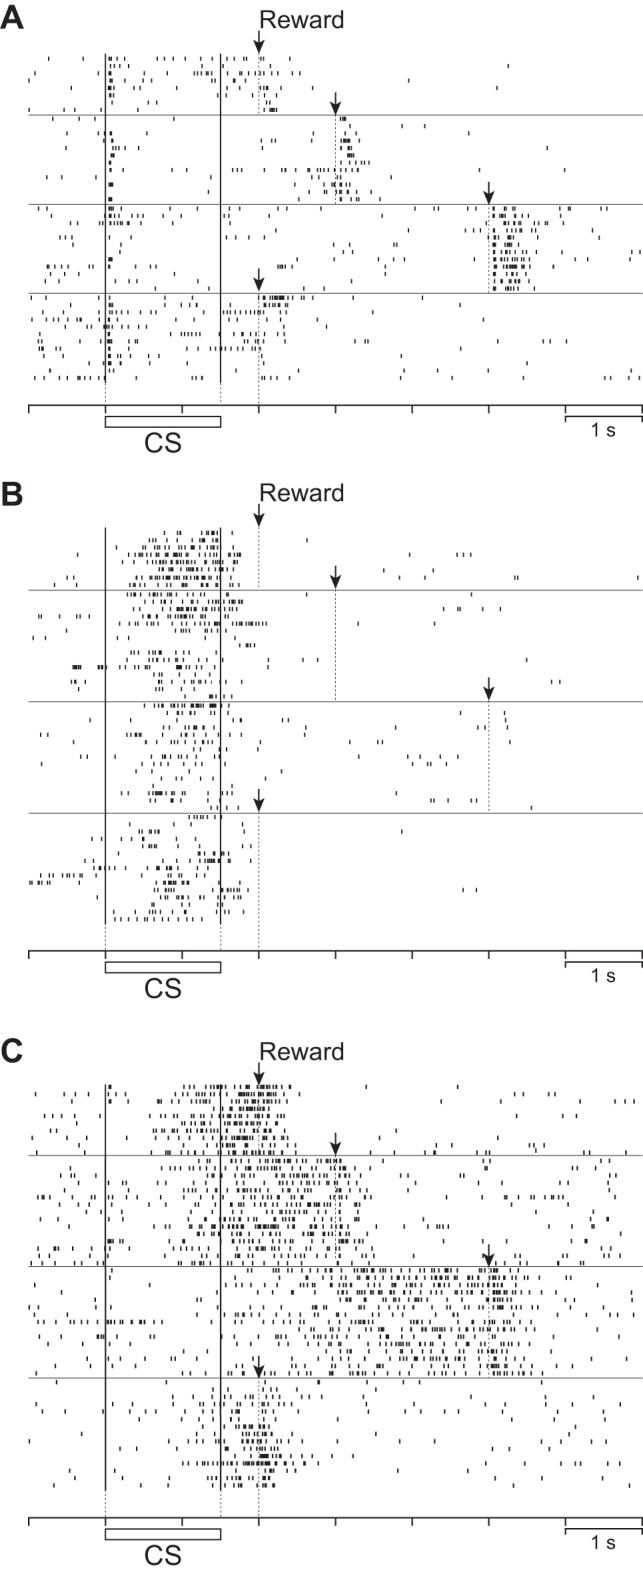
Effects of delay extension on the activity of representative neurons. A: activity of a representative CS phasic neuron with a delay of 0.5 s (top row), 1.5 s (2nd row), and 3.5 s (3rd row). The bottom row represents the activity in a 2nd 0.5-s delay condition after the 3.5-s delay condition. The horizontal bar below the raster indicates the duration of the CS presentation, and the arrows above each condition indicate the reward delivery times. B: activity of a representative CS tonic neuron. C: activity of a representative US buildup neuron. For all types of neurons, only responding in the 100% condition is shown for simplicity.
Fig. 13.
Effects of delay extension on the onset and peak latency (A) and the magnitude of event-related activity (B) in each type of neuron. A: onset and peak latencies of CS phasic neurons related to the CS onset (top left) and to the reward onset (top right), CS tonic neurons related to the CS onset (bottom left), and US buildup neurons related to the reward onset (Rew. res.; bottom right). Filled circles and open triangles represent the onset and peak latency of each neuron, respectively. B: magnitude of the CS (top left) and reward response (top right) of CS phasic neurons, CS response of CS tonic neurons (bottom left), and prereward activity of US buildup neurons (bottom right). Filled circles, filled squares, and open triangles represent the activity in the 100, 50, and 0% conditions, respectively. The time window for determining the peak normalized response was 750 ms from CS onset for the CS response of CS phasic neurons, 500 ms from reward onset for the reward response of CS phasic neurons, 750 ms before CS offset for CS tonic neurons, and 1,000 ms before reward onset for US buildup neurons.
We also examined whether the magnitude of the event-related activity changed with the delay extension (Fig. 13B). On average, CS phasic neurons showed weaker CS responses and stronger reward responses with delay extension, CS tonic neurons showed weaker CS responses, and US buildup neurons showed reduced activity during the last 1 s before reward time (P < 0.05, 1-way ANOVA). However, it appeared that the activity level changed not only abruptly with the shift of the delay duration, but also gradually as the daily session progressed. It is possible that the gradual decrease of the neuronal firing reflects the decrease of the animal's motivation. We used as an indicator of motivational level the number of licking movements after reward delivery. To dissociate abrupt change with the shift of the delay duration and gradual change with the motivational level, we applied multiple linear regression analysis on an individual-neuron basis with the delay length as 1 factor and with the number of licking movements after reward delivery as another factor (P < 0.05, uncorrected). In this analysis, the number of licking movements was averaged for rewarded trials in 10 trials, and the averaged data were applied to all of 10 trials. The results are summarized in Table 2. Of all the CS phasic neurons we found (n = 14), 6 neurons showed reduced CS responses only with delay extension, 1 showed reduced response only with the decrease of licking movement, and 1 showed both effects. Moreover, 6 neurons showed stronger reward responses with delay extension, and 1 showed stronger responses with the decrease of licking movement. Of all the CS tonic neurons we found (n = 6), 1 showed reduced CS responses only with delay extension, 1 showed reduced response only with the decrease of licking movement, and 3 showed both effects. Of all the US buildup neurons we found (n = 19), 4 showed reduced CS responses only with delay extension, 6 showed reduced response only with the decrease of licking movement, and 4 showed both effects. Thus in about half of the neurons, the analysis of individual neuron data confirmed the main findings from the analysis of average data. We found that a considerable number of striatal neurons were affected by the delay factor, whereas some of them and some others were affected by the motivational factor.
Table 2.
Summary of the relationship between the activity of each type of neuron and delay length or licking movement after reward delivery
| Type | Delay Length Only | Licking Only | Both |
|---|---|---|---|
| CS phasic (CS), n = 14 | 6 | 1 | 1 |
| CS phasic (reward), n = 14 | 6 | 1 | 0 |
| CS tonic, n = 6 | 1 | 1 | 3 |
| US buildup, n = 19 | 4 | 6 | 4 |
Note that reward responses of CS phasic neurons increased with delay extension or decrease of licking movement, whereas prereward activity of all types of neurons decreased with delay extension or decrease of licking movement.
Relationship between licking movement and neuronal activity.
As it is known that the striatum is involved in motor functions and that many neurons fire in relation to movement (Hikosaka et al. 1989a; Rolls et al. 1983), it is possible that the observed neuronal activity is related to movement rather than reward probability. As we have previously shown (Oyama et al. 2010), anticipatory licking movement was often positively correlated with reward probability. In such cases, it is impossible to include these two factors as regressors in a multiple linear regression model because of the multicollinearity between them. Therefore, to evaluate whether the reward probability or the licking movement was more suitable to explain the change of neuronal activity, we first divided recorded neurons into two groups: those recorded when probability-dependent anticipatory licking movement was not observed and those recorded when it was observed. For the former group, we applied a model in which reward probability, uncertainty, and the number of licking movements were included as regressors. For the latter group, we applied two models of multiple linear regression analysis independently: one that included reward probability and uncertainty as regressors, and one in which reward probability was replaced by the number of licking movements. For neurons that showed correlations with both reward probability and licking movement, we compared the r2 value for each model to find out which factor affected on the neuronal activity more. The results are summarized in Tables 3 and 4.
Table 3.
Summary of the relationship between the activity of each type of neuron and reward probability or licking movement recorded without probability-dependent licking movement
| Type | Probability Only | Licking Only | Both |
|---|---|---|---|
| CS phasic, n = 60 | 27 | 3 | 5 |
| CS tonic, n = 17 | 10 | 0 | 1 |
| US buildup, n = 69 | 29 | 6 | 19 |
Table 4.
Summary of the relationship between the activity of each type of neuron and reward probability or licking movement recorded with probability-dependent licking movement
| Type | Probability Only | Licking Only | Both |
|---|---|---|---|
| CS phasic, n = 16 | 8 | 0 | 2 (2) |
| CS tonic, n = 6 | 3 | 2 | 0 (0) |
| US buildup, n = 26 | 14 | 1 | 4 (4) |
Numbers in parentheses show the number of neurons that had a higher r2 value for the model including licking movement as a regressor.
Of all CS phasic neurons, the activity of 60 was recorded when probability-dependent anticipatory licking movement was not observed. Of these neurons, 27 showed a correlation only with reward probability, 3 showed a correlation only with licking movement, and 5 showed correlations with both factors during the 1st half of the CS presentation. Of 16 neurons for which activity was recorded when probability-dependent anticipatory licking movement was observed, 8 showed a correlation only with reward probability, none showed a correlation only with licking movement, and 2 showed correlations with both factors. Both of those neurons had a higher r2 value for the model including licking movement as a regressor.
Of all CS tonic neurons, the activity of 17 was recorded when probability-dependent anticipatory licking movement was not observed. Of those neurons, 10 showed a correlation only with reward probability, none showed a correlation only with licking movement, and 1 showed correlations with both factors during the 2nd half of the CS presentation. Of 6 neurons for which activity was recorded when probability-dependent anticipatory licking movement was observed, 3 showed a correlation only with reward probability, 2 showed a correlation only with licking movement, and none showed correlations with both factors.
Of all US buildup neurons, the activity of 69 was recorded when probability-dependent anticipatory licking movement was not observed. Of those neurons, 29 showed a correlation only with reward probability, 6 showed a correlation only with licking movement, and 19 neurons showed correlations with both factors during the 1,000 ms before the reward delivery. Of 26 neurons for which activity was recorded when probability-dependent anticipatory licking movement was observed, 14 showed a correlation only with reward probability, 1 showed a correlation only with licking movement, and 4 showed correlations with both factors. All 4 of the neurons that showed correlations with both factors had a higher r2 value for the model including licking movement as a regressor.
Thus a few neurons that were originally considered to be nondifferential were found to show licking-related activity by reanalyzing the data with a model including the number of licking movements as a factor. In Table 3, the numbers of those neurons are listed under the heading Licking Only. On the other hand, several neurons that were originally considered to be probability-dependent were found to also show licking-related activity. The numbers of those neurons are listed in Table 3 under the heading Both. Of the neurons that were recorded while probability-dependent licking movement was observed, only a small number were found more likely to be licking-movement-dependent rather than reward probability. The numbers of those neurons are listed in parentheses of Table 4 under the heading Both. These results suggest that the activity of striatal neurons recorded under the Pavlovian conditioning paradigm was related more to reward probability than licking movement, although some neurons, especially some US buildup neurons, showed licking-related activity. However, as anticipatory spout-licking behavior may emerge with the increase of animals' intrinsic expectation level, it is unclear whether the observed licking-related activity was directly related to motor function or was related only indirectly through such motivational factors.
Relationship between tone frequency and neuronal activity.
As it is known that the striatum receives sensory inputs from various cortices, we tested whether the observed activity of striatal neurons can be explained by the typical sensory responses that would appear as single-peaked tuning when activity in auditory-related areas is plotted against tone frequency (Bordi and LeDoux 1992; Doron et al. 2002; Sally and Kelly 1988; Sutter and Schreiner 1991). In designing the task, we determined the combination of the tone frequency and the reward probability so that the reward-probability-dependent response would not appear as single-peaked tone tuning. We tested for single-peaked tuning by Gaussian curve-fitting to the response magnitude of each type of neuron against the logarithmically scaled tone frequency (in this curve-fitting, the time windows for the responses were for CS phasic neurons the 1st half of the CS presentation, for CS tonic neurons the 2nd half of the CS presentation, and for US buildup neurons 1,000 ms before the reward delivery). Since we found good fitting only for 1 US buildup neuron, we think there is little possibility that the activity of recorded striatal neurons was an artifact of the simple auditory tone tuning.
Comparison of firing property and waveforms between neuron types.
We compared the baseline firing rates of the above 3 types of neurons. The baseline firing rates of CS phasic, CS tonic, and US buildup neurons were 3.1 ± 2.5, 3.0 ± 1.9, and 3.3 ± 3.1 (means ± SD) spikes per second, respectively, and did not differ between neuron types (P > 0.05, 1-way ANOVA). We also compared the duration of the waveforms of action potentials (width of negative component at half-maximum). The durations for CS phasic, CS tonic, and US buildup neurons were 205 ± 31, 223 ± 45, and 212 ± 30 (means ± SD) μs, respectively, and did not differ significantly between neuron types (P > 0.05, 1-way ANOVA).
Recording sites.
The recording sites of each neuron were reconstructed histologically and superimposed onto coronal sections of the left hemisphere of the standard rat brain atlas (Paxinos and Watson 2005). Figure 14 shows the recording sites of each neuron type. We found that all three neuron types were widely distributed within the dorsal striatum without any specific topographical clustering for any of the three types.
Fig. 14.
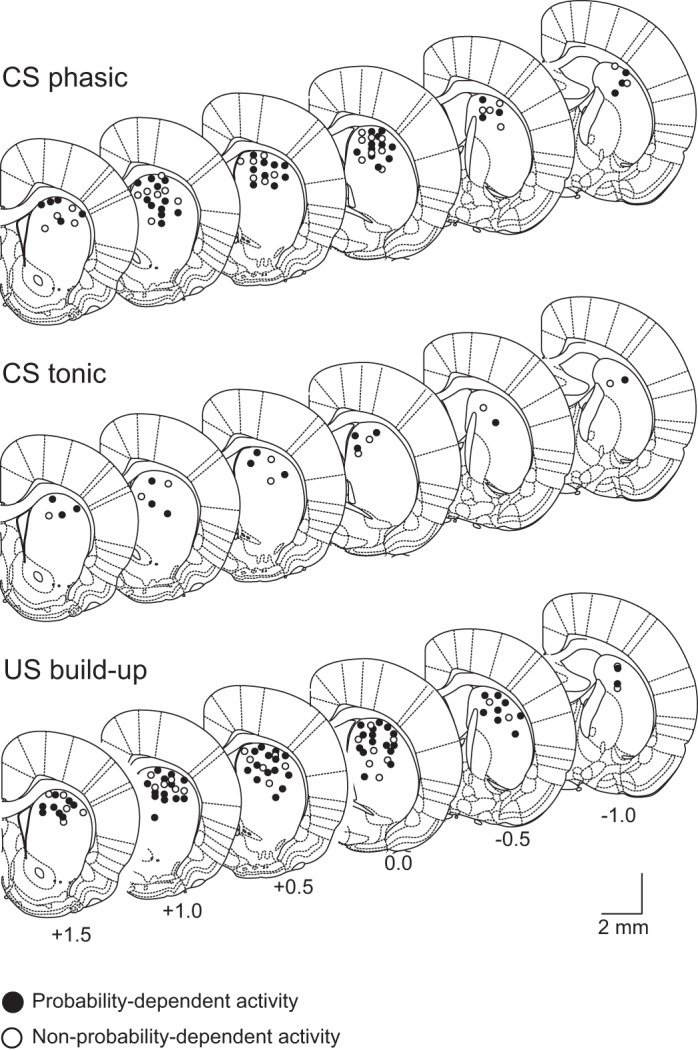
Recording site for each neuron type. Numbers at the bottom indicate the anteroposterior coordinates (in millimeters) from bregma. Coordinates were taken from the stereotaxic atlas of Paxinos and Watson (2005). Filled circles represent the recording locations of neurons that showed probability-dependent CS response or prereward activity, and open circles represent the recording locations of neurons that showed nonprobability-dependent CS response or prereward activity. [Adapted from Paxinos and Watson (2005) with permission.]
DISCUSSION
In this study, we recorded single-unit activity in the dorsal striatum of head-fixed rats that had been pretrained in a probabilistic Pavlovian conditioning task using auditory cues. The neurons recorded in rats performing this task could be categorized into three types based on their firing patterns. CS phasic neurons showed a phasic response to the CS onset, and the magnitude of this response was positively related to reward probability. The majority of these neurons also showed a phasic reward response for which magnitude was negatively related to reward probability (Fig. 4). Thus many CS phasic neurons showed greater phasic responses to CSs that predicted higher reward probability and showed greater phasic responses to less probable rewards. These firing properties correspond to the firing properties of midbrain dopamine neurons and indicate that a subset of CS phasic neurons code a reward prediction error at both the CS onset and the reward onset. In our previous study (Oyama et al. 2010), we compared this type of neuron with midbrain dopamine neurons and concluded that they have highly similar firing properties. CS tonic neurons showed a tonic response during the CS presentation without a reward response, and the magnitude of this response was positively related to reward probability (Fig. 7). These neurons can be considered to code the value of the stimulus. US buildup neurons showed gradually increasing activity toward the time of reward delivery, and the magnitude of the prereward activity was positively related to reward probability. The firing of this type of neuron may reflect the animal's internal expectation about the upcoming reward (Fig. 10).
For all three types of neurons, we examined how activity changed as the delay duration between CS offset and reward onset was prolonged. As expected, the phasic responses in CS phasic neurons were time-locked to the CS and reward onset, and the tonic response in CS tonic neurons was time-locked to the CS onset. The buildup activity in US buildup neuron continued to peak at the reward onset regardless of the delay extension, but the buildup activity itself was prolonged as the delay was extended. These results confirmed the validity of the interpretation of the function of each neuron type. In general, extension of the time interval between the CS and the reward leads to a decrease of the value of the CS or the value of the reward when measured at the time of the CS, which in behavioral economics is known as “temporal discounting” (Ainslie 1975). It has been reported that value-coding neurons show this devaluing effect induced by delay prolongation (Cai et al. 2011; Kobayashi and Schultz 2008). We found that for CS phasic and CS tonic neurons, the CS responses in the high-probability conditions decreased as the delay was prolonged. Given that the reward value predicted by the CS decreases with longer delays, the prediction error that occurs at the actual delivery of reward increases. In addition, the timing of reward is less precise with longer CS-US intervals, which also increases the prediction error (Fiorillo et al. 2008). In accordance with this, we also observed that for CS phasic neurons the reward responses under the high-probability conditions were stronger when the delay was prolonged. When the delay was again set to the original duration, the activity level did not return all the way to the original level: the peak of the CS response in CS phasic and CS tonic neurons and the peak of the buildup activity in US buildup neurons were lower than in the initial session. As the whole procedure of extending the delay duration in two steps and then bringing the delay duration back to the original length took a long time, the motivational level of the animal could have been reduced considerably during the procedure. It is possible that the data reflect not only the effect of time discounting, but also an overall decrease of the motivational level over time.
In the present task, the activity of the majority of the recorded neurons depended on reward probability as indicated by different CSs. This dependency on reward probability implies that the activity was the product of associative learning during the extensive training phase. Previous studies on the synaptic mechanisms in the striatum have shown that long-term potentiation can occur at corticostriatal synapses when the striatal neuron receives both cortical and dopaminergic inputs (Canales et al. 2002; Reynolds et al. 2001; Wickens et al. 1996). In addition, dopamine neurons, which send dense projections to the striatum, fire in response to unexpected rewards, i.e., when a positive reward prediction error occurs (Schultz 1998). These results suggest that when a reward is given after the presentation of a CS, the corticostriatal synapses that transmit the sensory information of the CS would be strengthened. During extensive training, the synapses that transmit the information of a CS indicating higher reward probability, which is more frequently followed by reward, would be strengthened further. As a result of this process, the presentation of a CS indicating higher reward probability would elicit greater striatal activation. This may be the mechanism by which information about stimulus value is acquired. Similarly, the probability-dependent phasic CS response of the reward prediction error-coding neurons may be formed through this process. Moreover, it is conceivable that the firing of neurons coding stimulus value may differentially change the animals' internal motivational state, the elevation of which would be reflected in the buildup activity of reward expectation-coding neurons toward the time of reward delivery. The reward expectation signal would lead to preparation for appropriately acquiring the reward such as directing attention to the reward and preparing to execute the reward-acquiring action. At the timing of the reward delivery, the reward expectation signal would be used to calculate the reward prediction error signal, which is represented in the phasic response to the reward of the reward prediction error-coding neurons.
According to the firing properties of neurons and the waveform of action potentials (Oyama et al. 2010), it is most likely that we recorded from medium spiny projection neurons, which constitute the vast majority of striatal neurons (Apicella 2007; Oorschot 1996). Our results indicate that within the striatal medium spiny neurons there are discrete functional subtypes that code different aspects of reward. It is known that there are different subpopulations of medium spiny neurons such as neurons belonging to the direct pathway or indirect pathway and neurons located in the patch or matrix. Recent studies using transgenic animals and molecular biological techniques have found that neurons belonging to the direct and indirect pathway have different motor functions (Kravitz et al. 2010) and cognitive functions such as learning (Hikida et al. 2010; Kravitz et al. 2012). These results suggest that striatal neurons with different histochemical properties code different information. However, to understand how a neuron relates to a larger neuronal network and how it functions and interacts with other neurons, we need to investigate the precise morphological and histochemical background of the neuron, including its type, which receptors it expresses, and which other neurons it projects to. Staining a single neuron after having recorded from it (Oyama et al. 2013) during a behavioral paradigm will allow for such histochemical and morphological investigations and may reveal the functions and relationships of discrete subtypes of striatal neurons that code different reward-related information.
In our recorded neurons, only a small population showed activity related to reward uncertainty, which is maximal at a reward probability of 50% and gradually decreases as reward probability becomes smaller or larger [although we found in our previous study (Oyama et al. 2010) that none of the reward prediction error-coding neurons, a subset of CS phasic neurons of this study, showed activity related to uncertainty, that may have been a consequence of our having underestimated the number of neurons that code uncertainty because the statistical method we used was not as powerful as the 1 used in this study]. This suggests that the striatum is preferentially involved in coding parametric reward value rather than reward uncertainty. Such a conclusion is consistent with human imaging findings (Tobler et al. 2008) indicating that striatal activation is dependent on reward probability but not on reward uncertainty in a very similar probabilistic Pavlovian conditioning task. Furthermore, we found that only a small number of neurons showed negative correlations between CS-related activity and reward probability even though positive correlations between CS-related activity and reward probability were substantial and numerous. This suggests that in a probabilistic Pavlovian conditioning paradigm, negative reward value-coding is not common in dorsal striatal neurons. This contrasts with previous studies investigating striatal value representation in monkeys involved in an instrumental task in which 30–60% of task-related neurons coded value negatively (Cromwell and Schultz 2003; Samejima et al. 2005). In addition, our striatal neurons showed neither an increase nor decrease of activity at the time of an unexpected reward omission on neither the population nor single-neuron level. This suggests that negative reward prediction error was not coded by striatal neurons in our task and contrasts with what is known about dopamine neurons, which are known to code both positive and negative prediction errors in monkeys (Schultz 1998) and in rodents (Oyama et al. 2010). On the other hand, a recent study recording from monkeys performing an instrumental conditioning task demonstrated that both positive and negative prediction errors were represented in presumed medium spiny neurons primarily by increases in firing rates (Asaad and Eskandar 2011). These inconsistencies with previous studies may be attributable to task or species differences.
In a behavioral task in which both reward and punishment were used as unconditioned stimuli, Matsumoto and Hikosaka (2009) claimed that a subpopulation of dopamine neurons encodes general motivational salience rather than value (but see Fiorillo et al. 2013). Their argument raises the possibility that striatal neurons showing probability-dependent activity may reflect the motivational salience but not the value of stimuli and outcomes. The behavioral task we used in this study, however, cannot dissociate value from motivational salience (Kahnt et al. 2014). Therefore, we cannot rule out the possibility that some neurons recorded in this study code motivational salience rather than value. To determine whether the activity of a neuron reflects reward, punishment, or motivational salience, we need to record the activity in a behavioral paradigm in which both reward and punishment are used as unconditioned stimuli.
It has been suggested that the dorsomedial striatum mediates action-outcome learning or goal-directed behavior and that the dorsolateral striatum mediates stimulus-response learning or habitual behavior (Barnes et al. 2005; Jog et al. 1999; Packard and Knowlton 2002; Yin et al. 2004, 2005). In this study, we recorded from both medial and lateral areas and found many active neurons, although we used a Pavlovian paradigm in which the animals were not required to perform any action. Our data suggest that the dorsal striatum is involved not only in goal-directed or habitual behavior, but also in more general associative learning, including probabilistic Pavlovian conditioning.
GRANTS
This study was funded by Grants-in-Aid for Scientific Research (KAKENHI) #24223004, #24243067, and #19673002 to K.-I. Tsutsui. K. Oyama was supported by Japan Society for the Promotion of Science as a Research Fellow and was funded by KAKENHI #24-8027. P. N. Tobler was supported by the Swiss National Science Foundation (PP00P1_128574 and PP00P1_150739).
DISCLOSURES
No conflicts of interest, financial or otherwise, are declared by the authors.
AUTHOR CONTRIBUTIONS
K.-I.T. conception and design of research; K.O. performed experiments; K.O. and Y.T. analyzed data; K.O., I.H., P.N.T., and K.-I.T. interpreted results of experiments; K.O. prepared figures; K.O. and K.-I.T. drafted manuscript; I.H., P.N.T., and T.I. edited and revised manuscript; K.-I.T. approved final version of manuscript.
REFERENCES
- Ainslie G. Specious reward: a behavioral theory of impulsiveness and impulse control. Psychol Bull 82: 463–496, 1975. [DOI] [PubMed] [Google Scholar]
- Anden NE, Carlsson A, Dahlstroem A, Fuxe K, Hillarp NA, Larsson K. Demonstration and mapping out of nigro-neostriatal dopamine neurons. Life Sci 3: 523–530, 1964. [DOI] [PubMed] [Google Scholar]
- Apicella P. Leading tonically active neurons of the striatum from reward detection to context recognition. Trends Neurosci 30: 299–306, 2007. [DOI] [PubMed] [Google Scholar]
- Apicella P, Scarnati E, Ljunberg T, Schultz W. Neuronal activity in monkey striatum related to the expectation of predictable environmental events. J Neurophysiol 68: 945–960, 1992. [DOI] [PubMed] [Google Scholar]
- Asaad WF, Eskandar EN. Encoding of both positive and negative reward prediction errors by neurons of the primate lateral prefrontal cortex and caudate nucleus. J Neurosci 31: 17772–17787, 2011. [DOI] [PMC free article] [PubMed] [Google Scholar]
- Barnes TD, Kubota Y, Hu D, Jin DZ, Graybiel AM. Activity of striatal neurons reflects dynamic encoding and recoding of procedural memories. Nature 437: 1158–1161, 2005. [DOI] [PubMed] [Google Scholar]
- Bolam JP, Hanley JJ, Booth PA, Bevan MD. Synaptic organization of the basal ganglia. J Anat 196: 527–542, 2000. [DOI] [PMC free article] [PubMed] [Google Scholar]
- Bordi F, LeDoux J. Sensory tuning beyond the sensory system: an initial analysis of auditory response properties of neurons in the lateral amygdaloid nucleus and overlying areas of the striatum. J Neurosci 12: 2493–2503, 1992. [DOI] [PMC free article] [PubMed] [Google Scholar]
- Burke CJ, Tobler PN. Coding of reward probability and risk by single neurons in animals. Front Neurosci 5: 121, 2011. [DOI] [PMC free article] [PubMed] [Google Scholar]
- Cai X, Kim S, Lee D. Heterogeneous coding of temporally discounted values in the dorsal and ventral striatum during intertemporal choice. Neuron 69: 170–182, 2011. [DOI] [PMC free article] [PubMed] [Google Scholar]
- Canales JJ, Capper-Loup C, Hu D, Choe ES, Upadhyay U, Graybiel AM. Shifts in striatal responsivity evoked by chronic stimulation of dopamine and glutamate systems. Brain 125: 2353–2363, 2002. [DOI] [PubMed] [Google Scholar]
- Cromwell HC, Schultz W. Effects of expectations for different reward magnitudes on neuronal activity in primate striatum. J Neurophysiol 89: 2823–2838, 2003. [DOI] [PubMed] [Google Scholar]
- Doron NN, Ledoux JE, Semple MN. Redefining the tonotopic core of rat auditory cortex: physiological evidence for a posterior field. J Comp Neurol 453: 345–360, 2002. [DOI] [PubMed] [Google Scholar]
- Fiorillo CD, Newsome WT, Schultz W. The temporal precision of reward prediction in dopamine neurons. Nat Neurosci 11: 966–973, 2008. [DOI] [PubMed] [Google Scholar]
- Fiorillo CD, Tobler PN, Schultz W. Discrete coding of reward probability and uncertainty by dopamine neurons. Science 299: 1898–1902, 2003. [DOI] [PubMed] [Google Scholar]
- Fiorillo CD, Yun SR, Song MR. Diversity and homogeneity in responses of midbrain dopamine neurons. J Neurosci 33: 4693–4709, 2013. [DOI] [PMC free article] [PubMed] [Google Scholar]
- Graybiel AM. The basal ganglia. Curr Biol 10: R509–R511, 2000. [DOI] [PubMed] [Google Scholar]
- Hassani OK, Cromwell HC, Schultz W. Influence of expectation of different rewards on behavior-related neuronal activity in the striatum. J Neurophysiol 85: 2477–2489, 2001. [DOI] [PubMed] [Google Scholar]
- Hikida T, Kimura K, Wada N, Funabiki K, Nakanishi S. Distinct roles of synaptic transmission in direct and indirect striatal pathways to reward and aversive behavior. Neuron 66: 896–907, 2010. [DOI] [PubMed] [Google Scholar]
- Hikosaka O, Sakamoto M, Usui S. Functional properties of monkey caudate neurons. I. Activities related to saccadic eye movements. J Neurophysiol 61: 780–798, 1989a. [DOI] [PubMed] [Google Scholar]
- Hikosaka O, Sakamoto M, Usui S. Functional properties of monkey caudate neurons. II. Visual and auditory responses. J Neurophysiol 61: 799–813, 1989b. [DOI] [PubMed] [Google Scholar]
- Hollerman JR, Tremblay L, Schultz W. Influence of reward expectation on behavior-related neuronal activity in primate striatum. J Neurophysiol 80: 947–963, 1998. [DOI] [PubMed] [Google Scholar]
- Jog MS, Kubota Y, Connolly CI, Hillegaart V, Graybiel AM. Building neural representations of habits. Science 286: 1745–1749, 1999. [DOI] [PubMed] [Google Scholar]
- Kahnt T, Park SQ, Haynes JD, Tobler PN. Disentangling neural representations of value and salience in the human brain. Proc Natl Acad Sci USA 111: 5000–5005, 2014. [DOI] [PMC free article] [PubMed] [Google Scholar]
- Kawagoe R, Takikawa Y, Hikosaka O. Expectation of reward modulates cognitive signals in the basal ganglia. Nat Neurosci 1: 411–416, 1998. [DOI] [PubMed] [Google Scholar]
- Kepecs A, Uchida N, Zariwala HA, Mainen ZF. Neural correlates, computation and behavioral impact of decision confidence. Nature 455: 227–231, 2008. [DOI] [PubMed] [Google Scholar]
- Kimura M. Behaviorally contingent property of movement-related activity of the primate putamen. J Neurophysiol 63: 1277–1296, 1990. [DOI] [PubMed] [Google Scholar]
- Kobayashi S, Schultz W. Influence of reward delays on responses of dopamine neurons. J Neurosci 28: 7837–7846, 2008. [DOI] [PMC free article] [PubMed] [Google Scholar]
- Kravitz AV, Freeze BS, Parker PR, Kay K, Thwin MT, Deisseroth K, Kreitzer AC. Regulation of parkisonian motor behaviors by optogenetic control of basal ganglia circuitry. Nature 466: 622–626, 2010. [DOI] [PMC free article] [PubMed] [Google Scholar]
- Kravitz AV, Tye LD, Kreitzer AC. Distinct roles for direct and indirect pathway striatal neurons in reinforcement. Nat Neurosci 15: 816–818, 2012. [DOI] [PMC free article] [PubMed] [Google Scholar]
- Lau B, Glimcher PW. Value representations in the primate striatum during matching behavior. Neuron 58: 451–463, 2008. [DOI] [PMC free article] [PubMed] [Google Scholar]
- Matsumoto M, Hikosaka O. Two types of dopamine neurons distinctly convey positive and negative motivational signals. Nature 459: 837–841, 2009. [DOI] [PMC free article] [PubMed] [Google Scholar]
- Nakamura K, Santos G, Matsuzaki R, Nakahara H. Differential reward coding in the subdivisions of the primate caudate during an oculomotor task. J Neurosci 32: 15963–15982, 2012. [DOI] [PMC free article] [PubMed] [Google Scholar]
- Ogawa M, van der Meer MA, Esber GR, Cerri DH, Stalnaker TA, Schoenbaum G. Risk-responsive orbitofrontal neurons track acquired salience. Neuron 77: 251–258, 2013. [DOI] [PMC free article] [PubMed] [Google Scholar]
- Oorschot DE. Total number of neurons in the neostriatal, pallidal, subthalamic, and substantia nigral nuclei of the rat basal ganglia: a stereological study using the Cavalieri and optical disector methods. J Comp Neurol 366: 580–599, 1996. [DOI] [PubMed] [Google Scholar]
- Oyama K, Hernádi I, Iijima T, Tsutsui K. Reward prediction error coding in dorsal striatal neurons. J Neurosci 30: 11447–11457, 2010. [DOI] [PMC free article] [PubMed] [Google Scholar]
- Oyama K, Ohara S, Sato S, Karube F, Fujiyama F, Isomura Y, Mushiake H, Iijima T, Tsutsui KI. Long-lasting single-neuron labeling by in vivo electroporation without microscopic guidance. J Neurosci Methods 218: 139–147, 2013. [DOI] [PubMed] [Google Scholar]
- Packard MG, Knowlton BJ. Learning and memory functions of the basal ganglia. Annu Rev Neurosci 25: 563–593, 2002. [DOI] [PubMed] [Google Scholar]
- Paxinos G, Watson C. The Rat Brain in Stereotaxic Coordinates. San Diego, CA: Academic Press, 2005. [Google Scholar]
- Reynolds JN, Hyland BI, Wickens JR. A cellular mechanism of reward-related learning. Nature 413: 67–70, 2001. [DOI] [PubMed] [Google Scholar]
- Rolls ET, Thorpe SJ, Maddison SP. Responses of striatal neurons in the behaving monkey. 1. Head of the caudate nucleus. Behav Brain Res 7: 179–210, 1983. [DOI] [PubMed] [Google Scholar]
- Sally SL, Kelly JB. Organization of auditory cortex in the albino rat: sound frequency. J Neurophysiol 59: 1627–1638, 1988. [DOI] [PubMed] [Google Scholar]
- Samejima K, Ueda Y, Doya K, Kimura M. Representation of action-specific reward values in the striatum. Science 310: 1337–1340, 2005. [DOI] [PubMed] [Google Scholar]
- Schultz W. Predictive reward signal of dopamine neurons. J Neurophysiol 80: 1–27, 1998. [DOI] [PubMed] [Google Scholar]
- Sutter ML, Schreiner CE. Physiology and topography of neurons with multipeaked tuning curves in cat primary auditory cortex. J Neurophysiol 65: 1207–1226, 1991. [DOI] [PubMed] [Google Scholar]
- Sutton RS, Barto AG. Reinforcement Learning: An Introduction. Cambridge, MA: The MIT Press, 1998. [Google Scholar]
- Tobler N, Christopoulos GI, O'Doherty JP, Dolan RJ, Schultz W. Neuronal distortions of reward probability without choice. J Neurosci 28: 11703–11711, 2008. [DOI] [PMC free article] [PubMed] [Google Scholar]
- Wickens JR, Begg AJ, Arbuthnott GW. Dopamine reverses the depression of rat corticostriatal synapses which normally follows high-frequency stimulation of cortex in vitro. Neuroscience 70: 1–5, 1996. [DOI] [PubMed] [Google Scholar]
- Yin HH, Knowlton BJ, Balleine BW. Lesions of dorsolateral striatum preserve outcome expectancy but disrupt habit formation in instrumental learning. Eur J Neurosci 19: 181–189, 2004. [DOI] [PubMed] [Google Scholar]
- Yin HH, Ostlund SB, Knowlton BJ, Balleine BW. The role of the dorsomedial striatum in instrumental conditioning. Eur J Neurosci 22: 513–523, 2005. [DOI] [PubMed] [Google Scholar]


