Abstract
Deregulation of SOX9 expression has been detected in various human cancer tissues; however, the functional role of SOX9 expression has not been fully elucidated in glioma. SOX9 expression in glioma tissues was analyzed using public tumor datasets and quantitative reverse transcription polymerase chain reaction. The association of SOX9 expression with clinical prognosis in glioma patients was analyzed by examining publically available microarray profiling datasets. The functional roles of SOX9 in glioma were examined using gene set enrichment analysis (GSEA). Cell growth was measured using soft agar colony formation assay, and the cell cycle was analyzed using flow cytometry. Our data showed that SOX9 expression was commonly upregulated in glioma tissues, and patients with high SOX9 levels had shorter survival times. GSEA identified that the gene sets regulating cell proliferation and cell cycle progression were significantly enriched in glioma cells with high SOX9 expression. SOX9 downregulation decreased cyclin D1, CDK4 expression and Rb phosphorylation, which correlated with a reduced population of cells in the S phase and suppressed growth. SOX9, as an oncogene, is highly expressed in gliomas and may be potential indicators of a poor prognosis in glioma patients. SOX9 knockdown may suppress cancer cell growth by inducing cell cycle arrest, which suggests that SOX9 is a potential therapeutic target in glioma.
Keywords: SOX9, glioma, proliferation, cell cycle, prognosis
Introduction
Globally, glioma is the most common primary brain tumor, and approximately 350,000 people are diagnosed with glioma every year [1]. On the basis of histopathological and clinical criteria, the World Health Organization (WHO) has classified gliomas into four grades [2]. Among them, glioblastoma multiforme (GBM), a grade IV glioma, accounts for almost 80% of all primary malignant brain tumors in adults. Despite advances in treatment, the median survival of GBM patients is only about 15 months [3]. Given the life-threatening nature of glioma, it is crucial to identify biomarkers for early detection and prognosis estimation, and to understand the mechanisms underlying the functional roles of the molecules involved in the development and progression of this cancer.
Members of the SOX (sex-determining region Y (SRY)-box protein) gene family are characterized by a conserved high mobility group DNA-binding domain [4]. SOX9 was first identified as a key regulator of cartilage and male gonad development, with mutations in SOX9 causing campomelic dysplasia and autosomal sex reversal [5,6]. As transcription factors, several SOX genes, including SOX2, SOX4, SOX5, SOX6, SOX14, SOX21, SOX11, and SOX10, have been shown to be expressed in the central nervous system, and are involved in brain tumorigenesis [1]. SOX9, as an oncogene, has been found to be upregulated in several types of tumors, such as lung cancer [7,8], breast cancer [9], colorectal cancer [10], ovarian cancer [11], and prostate cancer [12]. However, the functional role of SOX9 in glioma has not been fully elucidated. Furthermore, the downstream oncogenic molecular pathways regulated by SOX9 in glioma have not been completely delineated, despite the reported oncogenic role of SOX9 in glioma proliferation [13,14].
In this study, we found that SOX9 is upregulated in glioma patients, and that this upregulation is associated with poor prognosis. By using gene set enrichment analysis (GSEA) with microarray data [15], we found that the gene sets regulating cell proliferation and cell cycle progression were significantly enriched in cells with high SOX9 expression. We also showed that downregulation of SOX9 inhibits the anchorage-independent growth of glioma cells through cyclin D1/CDK4/Rb pathway.
Materials and methods
Patients and tissue samples
This study was approved by the Research Ethics Committee of the First Affiliated Hospital of Liaoning Medical University, P. R. China. Written informed consent was obtained from all patients. All specimens were handled and anonymized according to ethical and legal standards. A total of 32 patients with glioma were recruited between December 2010 and September 2014 from the Department of Neurosurgery, the First Affiliated Hospital of Liaoning Medical University, Jinzhou City, China. None of the patients had received chemotherapy or radiotherapy prior to surgery. Tumor tissues and adjacent non-neoplastic brain tissues were divided using laser microdissection. The specimens were snap-frozen in liquid nitrogen and stored at -80°C for real-time polymerase chain reaction (PCR) assays. The clinicopathological features of the patients were obtained from their medical records and included age, sex, pathological phenotypes, and stage classification. The patients in this study were 17 men (53.1%) and 15 women (46.9%) with a mean age of 56.0 ± 9.9 years (range: 27-75 years). Pathological slides from all resected tumor specimens were reviewed by each author to confirm the diagnosis of each grade of the studied astrocytoma specimens, according to the criteria established by the WHO for the classification of brain tumors [3]. The specimens were classified into low-grade gliomas (grades I-II), 15 specimens; anaplastic astrocytomas (grade III), 9 specimens; and GBMs (grade IV), 8 specimens.
Antibodies and reagents
The following antibodies were used: anti-SOX9 (Santa Cruz Biotechnology, 1:500), anti β-actin (ProteinTech Group, Inc, 1:5000), anti-cyclin D1 (Sigma Aldrich, Inc, 1:1000), anti-CDK4 (Covance, Inc, 1:500), anti-Rb (Cruz Biotechnology, 1:500), and anti-Rb (phospho Ser780) (Cell Signaling Technology, 1:500). Reagents used were as follow: Lipofectamine 2000 (Invitrogen, Inc), low melting point agarose (Amresco, lnc), and enhanced chemiluminescence (ECL) reagent kit ( Millipore, Inc).
Cell culture
Glioma cell line U87 and U373 were maintained in Dulbecco’s modified Eagle’s medium (Sigma, St Louis, MO, USA) supplemented with 10% fetal bovine serum (Sigma, St Louis, MO, USA), 100 units/ml penicillin and 100 mg/ml streptomycin at 37°C in a 5% CO2 atmosphere.
RNA extraction and quantitative reverse transcription PCR analysis
Total RNA was extracted from the cells or tissues by using the TRIzol reagent (Invitrogen, USA) according to the manufacturer’s instructions. Complementary DNA was synthesized using the PrimeScript RT reagent kit (TaKaRa, Japan), and quantitative reverse transcription (qRT)-PCR analyses were conducted using SYBR Premix Ex Taq (TaKaRa, Japan) with GAPDH as an internal control. The following primers were used: SOX9, 5’-GTACCCGCACTTGCACAAC-3’ and 5’-TCGCTCTCGTTCAGAA GTCTC-3’ [7]; GAPDH, 5’-GGAGCGAGATCCCTCCAAAAT3’ and 5’-GGCTGT TGTCATACTTCTCATGG-3’. We used a two-step amplification (40 cycles at 95°C for 15 s; 60°C for 30 s; and 72°C for 30 s; followed by the melting temperature determination stage), and fold enrichment was calculated using the 2-ΔΔCT method.
SOX9 gene expression and survival analysis in human glioma samples
Correlations between glioma and SOX9 gene expression were determined through analysis of the glioma datasets of The Cancer Genome Atlas (TCGA), Sun et al., Shai et al., and Bredel et al., which are available through Oncomine (http://www.oncomine. org/). Kaplan-Meier survival analyses for the SOX9 gene were performed using Gene Expression Omnibus (GEO) datasets (GSE7696, GSE42699, GSE11117, GSE26712, GSE13876, and GSE10846), TCGA low-grade glioma dataset, TCGA head and neck squamous cell carcinoma dataset, and Memorial Sloan Kettering Cancer Center (MSKCC) prostate cancer dataset. The association of SOX9 expression with patient prognosis was determined using this analysis. P-values of less than 0.05 were considered to indicate significant associations.
Generation of stable shRNA-expressing cell lines
All shRNAs were cloned into the pLKO.1-puro lentiviral vector. The targeting sequences are listed as follows: human shSOX9#1, GCATCCTTCAATTTCTGTATA; human shSOX9#2, GCGGAGGAAGTCGGTGAAGAA; and pLKO.1 control shRNA (containing non-target scramble shRNA, Addgene plasmid #1864). The lentiviral vector was transfected together with pMD-VsVg and pCMV in the HEK293T packaging cell line to produce virus supernatants, using Lipofectamine 2000. Glioma cells were transduced twice with the virus supernatants and 8 μg/mL Polybrene (Millipore), and selected using puromycin 24 h after the second transduction.
Cell cycle analysis
For analyzing the effect of SOX9 knockdown on the cell cycle, U87 and U373 cells were infected with shSOX9 and the control plasmid. After 3 days, suspensions of 1 × 10⁶ cells were washed in cold phosphate-buffered saline (PBS), fixed in 70% ethanol in PBS for at least 1 h on ice, washed, resuspended in PBS containing 25 mg/mL propidium iodide (PI) and 100 mg/mL ribonuclease A, and incubated for 30 min at 37°C. Fluorescence was measured on a BD FACSCalibur flow cytometer (excitation: 488 nm, measurement: 564-607 nm) within 1 h. Data were analyzed using the Flowjo software. The mean and standard errors for the percentage of cells in each phase of the cell cycle were derived from at least three independent experiments.
Gene set enrichment analysis (GSEA)
GSEA was performed using the Broad Institute platform [15]. Samples were analyzed with weighted, Signal2Noise default settings. Microarray gene expression data from Sun et al. [16] were grouped based on the SOX9 expression level. Gene sets with a false discovery rate (FDR) value < 0.25 after performing 1,000 permutations were considered to be significantly enriched.
Statistical analysis
All grouped data are presented as mean ± standard error of the mean (SEM). To determine statistical significance, results were compared by means of the paired t-test (for two samples) or analysis of variance (for more than two samples). For survival analyses, Kaplan-Meier curves were generated using Prism software, and log-rank analysis was performed. All experiments presented were repeated at least three times. P < 0.05 at the 95% confidence level was considered significant.
Results
SOX9 expression is upregulated in glioma
To evaluate the role of SOX9 in glioma, we measured the levels of SOX9 expression in a panel of glioma samples with matched adjacent non-tumor brain tissue control samples. The level of SOX9 mRNA was analyzed using qRT-PCR. SOX9 expression was significantly higher in the glioma samples than in the adjacent non-tumor brain tissues (P < 0.001; Figure 1A). To validate our results, SOX9 expression profiles were further examined in datasets from the Oncomine database (http://www.oncomine.org/), which contained mRNA profiling data from four independent cohorts of glioma samples. Remarkably, SOX9 mRNA levels were significantly higher in glioma samples than in the control samples in all four datasets (Figure 1B). Together, these results show a highly consistent pattern of upregulation of SOX9 expression in glioma samples.
Figure 1.
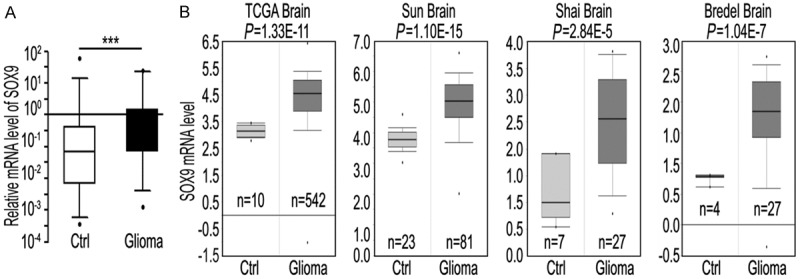
SOX9 expression is upregulated in human glioma samples. A: SOX9 mRNA level in 32 pairs of glioma and adjacent non-cancerous brain tissue (control) samples. Values shown (Y axis represents relative expression units) are normalized to GAPDH. ***P < 0.001. B: Four glioma gene expression studies are analyzed using Oncomine (http://www.oncomine.org). SOX9 is significantly upregulated at the mRNA level in glioma samples as compared to the control brain tissues in all four datasets (TCGA, Sun et al., Shai et al., Landi et al., and Bredel et al.). Box and whisker plots: dots represent maximum and minimum values; whiskers show 90th and 10th percentiles; boxes show 75th and 25th percentiles; and the line indicates the median value. P-values were computed using Oncomine software and the Student t-test. Ctrl: control brain tissue samples.
SOX9 expression levels correlate with clinical outcomes in a wide range of human cancers
To examine the relationship between SOX9 expression and clinical outcomes, we analyzed the association between SOX9 expression and patient survival by examining publically available microarray profiling datasets for glioma. For each dataset, patients with glioma were classified into two groups based on the expression level of the SOX9 gene. Kaplan-Meier analysis was used to evaluate survival differences between the group with high SOX9 expression and that with low SOX9 expression. In all three glioma datasets in which survival data were available, low SOX9 expression correlated with longer overall patient survival (Figure 2A-C).
Figure 2.
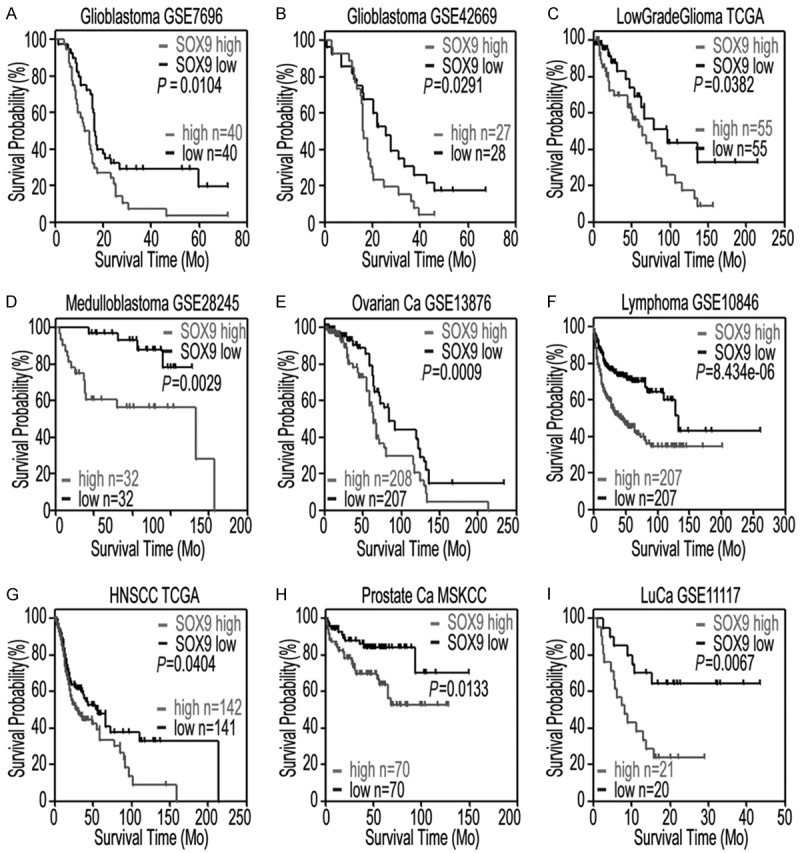
High SOX9 expression correlates with poor patient survival in multiple cancer datasets. Kaplan-Meier curves showing the overall survival analysis in patients with high and low expressions of SOX9 from nine public tumor datasets. A: Glioblastoma dataset (GSE7696: high expression, n = 40; low expression, n = 40; P = 0.0104, log-rank analysis). B: Glioblastoma dataset (GSE42669; high expression, n = 27; low expression, n = 28; P = 0.0291, log-rank analysis). C: Low-grade glioma TCGA dataset (high expression, n = 55; low expression, n = 55; P = 0.0382, log-rank analysis). D: Medulloblastoma dataset (GSE28245; high expression, n = 32; low expression, n = 32; P = 0.0029, log-rank analysis). E: Ovarian cancer (Ovarian Ca) dataset (GSE13876; high expression, n = 208; low expression, n = 207; P = 0.0009, log-rank analysis). F: Lymphoma dataset (GSE10846; high expression, n = 207; low expression, n = 207; P = 8.434e-06, log-rank analysis). G: TCGA head and neck squamous cell carcinoma (HNSCC) dataset (high expression, n = 142; low expression, n = 141; P = 0.0404, log-rank analysis). H: MSKCC prostate cancer dataset (high expression, n = 70; low expression, n = 70; P = 0.0133, log-rank analysis). I: Lung cancer (LuCa) dataset (GSE11117; high expression, n = 21; low expression, n = 20; P = 0.0067, log-rank analysis).
We further investigated the association between SOX9 expression and patient survival in other types of cancers. We found that high SOX9 expression correlated with poor survival in a range of other cancers, including medulloblastoma (Figure 2D), ovarian cancer (Figure 2E), lymphoma (Figure 2F), head and neck squamous cell carcinoma (Figure 2G), prostate cancer (Figure 2H), and lung cancer (Figure 2I). These data suggest that SOX9 acts as an oncogene in a variety of human cancers.
GSEA revealed that gene sets regulating cell proliferation and cell cycle progression were enriched in gliomas with high SOX9 expression
To determine if the high SOX9 levels in glioma were associated with the expression of known oncological genes in other tumors, we used GSEA to identify gene expression signatures that correlated with SOX9 expression. The results showed that eight gene sets were significantly enriched, with a false discovery rate (FDR) of < 25% (Table 1). Among these gene sets, genes in the cell cycle signature were a highly enriched gene set with high SOX9 expression (enrichment score [ES] = 0.59, FDR = 0.201; Figure 3A). Similarly, genes within the proliferation signature (ES = 0.53, FDR = 0.243; Figure 3B) were also significantly enriched. Thus, SOX9 may be an oncogene that drives the tumorigenesis and progression of glioma by regulating cell proliferation and the cell cycle.
Table 1.
GSEA of genes ranked by positive correlation with SOX9 expression in glioma
| Gene set | ES | Nominal P-value | FDR q-value |
|---|---|---|---|
| GEORGES_CELL_CYCLE_MIR192_TARGETS | 0.59 | 0.028 | 0.201 |
| CHIANG_LIVER_CANCER_SUBCLASS_PROLIFERATION_UP | 0.53 | 0.107 | 0.243 |
| NUNODA_RESPONSE_TO_DASATINIB_IMATINIB_UP | 0.60 | 0.011 | 0.247 |
| TCGA_GLIOBLASTOMA_COPY_NUMBER_UP | 0.58 | 0.010 | 0.207 |
| TANG_SENESCENCE_TP53_TARGETS_DN | 0.61 | 0.090 | 0.245 |
| KAUFFMANN_DNA_REPAIR_GENES | 0.54 | 0.016 | 0.199 |
| KAUFFMANN_DNA_REPLICATION_GENES | 0.53 | 0.018 | 0.202 |
| RHODES_CANCER_META_SIGNATURE | 0.74 | 0.006 | 0.228 |
ES, enrichment score; FDR, false discovery rate.
Figure 3.
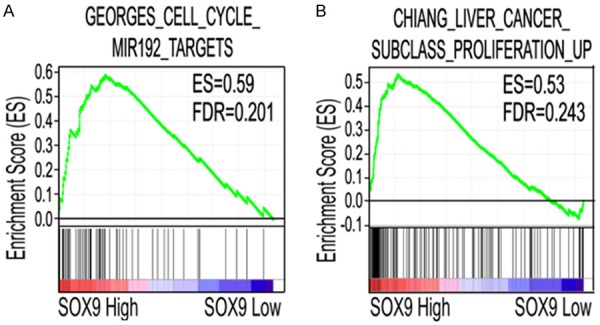
GSEA of genes ranked by positive correlation with SOX9 expression in glioma. Gene expression in 81 gliomas extracted from the GSE4290 dataset [16] was ranked for positive correlation with SOX9 expression and analyzed using the GSEA algorithm and Reactome gene sets. The bar-code plot indicates the positions of genes in each gene set; red and blue represent positive and negative Pearson correlations with SOX9 expression, respectively. A: Enrichment plots is shown for the activated genes related to cell cycle; B: Enrichment plots are shown for the activated genes related to cell proliferation. ES, enrichment score; FDR, false discovery rate.
Knockdown of SOX9 affects glioma cell proliferation and cell cycle
To verify the roles of SOX9 in glioma progression indicated by GSEA, we generated U87 and U373 glioma cell line stably transduced with an shRNA targeting SOX9 and a control cell line. The reduction in SOX9 expression was confirmed using western blot analysis (Figure 4C). Soft agar colony-formation assays revealed that SOX9 knockdown reduced U87 and U373 cells proliferation (Figure 4A and 4B). In addition, flow cytometry showed that after SOX9 knockdown, the percentage of U87 and U373 cells in the S phase was dramatically lower than that of control cells in the S phase. SOX9 knockdown significantly increased the percentage of cells in the G1/G0 phase (Figure 5A-D). Collectively, our results suggest that SOX9 knockdown inhibits the proliferation of glioma cells and induces G1/S arrest.
Figure 4.
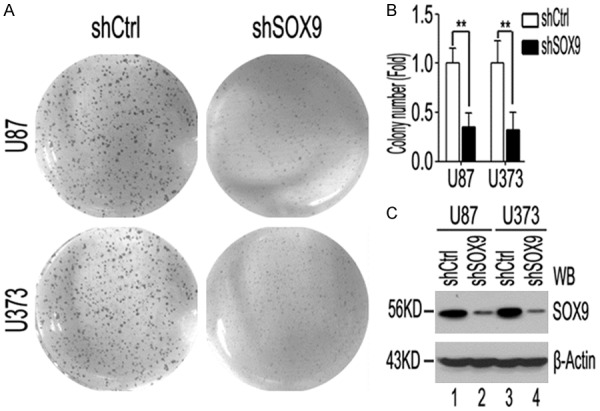
SOX9 knockdown inhibits glioma cell proliferation. A: Colony-formation assay using U87 and U373 cells with stable knockdown of SOX9 and control cells (shCtrl). B: The results are expressed as the fold of colonies with respect to the control. C: Western blot analysis and quantification of SOX9 proteins in cells with stable knockdown of SOX9 and control cells. β-Actin is the loading control. The data were obtained from three different experiments. ***P < 0.001.
Figure 5.
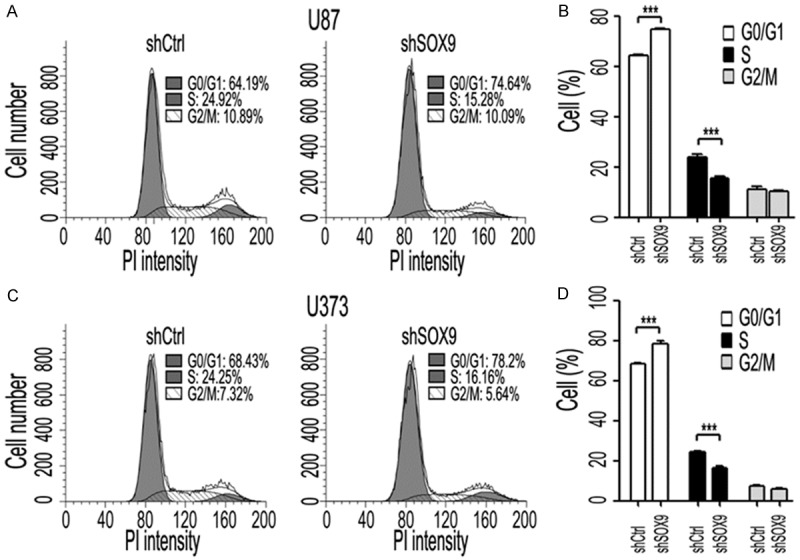
SOX9 knockdown reduced the percentage of cells in the S phase and increased the percentage of cells in the G phase. A and C: Representative cell cycle profiles are shown for U87 and U373 cells transfected with the control (Ctrl) shRNA or shSOX9 for 72 h, treated as described in the “Materials and Methods”, and analyzed for DNA content by using propidium iodide (PI) staining. B and D: Values are means + SEM of three independent experiments. ***P < 0.001 using Mann-Whitney test.
Cyclin D1/CDK4/Rb pathway was involved in SOX9-associated growth inhibition in glioma cells
To further examine the molecular mechanism underlying the SOX9 knockdown-mediated growth inhibition of glioma cells, we manipulated the knockdown of SOX9 gene expression in glioma cells and determined whether the expressions of other genes were altered according to the SOX9 expression level. Surprisingly, SOX9 knockdown by specific shRNA in U87 cells decreased the cyclin D1, CDK4 and phosphorylaed Rb1 level (Figure 6A). In addition, overexpression of CDK4 substantially, though not completely, blocked the downregulation of phosphorylated RB1 expression caused by knockdown of SOX9 (Figure 6B). Together, these fndings suggest that Cyclin D1/CDK4/Rb pathway was involved in SOX9-associated growth inhibition in glioma cells.
Figure 6.
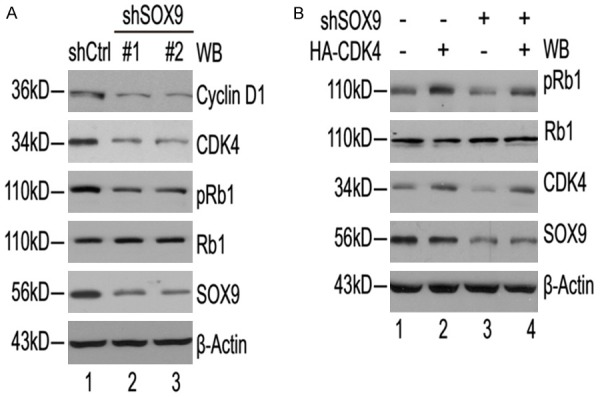
SOX9 level-dependent alterations in cyclin D1, CDK4, and phosphorylated Rb1 in U87 cells. A: U87 cells were treated with shSOX9#1 and shSOX9#2 or non-specific scramble control shRNA and incubated for 72 h. The levels of the SOX9, cyclin D1, CDK4, RB1, phosphorylated RB1 and β-actin proteins were determined by western blotting. The β-actin protein level was used as an internal control. B: Intracellular SOX9, CDK4, RB1 and pRB1 were analyzed by Western blot 48 hours after overexpression of CDK4 or empty vector, in U87 cells.
Discussion
The present study revealed that SOX9 mRNA expression was upregulated in glioma tissues compared with the expression level in the adjacent non-tumor tissues. In addition, we found that SOX9 played a key role as an oncogene in glioma, i.e., low expression of SOX9 was associated with a better prognosis. Moreover, GSEA based on GEO expression array data showed that SOX9 expression was significantly associated with upregulation of the genes involved in cell proliferation and cell cycle signaling. By in vitro assays, we confirmed that the knockdown of SOX9 in glioma cell lines resulted in less aggressive cell proliferation and cell cycle arrest. In glioma cells, knockdown of SOX9 decreases cyclin D1, CDK4 expression and Rb phosphorylation. The above data support the pro-oncogenic roles of SOX9 in glioma.
As a transcription factor, SOX9 was originally known to be a regulator of bone formation [17] and testis development [18]. Subsequently, numerous studies confirmed that SOX9 is also involved in the development of other organs, such as the pancreas [19] and prostate [20]. Recently, altered SOX9 gene expression has been associated with different types of cancers, including glioma [13]. Our study provides further evidence that SOX9 is a glioma-associated gene and that its expression is increased in glioma tissue samples. This upregulated expression of SOX9 was observed in multiple microarray datasets of glioma and was confirmed by qRT-PCR analysis. Low SOX9 expression was associated with a better prognosis in glioma patients, which is consistent with previous results [13]. The human SOX9 gene is located at chromosome 17q24.3, a region that is frequently gained or amplified in glioma. In this region, a few genes have been identified to be overexpressed. For example, gene overexpressed in astrocytoma (GOA) located at this region has been identified to play an important role in the process of dedifferentiation that is associated with astrocytoma tumorigenesis [21]. In addition, SOX9 is a target gene regulated by miR-145; thus, in glioma tissues, the downregulation of miR-145 may contribute to the overexpression of SOX9 [22]. Together, our results suggest that SOX9 plays critical roles in glioma and is a potential prognostic biomarker for glioma progression. However, the molecular mechanism of SOX9 upregulation in glioma was not investigated in the present study. Therefore, further studies are necessary to resolve this question.
The mechanisms underlying the roles of SOX9 in gliomas remain to be elucidated. Using GSEA, a more reproducible and interpretable method that focuses on pathways and processes rather than on high scoring individual genes [15], we surprisingly found that the gene sets regulating cell proliferation and cell cycle progression were significantly correlated with SOX9 expression. This finding prompted us to examine the impact of SOX9 on cell proliferation and cell cycle progression. The downregulation of SOX9 by specific shRNA in glioma cells tended to inhibit cell growth in vitro and moderately decreased the percentage of cells in the S phase. This result is consistent with our finding that high SOX9 expression is associated with a worse prognosis in glioma patients. Our findings are consistent with those of recent studies on other cancers that have showed that SOX9 downregulation inhibits cell proliferation in vitro and tumor xenograft growth in vivo [10,23].
At the protein level, we found that attenuation of SOX9 in glioma cells significantly altered cyclin D1, CDK4, and pRB1 levels. Because the cyclin D1/CDK4/Rb pathway plays well-known role in the regulation of cell proliferation and cell cycle progression. Our data is similar to the results of a study of lung cancer cells which showed that CDK4 were the targets of SOX9 [7]. As a tumor suppressor protein, retinoblastoma protein (Rb) binds to and inhibits transcription factors of E2F family [24]. Rb is initially phosphorylated to pRb by cyclin D/CDK4/CDK6, which can prevent excessive cell growth by inhibiting cell cycle progression through G1 into S. These results collectively show that SOX9 may regulate these signaling molecules and may confer growth advantages to these cells over normal cells.
In conclusion, our data demonstrate that SOX9 functions as an oncogene by regulating cell proliferation and cell cycle signaling. Moreover, SOX9 upregulation is common in glioma, and SOX9 may be a potential indicator of survival in patients with glioma.
Acknowlegements
We thank Dr. Yunxing Cao in the Department of Neuroscience in The First Affiliated Hospital of Liaoning Medical University for help in collection of patient samples. This work was supported by the National Natural Science Foundation of China (81501959).
Disclosure of conflict of interest
None.
References
- 1.de la Rocha AM, Sampron N, Alonso MM, Matheu A. Role of SOX family of transcription factors in central nervous system tumors. Am J Cancer Res. 2014;4:312–324. [PMC free article] [PubMed] [Google Scholar]
- 2.Louis DN, Ohgaki H, Wiestler OD, Cavenee WK, Burger PC, Jouvet A, Scheithauer BW, Kleihues P. The 2007 WHO classification of tumours of the central nervous system. Acta Neuropathol. 2007;114:97–109. doi: 10.1007/s00401-007-0243-4. [DOI] [PMC free article] [PubMed] [Google Scholar]
- 3.Stupp R, Hegi ME, Mason WP, van den Bent MJ, Taphoorn MJ, Janzer RC, Ludwin SK, Allgeier A, Fisher B, Belanger K, Hau P, Brandes AA, Gijtenbeek J, Marosi C, Vecht CJ, Mokhtari K, Wesseling P, Villa S, Eisenhauer E, Gorlia T, Weller M, Lacombe D, Cairncross JG, Mirimanoff RO European Organisation for Research and Treatment of Cancer Brain Tumour and Radiation Oncology Groups; National Cancer Institute of Canada Clinical Trials Group. Effects of radiotherapy with concomitant and adjuvant temozolomide versus radiotherapy alone on survival in glioblastoma in a randomised phase III study: 5-year analysis of the EORTC-NCIC trial. Lancet Oncol. 2009;10:459–466. doi: 10.1016/S1470-2045(09)70025-7. [DOI] [PubMed] [Google Scholar]
- 4.Gubbay J, Collignon J, Koopman P, Capel B, Economou A, Munsterberg A, Vivian N, Goodfellow P, Lovell-Badge R. A gene mapping to the sex-determining region of the mouse Y chromosome is a member of a novel family of embryonically expressed genes. Nature. 1990;346:245–250. doi: 10.1038/346245a0. [DOI] [PubMed] [Google Scholar]
- 5.Wagner T, Wirth J, Meyer J, Zabel B, Held M, Zimmer J, Pasantes J, Bricarelli FD, Keutel J, Hustert E, Wolf U, Tommerup N, Schempp W, Scherer G. Autosomal sex reversal and campomelic dysplasia are caused by mutations in and around the SRY-related gene SOX9. Cell. 1994;79:1111–1120. doi: 10.1016/0092-8674(94)90041-8. [DOI] [PubMed] [Google Scholar]
- 6.Foster JW, Dominguez-Steglich MA, Guioli S, Kwok C, Weller PA, Stevanovic M, Weissenbach J, Mansour S, Young ID, Goodfellow PN, et al. Campomelic dysplasia and autosomal sex reversal caused by mutations in an SRY-related gene. Nature. 1994;372:525–530. doi: 10.1038/372525a0. [DOI] [PubMed] [Google Scholar]
- 7.Jiang SS, Fang WT, Hou YH, Huang SF, Yen BL, Chang JL, Li SM, Liu HP, Liu YL, Huang CT, Li YW, Jang TH, Chan SH, Yang SJ, Hsiung CA, Wu CW, Wang LH, Chang IS. Upregulation of SOX9 in lung adenocarcinoma and its involvement in the regulation of cell growth and tumorigenicity. Clin Cancer Res. 2010;16:4363–4373. doi: 10.1158/1078-0432.CCR-10-0138. [DOI] [PubMed] [Google Scholar]
- 8.Capaccione KM, Hong X, Morgan KM, Liu W, Bishop JM, Liu L, Markert E, Deen M, Minerowicz C, Bertino JR, Allen T, Pine SR. Sox9 mediates Notch1-induced mesenchymal features in lung adenocarcinoma. Oncotarget. 2014;5:3636–3650. doi: 10.18632/oncotarget.1970. [DOI] [PMC free article] [PubMed] [Google Scholar]
- 9.Chakravarty G, Rider B, Mondal D. Cytoplasmic compartmentalization of SOX9 abrogates the growth arrest response of breast cancer cells that can be rescued by trichostatin A treatment. Cancer Biol Ther. 2011;11:71–83. doi: 10.4161/cbt.11.1.13952. [DOI] [PubMed] [Google Scholar]
- 10.Matheu A, Collado M, Wise C, Manterola L, Cekaite L, Tye AJ, Canamero M, Bujanda L, Schedl A, Cheah KS, Skotheim RI, Lothe RA, Lopez de Munain A, Briscoe J, Serrano M, Lovell-Badge R. Oncogenicity of the developmental transcription factor Sox9. Cancer Res. 2012;72:1301–1315. doi: 10.1158/0008-5472.CAN-11-3660. [DOI] [PMC free article] [PubMed] [Google Scholar]
- 11.Raspaglio G, Petrillo M, Martinelli E, Li Puma DD, Mariani M, De Donato M, Filippetti F, Mozzetti S, Prislei S, Zannoni GF, Scambia G, Ferlini C. Sox9 and Hif-2alpha regulate TUBB3 gene expression and affect ovarian cancer aggressiveness. Gene. 2014;542:173–181. doi: 10.1016/j.gene.2014.03.037. [DOI] [PubMed] [Google Scholar]
- 12.Thomsen MK, Ambroisine L, Wynn S, Cheah KS, Foster CS, Fisher G, Berney DM, Moller H, Reuter VE, Scardino P, Cuzick J, Ragavan N, Singh PB, Martin FL, Butler CM, Cooper CS, Swain A Transatlantic Prostate Group. SOX9 elevation in the prostate promotes proliferation and cooperates with PTEN loss to drive tumor formation. Cancer Res. 2010;70:979–987. doi: 10.1158/0008-5472.CAN-09-2370. [DOI] [PMC free article] [PubMed] [Google Scholar]
- 13.Wang L, He S, Yuan J, Mao X, Cao Y, Zong J, Tu Y, Zhang Y. Oncogenic role of SOX9 expression in human malignant glioma. Med Oncol. 2012;29:3484–3490. doi: 10.1007/s12032-012-0267-z. [DOI] [PubMed] [Google Scholar]
- 14.Swartling FJ, Ferletta M, Kastemar M, Weiss WA, Westermark B. Cyclic GMP-dependent protein kinase II inhibits cell proliferation, Sox9 expression and Akt phosphorylation in human glioma cell lines. Oncogene. 2009;28:3121–3131. doi: 10.1038/onc.2009.168. [DOI] [PMC free article] [PubMed] [Google Scholar]
- 15.Subramanian A, Tamayo P, Mootha VK, Mukherjee S, Ebert BL, Gillette MA, Paulovich A, Pomeroy SL, Golub TR, Lander ES, Mesirov JP. Gene set enrichment analysis: a knowledge-based approach for interpreting genome-wide expression profiles. Proc Natl Acad Sci U S A. 2005;102:15545–15550. doi: 10.1073/pnas.0506580102. [DOI] [PMC free article] [PubMed] [Google Scholar]
- 16.Sun L, Hui AM, Su Q, Vortmeyer A, Kotliarov Y, Pastorino S, Passaniti A, Menon J, Walling J, Bailey R, Rosenblum M, Mikkelsen T, Fine HA. Neuronal and glioma-derived stem cell factor induces angiogenesis within the brain. Cancer Cell. 2006;9:287–300. doi: 10.1016/j.ccr.2006.03.003. [DOI] [PubMed] [Google Scholar]
- 17.Kawakami Y, Rodriguez-Leon J, Izpisua Belmonte JC. The role of TGFbetas and Sox9 during limb chondrogenesis. Curr Opin Cell Biol. 2006;18:723–729. doi: 10.1016/j.ceb.2006.10.007. [DOI] [PubMed] [Google Scholar]
- 18.Jakob S, Lovell-Badge R. Sex determination and the control of Sox9 expression in mammals. FEBS J. 2011;278:1002–1009. doi: 10.1111/j.1742-4658.2011.08029.x. [DOI] [PubMed] [Google Scholar]
- 19.Belo J, Krishnamurthy M, Oakie A, Wang R. The role of SOX9 transcription factor in pancreatic and duodenal development. Stem Cells Dev. 2013;22:2935–2943. doi: 10.1089/scd.2013.0106. [DOI] [PubMed] [Google Scholar]
- 20.Thomsen MK, Butler CM, Shen MM, Swain A. Sox9 is required for prostate development. Dev Biol. 2008;316:302–311. doi: 10.1016/j.ydbio.2008.01.030. [DOI] [PubMed] [Google Scholar]
- 21.Vandeputte DA, Meije CB, van Dartel M, Leenstra S, IJlst-Keizers H, Das PK, Troost D, Bosch DA, Baas F, Hulsebos TJ. GOA, a novel gene encoding a ring finger B-box coiled-coil protein, is overexpressed in astrocytoma. Biochem Biophys Res Commun. 2001;286:574–579. doi: 10.1006/bbrc.2001.5431. [DOI] [PubMed] [Google Scholar]
- 22.Rani SB, Rathod SS, Karthik S, Kaur N, Muzumdar D, Shiras AS. MiR-145 functions as a tumor-suppressive RNA by targeting Sox9 and adducin 3 in human glioma cells. Neuro Oncol. 2013;15:1302–1316. doi: 10.1093/neuonc/not090. [DOI] [PMC free article] [PubMed] [Google Scholar]
- 23.Cai C, Wang H, He HH, Chen S, He L, Ma F, Mucci L, Wang Q, Fiore C, Sowalsky AG, Loda M, Liu XS, Brown M, Balk SP, Yuan X. ERG induces androgen receptor-mediated regulation of SOX9 in prostate cancer. J Clin Invest. 2013;123:1109–1122. doi: 10.1172/JCI66666. [DOI] [PMC free article] [PubMed] [Google Scholar]
- 24.Wu CL, Zukerberg LR, Ngwu C, Harlow E, Lees JA. In vivo association of E2F and DP family proteins. Mol Cell Biol. 1995;15:2536–2546. doi: 10.1128/mcb.15.5.2536. [DOI] [PMC free article] [PubMed] [Google Scholar]


