

Abstract
Asthma is characterized by leukocytic infiltration and tissue remodeling with structural changes including subepithelial fibrosis and ASM cells proliferation. The Hippo pathway is a key regulatory point involved in cell proliferation, fibroblasts, and smooth muscle cell differentiation. In order to disclose the relation between asthma and the Hippo pathway, expression of the Yes-associated protein (YAP), a key gene in the Hippo pathway, in the bronchial smooth muscle of chronic asthma model (CAM) was studied. 40 mice were randomly divided into control (wide type) and experimental group to construct CAM using chicken ovalbumin (OVA). Pathological changes of the lung tissues were observed in the CAM mice compared with the control using HE staining method. Immunohistochemistry (IHC) was used to detect if YAP protein is expressed in the lung tissues. The pathological changes of the CAM group showed that a large number of inflammatory cells infiltration including mainly lymphocytes and a small amount of eosinophilic, with the presence of certain airway smooth muscle hyperplasia, was observed in comparison with the control. IHC results showed that the YAP protein was significantly increased compared with the control groups (P < 0.01). This result was further confirmed by quantitative real-time PCR (qPCR) assay which detected the up-regulation of the YAP gene (P < 0.01) and Western blot. In conclusion, the YAP protein was significantly expressed in the bronchial airway tissues of the CAM mice, and could be used as an indicator for asthma.
Keywords: Yes-assoeiated protein (YAP), airway smooth muscle (ASM), chronic asthma model (CAM), the Hippo pathway, immunohistochemistry (IHC), quantitative real-time PCR (qPCR)
Introduction
Asthma is a chronic inflammatory disease of the lung characterized by episodic and sometimes persistent airflow obstruction, which causes substantial morbidity and occasional mortality among its sufferers [1]. Over the past 40 years, almost 30 million Americans have asthma. It is the most common cause of missed school days by children. Annually, costs related to asthma care or to lost wages and productivity in the United States exceed $16 billion [1].
Asthma is a complex disorder which involves a combination of genetic and environmental factors [2]. Pathologic manifestations of asthma are associated with tissue remodeling with structural changes including subepithelial fibrosis, epithelial desquamation and smooth muscle hypertrophy/hyperplasia, which often results in infiltration of TH2 lymphocytes, mast cells and eosinophils into asthmatic airways with downstream mediator release and disordered airway function [3-5]. It is well known that airway smooth muscle (ASM) plays a critical role in asthma. Carroll et al. showed that the thickness of the ASM layer in people with clinically mild or moderately severe asthma was less than that in patients who died of asthma and who had clinically severe disease [6]. Furthermore, Johnson et al. showed that ASM cell proliferation was increased in asthma within the bronchial wall of asthmatic patients [7]. These evidences indicate a relationship between asthma severity and ASM area. Since asthma is commonly characterized by eosinophilic infiltration of the airways, eosinophilic disease is a strong predictor of corticosteroid responsiveness in asthmatic patients [8-10]. And eosinophilic infiltration in asthma is typically characterized by the expression of eosinophil-associated TGF-β1 mRNA [11]. Therefore, ASM cell proliferation, increase in eosinophils, and eosinophil-associated TGF-β1 expression are often used as the main indicators for asthma model construction in asthma study.
The Hippo pathway is a key player regulating organ size through its role in the control of cell growth and cell proliferation [12]. Yes-associated protein (YAP) is a downstream target of the Hippo pathway, the nomination of which is according to its interaction with the Src family tyrosine kinase Yes [13]. The Hippo pathway controls cell number by inhibiting cell proliferation and promoting apoptosis through phosphorylation of the transcriptional co-activator YAP in mammal [14]. YAP is the mammalian ortholog of Drosophila Yorkie (Yki), which is negatively regulated in the Hippo signaling pathway, and functions as a transcriptional coactivator to control gene expression involved in the regulation of cell growth, proliferation, and apoptosis [15]. Recent studies found that YAP is involved in the generation and maintenance of cancer-associated fibroblasts [16] vascular smooth muscle cell differentiation [17], Itch-mediated substrate degradation chronic lymphocytic leukemia cells [18]. Robust and persistent acute inflammation was caused by TiO2 particles in pregnant mice, accompanied with differential gene expression including the YAP gene in pregnant lungs exposed to TiO2, which led to increased susceptibility to asthma in their offspring [19]. These clues implying the involvement of YAP in asthma.
Though recent studies found that YAP was involved in asthma, no direct clue that the expression of YAP was related to the progression of asthma. Therefore, in this study we attempted to identify the role of YAP in chronic asthma. We used 40 mice to construct mouse chronic asthma model. This model was first assessed by several indicators of chronic asthma including the numbers of eosinophils, serum IgE and OVA-specific IgE content. Furthermore, Hematoxylin and eosin (HE) staining was conducted to eventually confirm the mouse chronic asthma. Using this mouse chronic asthma, the expression of YAP was detected by Immunohistochemistry (IHC) assay, Quantitative real-time PCR (qPCR) assay and Western blot. We found that YAP is up-regulated in the bronchial airway smooth muscle of the chronic asthma mouse model.
Materials and methods
Chronic asthma model (CAM) construction
40 Mice were randomly divided into the control (wide type mice) and experimental groups. The animals were injected intravenously with 20 µg chicken ovalbumin (OVA) and 2 mg aluminium hydroxide gel. The induced method was according to Matsuoka et al [20]. Twenty-four hours after the last OVA inhalation, mice were anesthetized with sodium pentobarbital, and 10% (v/v) formalin in PBS was infused into the lung for fixation. The lung was then sectioned and stained either with hematoxylin and eosin or with periodic acid-Schiff reagent.
Cell number counting
Cells were collected by centrifuging the bronchoalveolar lavage fluid (BALF) at 1500 r/min for 10 min. Cells were then precipitated by 1mL PBS (0.1 mol/L). Cell numbers were counted by conventional method using a hematocytometer.
IgE content measurement
BALF was collected from wild-type and CAM mice 8 hours after the last inhalation of OVA, and the concentrations of IgE in the fluid were determined by enzyme-linked immunosorbent assay.
Hematoxylin and eosin (HE) staining
Biopsies were fixed in 10% formaldehyde (pH 7.2) and embedded in paraffin blocks. Six micrometer tissue sections were affixed to microscope slides with Le Page’s glue and after deparaffination and rehydration the slides were ready for histology and immunohistochemistry. Hematoxylin and eosin staining (HE) staining was then carried out as previously described [21]. The thickness of the basement membrane was measured on biopsies stained by HE. The thickness of the basement membrane was determined as the average of 6 measurements in sections where the epithelium was properly oriented in order to avoid artefacts in measurement. The shedding was characterized as the percentage of length of basal cells uncovered by columnar cells [22,23]. Toluidine blue staining was carried out using the method report by Pesci and coworkers [24].
Immunohistochemistry (IHC) assay
An immunohistochemical procedure was applied with minor modifications [25]. The frozen sections were thawed, and the tissue was fixed in 3.7% buffered formaldehyde (5 min) followed by acetone (50, 100, and 50%; 2 min each). Then, sections were rehydrated in 0.1 M PBS for 5 min, and unspecific binding was blocked with 1% BSA. Incubation with the primary antibody was performed overnight at 48°C. The sections were washed twice in 0.1 M PBS and incubated with the biotinylated secondary antibody (Dianova) at room temperature for 1 h. After washing, the tissue was incubated with the streptavidin biotin peroxidase complex (Zymed Laboratories, Inc., San Francisco, CA) at room temperature for 1 h, washed again, and incubated in 0.03% wt/vol 3-39 diaminobenzidine (DAB) (Sigma Chemical Co.) with 0.003% vol/vol hydrogen peroxide until a brown reaction product could be seen. To suppress any remaining peroxidase, the slides were incubated in 3% hydrogen peroxide for 30 min. After washing three times, the sections were incubated with the second incubation series consisting of primary and secondary antibodies and streptavidin biotin peroxidase complex exactly as described above. Sections were washed extensively and preincubated for 10 min in 0.01% benzidine dihydrochloride (BDHC) (Sigma) with 0.03% sodium nitroprusside (Sigma). This was followed by incubation in the reaction medium (0.01% BDHC, 0.005% hydrogen peroxide, 0.03% sodium nitroprusside) for the second staining. The formation of the dark blue, granular reaction product was monitored under the light microscope. Afterwards, the sections were dehydrated and mounted in DePex (Fluka, Buchs, Germany).
Quantitative real-time PCR assay
Quantitative real-time PCR was performed with a 7500 Real-Time PCR System (Applied Biosystems, USA) using PrimeScript® RT reagent Kit With gDNA Eraser (which supplies RNase-free DNase I to remove any co-isolated genomic DNA) and SYBR Green PCR Kit (product code: DRR041A and DRR047A, respectively; TaKaRa, China). Primers used for quantitative analysis of YAP expression were YapF (5’-CCCTCACCCTCCCTGAAATCTACAA-3’) and YapR (5’-AGCATTCCACAGGTCCAAGGCAGA-3’), β-actin was amplified using primers ActF (5’-ACCTCACATCCATTCCGCTTTCA-3’) and ActR (5’-ATGCTGTAATTGCCAGACCTCCG-3’) as internal reference. The reaction mix contained 4 μL cDNA, 0.5 μL forward and reverse primer mix (20 μM each), 1 μL of 50 × ROX Reference Dye II and 25 μL 2 × TaKaRa SYBR Green PCR mix in a final volume of 50 μL. All reactions were setup in triplicate and every sample was replicated in parallel three times to ensure statistical relevance. The following standard thermal conditions were used for all PCR reactions: 30 s at 95°C, 40 cycles of 30 s at 95°C and 34 s at 60°C. Primer specificity was confirmed by RT-PCR amplification before quantitative real-time PCR reaction, which produced single amplicons of the expected size for each primer set, these amplicons were sequenced to finally validate their specific amplification. Specificity of quantitative real-time PCR reaction was monitored by the presence of dissociation curves with single peaks and sequencing of its products with unique bands of the expected size. Amplicon dissociation curves were obtained after cycle 40 with default settings suggested by the instrument. Data were analyzed using the SDS software (Applied Biosystems, USA). All quantifications were normalized to the amount of β-actin, the relative abundance of which was determined under salt stress, as internal control.
Western blot analysis
Cell lysates were prepared in RIPA buffer (50 mmol/l Tris-HCl buffer, pH 7.4, 150 mmol/l NaCl, 1% Triton X-100, 1% sodium deoxycholate, and 0.1% sodium dodecyl sulfate) supplemented with 1 × Halt protease inhibitor cocktail and 1 × Halt phosphatase inhibitor cocktail (Pierce, Rockford, IL). A Bio-Rad protein assay (Bio-Rad) was used to determine protein concentrations. Proteins were separated on 10-12% sodium dodecyl sulfate-polyacrylamide gel electrophoresis and transferred to PVDF membranes (Whatman, Boston, MA). Membranes were first hybridized with specific primary antibodies and then with HRP-conjugated secondary antibodies (Cell Signaling Technology). Protein bands were visualized using a commercial Immobilon Western Chemiluminescent HRP Substrate detection reagent (Millipore, Billerica, MA). The chemiluminescence of proteins transferred to PVDF membranes was detected with ECL Plus (GE Healthcare Amersham, Piscataway, NJ). Relative protein expression values were quantitatively determined via densitometry with ImageJ software.
Statistical analysis
All findings were analyzed with statistical software package SPSS 16.0 and Graphpad Prism 5. The results were expressed as means ± SD. The mean was compared by t test or by analysis of variance. The statistical significance of the studies was determined by the parametric unpaired Student’s t test. Differences with P < 0.05 are considered significant. For quantitative realtime PCR analysis, all quantifications were normalized to the amount of β-actin by 2-ΔΔCT method using SDS software.
Results
Eosinophils numbers and OVA-specific IgE in BALF
As Table 1 shown, the numbers of total cells in BALF in the control were 2.45 ± 0.57, while those in CAM significantly (P < 0.01) increased to 15.45 ± 3.52; these were also followed by a significant (P < 0.01) increase of 10.82 ± 2.46 in eosinophils in CAM compared with the control. These results indicated that cell proliferation and inflammation were probably occurred in CAM mice. Along with the increased total cell numbers was the significant increase (P < 0.01) in the content of serum total IgE and OVA-specific IgE in CAM when compared with the control (Table 1). Since asthma is associated with serum IgE and OVA is typically used to induce asthma model [20,26], combining the results of cell numbers and IgE content, we speculated that asthma might occurred in the experimental mice, i.e. the CAM construction was probably successful.
Table 1.
The numbers of eosnophils in BALF (n = 20, × 105/mL) and OVA-specific IgE content (µg/mL)
| Group | Total cells | Eosnophils | Total IgE | OVA-specific IgE |
|---|---|---|---|---|
| CAM | 15.45 ± 3.52 | 10.82 ± 2.46 | 45.89 ± 3.50 | 25.24 ± 1.54 |
| Control | 2.45 ± 0.57 | 0 ± 0 | 5.05 ± 0.81 | 1.92 ± 0.02 |
Histopathological changes
HE staining showed that lots of inflammatory cells infiltrate the bronchus and blood vessel, eosinophils, lymphocyte and ASM hyperplasia could be clearly observed in CAM compared with the control (Figure 1). The appearance of eosinophils and lymphocyte is an indicator of inflammation [27], while ASM hyperplasia typically occurred in asthma [28], therefore, we concluded that the CAM was successfully constructed finally.
Figure 1.
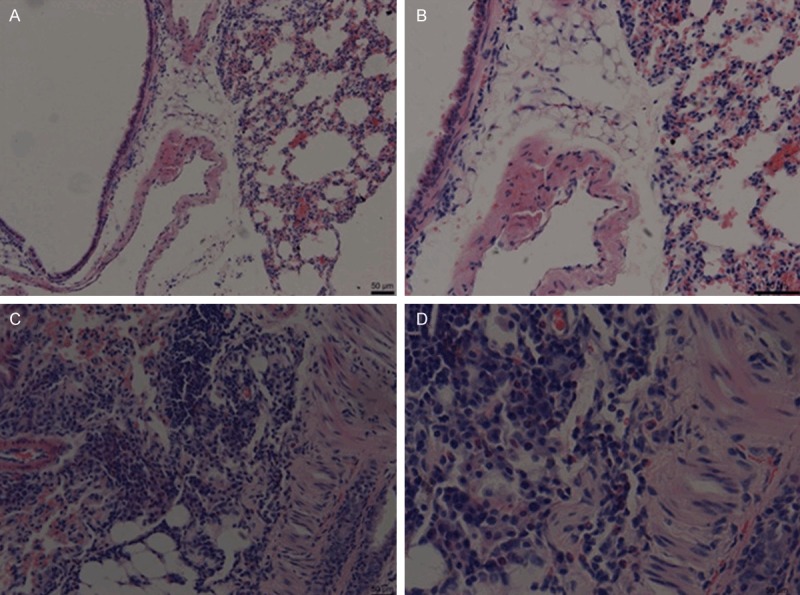
HE staining confirmed CAM construction. A and B. The control (100 × and 200 ×, respectively). C and D. CAM (100 × and 200 ×, respectively).
Induced expression of YAP in airway smooth muscle (ASM)
Immunohistochemical staining showed that no clear staining was observed in the control indicating that neither proliferation of ASM nor expression of YAP was detected (Figure 2A, 2B and 2D); while clear YAP staining was observed in the CAM (Figure 2C). These results were further confirmed by qPCR and Western bolt assay. Approximately 1.931 fold of YAP transcript was quantitated by qPCR compared with the control (Figure 3A); and the band of the CAM was clearly brighter than that of the control by Western blot assay (Figure 3B). Additionally, the increase in YAP expression was accompanied by the proliferation of ASM (Figure 2C). Therefore, we concluded that YAP is up-regulated in the bronchial ASM of the CAM mouse.
Figure 2.
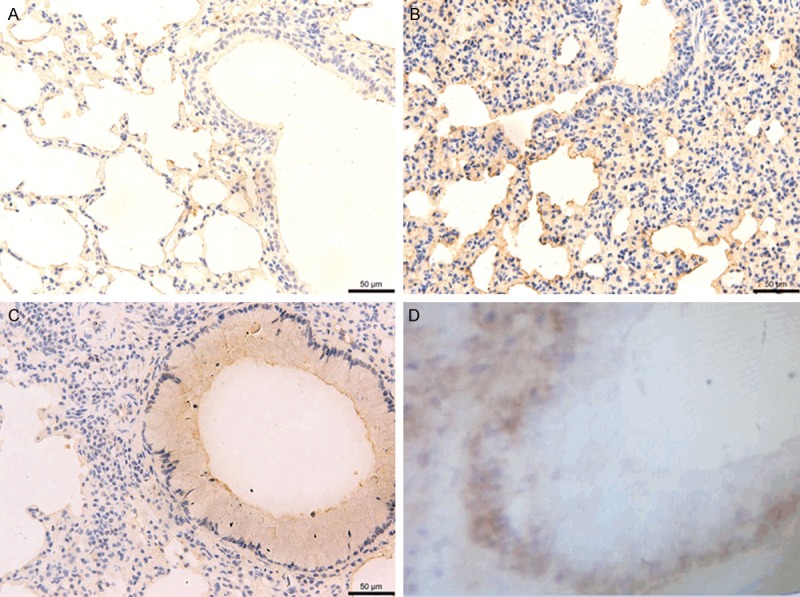
IHC staining of lung tissue sections. No clear YAP expression was detected in the control (A) (100 ×), (B) (200 ×), and (D) (400 ×). While clear IHC staining in the airway smooth muscle (ASM) indicated expression of YAP (C) (400 ×).
Figure 3.
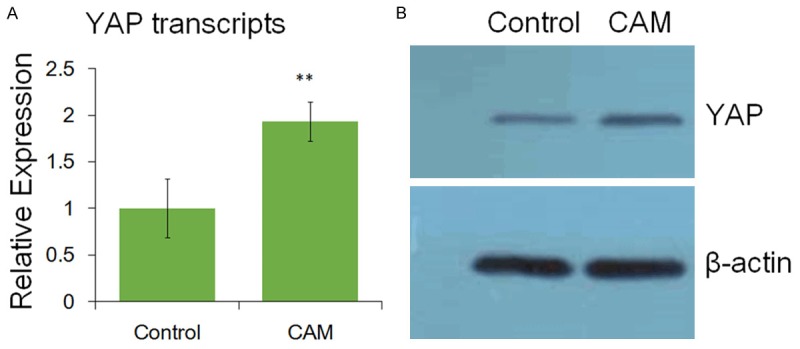
The expression of YAP identified by qPCR and Western blot. **, highly significant (P < 0.01).
Discussion
Asthma is an inflammatory disorder of the lungs associated with airway wall remodeling [29]. It is characterized by airway hyperresponsiveness (AHR) to a variety of specific and nonspecific stimuli, infiltration of both T lymphocytes and eosinophilic leukocytes, elevated serum IgE and OVA-specific IgE, and excessive airway mucus production [30]. Therefore, increased numbers of eosinophils and IgE content (P < 0.01) indicated inflammation occurred in CAM in comparison with the control (Table 1). Through the HE staining, clear changes of eosinophils, lymphocyte and ASM hyperplasia were observed (Figure 1). Therefore, CAM was constructed successfully, and thus was suitable for further assays for YAP expression.
Inflammation of the lower airways is central in the pathogenesis of asthma, which generally shows histologically leukocytic infiltrates consisting of eosinophils, lymphocytes, neutrophils, monocytes, and other cells [31]. Along with this leukocytic infiltration is the tissue remodeling with structural changes including subepithelial fibrosis, smooth muscle hypertrophy, and ASM cells proliferation [6,7]. The Hippo pathway is a key regulatory point responsible for organ size control, and survival and apoptosis of immune cells [12]. It is involved in cell proliferation, fibroblasts, and vascular smooth muscle cell differentiation [16,17]. Therefore, the Hippo pathway might play a role in asthma. As a downstream target, YAP is to be one of the key genes in the Hippo pathway. Recently, using TiO2 particles to treat pregnant mice led to changes in YAP expression and increased the susceptibility to asthma in their offspring [19]. Furthermore, seven genes including the YAP1 in the Hippo pathway were found to be significantly different between asthmatics and non-asthmatics [32]. These evidences strongly implied that YAP1 as a novel gene in the Hippo pathway to play a role in asthma susceptibility.
Our study found that the expression of YAP was up-regulated in CAM using IHC staining (Figure 2), qPCR and Western blot (Figure 3), which was accompanied by inflammation as numbers of eosinophils and IgE content increased in CAM compared to the control (Table 1). These is the direct clue that YAP gene expression increases in mouse asthmatic model. Therefore, the Hippo-YAP pathway plays a key role in asthmatic progress. Additionally, since YAP mRNA level was significant differences (P < 0.01) between the control and the CAM, YAP up-regulation may be used an indicator for asthma.
Conclusion
In this study we firstly constructed mice asthma model (CAM) using chicken ovalbumin (OVA). The construction of CAM was confirmed by several indicators of asthma numbers of total cells and eosinophilic, serum IgE and OVA-specific IgE content, and HE staining. Immunohistochemistry (IHC) assay found up-regulation of YAP protein in the lung tissues of CAM. The pathological changes of the CAM group showed that a large number of inflammatory cells infiltration including mainly lymphocytes and a small amount of eosinophilic, with the presence of certain airway smooth muscle hyperplasia, was observed. YAP protein was significantly increased compared with the control groups (P < 0.01). This result was further confirmed by quantitative real-time PCR (qPCR) assay which detected the up-regulation of the YAP gene. Consequently, YAP protein was significantly expressed in the bronchial airway tissues of the CAM mice, and relevant with the thickness of airway smooth muscle. YAP might be used as an indicator for asthma.
Disclosure of conflict of interest
None.
References
- 1.Hershenson MB, Brown M, Camoretti-Mercado B, Solway J. Airway smooth muscle in asthma. Annu Rev Pathmechdis Mech Dis. 2008;3:523–555. doi: 10.1146/annurev.pathmechdis.1.110304.100213. [DOI] [PubMed] [Google Scholar]
- 2.Holgate ST. The epidemic of allergy and asthma. Nature. 1999;402:2–4. doi: 10.1038/35037000. [DOI] [PubMed] [Google Scholar]
- 3.Dunnill M. The pathology of asthma, with special reference to changes in the bronchial mucosa. J Clin Pathol. 1960;13:27–33. doi: 10.1136/jcp.13.1.27. [DOI] [PMC free article] [PubMed] [Google Scholar]
- 4.Jeffery PK. Comparative morphology of the airways in asthma and chronic obstructive pulmonary disease. Am J Respir Crit Care Med. 1994;150:S6–S13. doi: 10.1164/ajrccm/150.5_Pt_2.S6. [DOI] [PubMed] [Google Scholar]
- 5.Laitinen L, Laitinen A, Haahtela T. Airway mucosal inflammation even in patients with newly diagnosed asthma. Am Rev Respir Dis. 1993;147:697–704. doi: 10.1164/ajrccm/147.3.697. [DOI] [PubMed] [Google Scholar]
- 6.Carroll N, Elliot J, Morton A, James A. The structure of large and small airways in nonfatal and fatal asthma. Am Rev Respir Dis. 1993;147:405–410. doi: 10.1164/ajrccm/147.2.405. [DOI] [PubMed] [Google Scholar]
- 7.Johnson PR, Roth M, Tamm M, Hughes M, Ge Q, King G, Burgess JK, Black JL. Airway smooth muscle cell proliferation is increased in asthma. Am J Respir Crit Care Med. 2001;164:474–477. doi: 10.1164/ajrccm.164.3.2010109. [DOI] [PubMed] [Google Scholar]
- 8.Boulet LP. Effects of steroid therapy on inflammatory cell subtypes in asthma. Thorax. 2010;65:374–376. doi: 10.1136/thx.2009.131391. [DOI] [PubMed] [Google Scholar]
- 9.Green RH, Brightling CE, McKenna S, Hargadon B, Parker D, Bradding P, Wardlaw AJ, Pavord ID. Asthma exacerbations and sputum eosinophil counts: a randomised controlled trial. Lancet. 2002;360:1715–1721. doi: 10.1016/S0140-6736(02)11679-5. [DOI] [PubMed] [Google Scholar]
- 10.Woodruff PG, Modrek B, Choy DF, Jia G, Abbas AR, Ellwanger A, Arron JR, Koth LL, Fahy JV. T-helper type 2–driven inflammation defines major subphenotypes of asthma. Am J Respir Crit Care Med. 2009;180:388–395. doi: 10.1164/rccm.200903-0392OC. [DOI] [PMC free article] [PubMed] [Google Scholar]
- 11.Minshall EM, Leung DY, Martin RJ, Song YL, Cameron L, Ernst P, Hamid Q. Eosinophil-associated TGF-β1 mRNA expression and airways fibrosis in bronchial asthma. Am J Respir Cell Mol Biol. 1997;17:326–333. doi: 10.1165/ajrcmb.17.3.2733. [DOI] [PubMed] [Google Scholar]
- 12.Tumaneng K, Russell RC, Guan KL. Organ size control by Hippo and TOR pathways. Curr Biol. 2012;22:R368–R379. doi: 10.1016/j.cub.2012.03.003. [DOI] [PMC free article] [PubMed] [Google Scholar]
- 13.Sudol M, Bork P, Einbond A, Kastury K, Druck T, Negrini M, Huebner K, Lehman D. Characterization of the mammalian YAP (Yes-associated protein) gene and its role in defining a novel protein module, the WW domain. J Biol Chem. 1995;270:14733–14741. doi: 10.1074/jbc.270.24.14733. [DOI] [PubMed] [Google Scholar]
- 14.Ramos A, Camargo FD. The Hippo signaling pathway and stem cell biology. Trends Cell Biol. 2012;22:339–346. doi: 10.1016/j.tcb.2012.04.006. [DOI] [PMC free article] [PubMed] [Google Scholar]
- 15.Zhao B, Ye X, Yu J, Li L, Li W, Li S, Yu J, Lin JD, Wang CY, Chinnaiyan AM. TEAD mediates YAP-dependent gene induction and growth control. Genes Dev. 2008;22:1962–1971. doi: 10.1101/gad.1664408. [DOI] [PMC free article] [PubMed] [Google Scholar]
- 16.Calvo F, Ege N, Grande-Garcia A, Hooper S, Jenkins RP, Chaudhry SI, Harrington K, Williamson P, Moeendarbary E, Charras G. Mechanotransduction and YAP-dependent matrix remodelling is required for the generation and maintenance of cancer-associated fibroblasts. Nature Cell Biol. 2013;15:637–646. doi: 10.1038/ncb2756. [DOI] [PMC free article] [PubMed] [Google Scholar]
- 17.Owens GK, Kumar MS, Wamhoff BR. Molecular regulation of vascular smooth muscle cell differentiation in development and disease. Physiol Rev. 2004;84:767–801. doi: 10.1152/physrev.00041.2003. [DOI] [PubMed] [Google Scholar]
- 18.Rossi M, Inoue S, Walewska R, Knight RA, Dyer MJ, Cohen GM, Melino G. Caspase cleavage of Itch in chronic lymphocytic leukemia cells. Biochem Biophys Res Commun. 2009;379:659–664. doi: 10.1016/j.bbrc.2008.11.154. [DOI] [PubMed] [Google Scholar]
- 19.Fedulov AV, Leme A, Yang Z, Dahl M, Lim R, Mariani TJ, Kobzik L. Pulmonary exposure to particles during pregnancy causes increased neonatal asthma susceptibility. Am J Respir Cell Mol Biol. 2008;38:57–67. doi: 10.1165/rcmb.2007-0124OC. [DOI] [PMC free article] [PubMed] [Google Scholar]
- 20.Matsuoka T, Hirata M, Tanaka H, Takahashi Y, Murata T, Kabashima K, Sugimoto Y, Kobayashi T, Ushikubi F, Aze Y. Prostaglandin D2 as a mediator of allergic asthma. Science. 2000;287:2013–2017. doi: 10.1126/science.287.5460.2013. [DOI] [PubMed] [Google Scholar]
- 21.Bousquet J, Chanez P, Lacoste JY, Barnéon G, Ghavanian N, Enander I, Venge P, Ahlstedt S, Simony-Lafontaine J, Godard P. Eosinophilic inflammation in asthma. N Engl J Med. 1990;323:1033–1039. doi: 10.1056/NEJM199010113231505. [DOI] [PubMed] [Google Scholar]
- 22.Roisman GL, Lacronique JG, Desmazes-Dufeu N, Carré C, Le Cae A, Dusser DJ. Airway responsiveness to bradykinin is related to eosinophilic inflammation in asthma. Am J Respir Crit Care Med. 1996;153:381–390. doi: 10.1164/ajrccm.153.1.8542147. [DOI] [PubMed] [Google Scholar]
- 23.Demoly P, Chanez P, Pujol J, Gauthier-Rouviere C, Michel F, Godard P, Bousquet J. Fos immunoreactivity assessment on human normal and pathological bronchial biopsies. Respir Med. 1995;89:329–335. doi: 10.1016/0954-6111(95)90003-9. [DOI] [PubMed] [Google Scholar]
- 24.Pesci A, Foresi A, Bertorelli G, Chetta A, Olivieri D, Oliveri D. Histochemical characteristics and degranulation of mast cells in epithelium and lamina propria of bronchial biopsies from asthmatic and normal subjects. Am Rev Respir Dis. 1993;147:684–684. doi: 10.1164/ajrccm/147.3.684. [DOI] [PubMed] [Google Scholar]
- 25.Levey AI, Bolam J, Rye DB, Hallanger A, Demuth RM, Mesulam MM, Wainer BH. A light and electron microscopic procedure for sequential double antigen localization using diaminobenzidine and benzidine dihydrochloride. J Histochem Cytochem. 1986;34:1449–1457. doi: 10.1177/34.11.2430010. [DOI] [PubMed] [Google Scholar]
- 26.Burrows B, Martinez FD, Halonen M, Barbee RA, Cline MG. Association of asthma with serum IgE levels and skin-test reactivity to allergens. New Engl J Med. 1989;320:271–277. doi: 10.1056/NEJM198902023200502. [DOI] [PubMed] [Google Scholar]
- 27.Cheung PF, Wong CK, Lam CW. Molecular mechanisms of cytokine and chemokine release from eosinophils activated by IL-17A, IL-17F, and IL-23: implication for Th17 lymphocytes-mediated allergic inflammation. J Immunol. 2008;180:5625–5635. doi: 10.4049/jimmunol.180.8.5625. [DOI] [PubMed] [Google Scholar]
- 28.Ammit AJ, Panettieri RA Jr. Airway smooth muscle cell hyperplasia: a therapeutic target in airway remodeling in asthma? Prog Cell Cycle Res. 2002;5:49–57. [PubMed] [Google Scholar]
- 29.Bousquet J, Jeffery PK, Busse WW, Johnson M, Vignola AM. Asthma: from bronchoconstriction to airways inflammation and remodeling. Am J Resp Critical Care Med. 2000;161:1720–1745. doi: 10.1164/ajrccm.161.5.9903102. [DOI] [PubMed] [Google Scholar]
- 30.Wills-Karp M. Immunologic basis of antigen-induced airway hyperresponsiveness. Annu Rev Immunol. 1999;17:255–281. doi: 10.1146/annurev.immunol.17.1.255. [DOI] [PubMed] [Google Scholar]
- 31.Randolph DA, Carruthers CJ, Szabo SJ, Murphy KM, Chaplin DD. Modulation of airway inflammation by passive transfer of allergen-specific Th1 and Th2 cells in a mouse model of asthma. J Immunol. 1999;162:2375–2383. [PubMed] [Google Scholar]
- 32.Fodor LE, Ungvári I, Lautner-Csorba O, Szalai C. YAP1 in the hippo pathway influences the risk of asthma. Eur Respir J. 2013;42:P1394. [Google Scholar]