

Abstract
MicroRNAs (miRNAs) are kind of small non-coding RNAs that negatively regulate gene expression at post-transcription level, and those non-coding RNAs appear to play a key role in tumorigenesis. The aim of this study was to investigate the biological role of miR-96 in papillary thyroid carcinoma (PTC) cell lines. We identified miR-96 to be up-regulated in PTC specimens in comparison to matched normal tissues by microRNA microarray and RT-qPCR analysis (P < 0.05). Next, to explore the potential function of miR-96, PTC cell lines K1 and TPC1 were transiently transfected with miR-96 mimics and inhibitor. Successful transfection being confirmed by RT-qPCR. Ectopic expression of miR-96 promoted proliferation and colony formation ability, and inhibited apoptosis of K1 and TPC1 cells, whereas down-regulated expression of miR-96 suppressed those functions when compared with the control cells. According to a computational prediction, FOXO1 maybe a potential target of miR-96. Luciferase assays revealed that miR-96 is directly targeted to both binding sites of FOXO1 3’-untranslated region (3’-UTR) and suppressed the FOXO1 expression, and subsequently inhibited the expression of Bim protein in PTC cells. Moreover, the expression of FOXO1 had an inverse correlation with expression of miR-96 in PTC specimens by RT-qPCR and western blot analysis. The data from the present study demonstrated that miR-96 can promote proliferation, and inhibit apoptosis in PTC cell lines K1 and TPC1, thus miR-96 may play an oncogenic role in PTC by inhibiting the FOXO1 and regulating AKT/FOXO1/Bim pathway, and it may serve as a novel therapeutic target for miRNA-based PTC therapy.
Keywords: miR-96, FOXO1, papillary thyroid carcinoma, K1, TPC1 cells
Introduction
Targeted miRNAs therapy for diseases, including viral infection [1], cancer [2,3], cardiovascular disease [4] and diabetes [5,6], has been a hot area of research. To date, candidate drugs that targeted miR-122 and miR-34, miR-103/107 have entered into the clinical research, indicating that there are broad research prospects and great research value in miRNAs field.
Epidemiologic studies have indicated that the rates of thyroid cancer are on the rise during the last 30 years, and Davies and Welch reported that thyroid cancer nearly tripled from 1975 to 2009 primarily as a result of an increase in papillary thyroid carcinoma (PTC) [7]. PTC is the most common malignant thyroid cancer, and it comprises up to 80% of all thyroid malignancies [8]. To date, surgery is the primary mode of therapy for patients with PTC. Multiple genetic alterations play a key role in the development and progression of thyroid cancer, over-expression of EphB4, EphrinB2 and EGFR [9,10], decreased expression of CPSF2 [11], mutations of p53 [12], BRAF, RAS, PTEN, PI3KCA and TP53 [13], rearrangement of RET/PTC [13] have been observed in thyroid cancer, the precise molecular mechanisms remain poorly understood. Therefore, exploring the mechanisms involved in the development and progression of thyroid cancers is important to find novel targets for effective therapeutic strategies.
MiRNAs are small, ~22 nucleotide, non-protein-coding RNAs that regulate the gene expression post-transcriptionally by binding to mRNA 3’ untranslated region (3’UTR), leading to translational repression or mRNA degradation. MiRNAs have been revealed to be involved in many important biological processes, including cell proliferation, differentiation, apoptosis, cell cycle, malignant transformation and tumorigenesis. Moreover, miRNAs are increasingly recognized as playing important roles in regulating expression of oncogenes or tumor suppressor genes.
miR-96 was found to be highly up-regulated in different kind of tumors, including breast cancer [14], prostate cancer [15], bladder cancer [16], hepatocellular carcinoma [17], similarly, miR-96 was found to be up-regulated in PTC by microarray analysis in 10 pairs of thyroid papillary cancer (PTC) specimens and normal thyroid tissues. However, to date, the biological function of miR-96 in PTC carcinogenesis is still unknown.
FOXO1, as a member of the forkhead box transcription factors, regulates transcription of important regulators of cell cycle and apoptosis, functioning as tumor suppression. Previous evidence has demonstrated that FOXO1 was regulated by miR-96 in many different tumors, including breast cancer [18], prostate cancer [15], Hodgkin lymphomas [19] and bladder cancer [16]. PI3K/AKT pathway is the main regulator of FOXO1 transcriptional activity, meanwhile, the PI3K pathway is frequently activated constitutively during thyroid tumorigenesis [20].
Materials and methods
Patient samples
All patients participating in the study gave their informed consent and protocols were approved by Institutional Ethics Committees of Tongji University (the approval number: SHSY-IEC-pap-15-08). In the present study, 60 paired human PTC specimens and matched normal thyroid tissues were obtained from the Department of Breast and Thyroid Surgery of the Shanghai Tenth People’s Hospital. Samples were immediately snap frozen in liquid nitrogen and stored at -80°C for future protein and RNA isolation. The patient samples were histologically confirmed as PTC by experienced pathologists. None of the PTC patients had received any chemotherapy or radiotherapy prior to surgery.
Cell culture and transfection
The human PTC cell lines TPC1, K1 were obtained from Chinese Academy of Sciences in Shanghai, miR-96 mimics, inhibitors and non-specific miR-negative control (NC) oligos were purchased from GenePharma (Shanghai, China). The TPC1 cells were cultured in RPMI1640 medium (RPMI1640; Gibco, USA) supplemented with 100 U/ml penicillin and 100 μg/ml streptomycin (Enpromise, Hangzhou, China), 10% fetal bovine serum (FBS; Gibco) in a humidified atmosphere at 37°C and 5% CO2. The K1 cells were cultured in Dulbecco’s modified Eagle’s medium (DMEM; Gibco, USA) supplemented with 100 U/ml penicillin and 100 μg/ml streptomycin (Enpromise, Hangzhou, China), 10% fetal bovine serum (FBS; Gibco).
TPC1 and K1 cells were added into each well of a 6-well plate at the beginning cell number of 1×10⁵ and 1.2×10⁵ respectively, and cultured with RPMI1640, DMEM medium without serum and antibiotics, respectively. Cells were transfected with 100 nmol/l miR-96 mimics, inhibitors and their negative control (NC) using lipofectamine 2000 transfection reagents (Invitrogen, USA) according to the manufacturer’s instructions, when TPC1 and K1 cells density reached 30-50%. After 6 h of incubation, RPMI 1640 or DMEM medium was replaced by RPMI1640 or DMEM medium with 10% FBS. After 48-72 h of incubation, cells at approximately 90% confluence were harvested for further analysis.
RNA isolation and reverse transcription-quantitative polymerase chain reaction (RT-qPCR)
For detecting the expression levels of miR-96, miRNAs were extracted from the tissues and cells using the miRcute microRNA isolation kit (Tiangen, Beijing, China) according to the manufacturer’s instructions. The primers of miR-96 and U6 were purchased from GenePharma (Shanghai, China), and U6 was used for normalization.
Briefly, a total 500 ng RNA was used for the initial reverse transcription (RT) reaction using the PrimeScript™ RT-PCR kit in accordance with the manufacturer’s instructions (Takara, Tokyo, Japan). Real-time PCR was performed on 7900HT fast real time-PCR instrument (Applied Biosystems, Singapore). The primers were listed as follow: The primers for miR-96 were as follows: 5’-GTCGTATCCAGTGCAGGGTCCGAGGTATTCGCACTGGATACGACAGCAAA-3’ (specific stem-loop RT primer); 5’-GCCCGCTTTGGCACTAGCACATT-3’ (forward); 5’-GTGCAGGGTCCGAGGT-3’ (reverse). The primers for U6 were as follows: 5’-GTCGTATCCAGTGCAGGGTCCGAGGTGCACTGGATACGACAAAATATGG-3’ (RT primer); 5’-TGCGGGTGCTCGCTTCGGCAGC-3’ (forward); and 5’-CCAGTGCAGG GTCCGAGGT-3’ (reverse). The amplification procedure was performed as follows: 95°C for 5 min, followed by 40 cycles at 95°C for 30 sec, and 65°C for 45 sec. Each sample was replicated three times without RT and template control, threshold cycle (CT) values were analyzed at the end of the PCR. And then the fold-change of miR-96 levels was calculated.
For detection of FOXO1 mRNA expression, total RNA from fresh frozen tissue samples and TPC1 and K1 cell lines was extracted using Trizol reagent (Invitrogen) according to the manufacturer’s instruction. The reverse transcription reaction was performed using the PrimeScript RT-PCR kit according to the manufacturers recommendations (Takara, Tokyo, Japan). And reactions were performed in a total volume of 20 μl using 1 μg total RNA. Real-time quantitative PCR was performed on a 7900 HT Fast RT-PCR instrument using SYBR-Green and the following primers: 5’-AGGGTTAGTGAGCAGGTTACAC-3’ (forward) and 5’-TGCTGCCAAGTCTGACGAAA-3’ (reverse) for FOXO1; 5’-CAGAG CCTCGCCTTTGCC-3’ (forward) and 5’-GTCGCCCACATAGGA ATC-3’ (reverse) for β-actin. Primers were designed to produce an amplicon spanning at least 1 intron. Reactions were performed in a total volume of 20 μl using 1 μl cDNA. The qRT-PCR conditions consisted of an initial 95°C for 3 min, and followed by 40 cycles of 95°C for 3 sec and 60°C for 30 sec. Expression of FOXO1 mRNA was assessed by evaluating CT values. The CT values of the FOXO1 expression was normalized to β-actin. Each sample was run in triplicate. The relative expression was calculated using the relative quantification equation (RQ) = 2-ΔΔCt. Meanwhile, the primer blasting and melting curve was analyzed to ensure the specificity of amplification.
Cell proliferation [3-(4,5-dimethylthiazol-2-yl)-2,5-diphenyltetrazolium bromide (MTT)] assay
Cell proliferation was determined using the MTT method. 24 h after transfection, the TPC1 and K1 cells were plated with 200 μl culture medium in 96-well plates at a density of 500, 1500 cells per well, respectively. Cell viability was evaluated every 24 h for 5 days following the manufacturer’s protocol. Briefly, 20 μl MTT solution (5 mg/ml) (Sigma, USA) was added to each well. And then plates were incubated at 37°C for 4 h. The reaction was stopped by addition of 150 μl DMSO (Sigma, USA), low speed shaking (50 rpm) and incubation for 10 min so that the purple colored precipitates of formazan were dissolved in DMSO. The optical density (OD) of each well was measured using a microplate reader (BioTek) at 490 nm. Each sample was tested with five replicates.
Plate clone formation assay
24 h after transfection, TPC1 and K1 cells were seeded in 6-well plates at 500 cells per well, and were incubated at 37°C for 1 week. The colonies were washed twice with PBS, fixed with 95% ethanol for 10 min and stained with 0.1% crystal violet for 20 min, then the plate was slowly washed three times with water. When the plate was dried, the number of visible colonies was counted and representative colonies were photographed. Each experiment was performed in triplicate.
Western blot analysis
Protein extraction and western blotting analysis were performed according to standard procedures. Briefly, cells were seeded into 6-well plates in a final concentration of 1×10⁵ cells per well, then transfected as described above. 48-72 h after transfection, the total proteins were extracted from cell culture using 80 μl RIPA buffer (Beyotime, Shanghai, China). For extraction of total protein from 20 pairs of PTC samples and their matched normal thyroid tissues, 500 µl RIPA buffer was added into about 50 mg fresh tissues after the tissues were ground. The protein concentrations were quantified using a BCA protein assay kit (Beyotime, Jiangsu, China). To make protein denaturation, total protein were mixed with 5× sodium dodecyl sulfate (SDS) loading buffer (Beyotime, Jiangsu, China) in boiling water for 15 min.
30 μg of protein samples were separated by 8% or 10% sodium dodecyl sulfate polyacrylamide gel electrophoresis (SDS-PAGE) and transferred electrophoretically to 0.45 μm nitrocellulose (NC) membrane (Beyotime, Jiangsu, China). Then the membrane was blocked with 5% fat-free milk for 60 min. Membranes were incubated with the primary antibodies for rabbit-FOXO1, rabbit-Bim (1:500, Proteintech, USA) and mouse-β-actin (1:1000, Cell Signaling Technology) at 4°C overnight. After the membranes were washed three times (10 min each) with PBST, the anti-rabbit or anti-mouse secondary antibodies (1:1000, Epitomics) were incubated with the membranes for 1 hour at room temperature. After three washes (10 min each) with PBST, immunoreactive protein bands were detected with an Odyssey Scanning system (Li-Cor, Lincoln, NE, USA). The target bands intensities were calculated and normalized to β-actinin order to determine relative protein concentration.
Apoptosis assay
Cell apoptosis assay was performed using an Annexin-V-fluorescein isothiocyanate (FITC) staining kit (BD Biosciences, San Diego, CA, USA). 24 h after transfected with miR-96 mimics, inhibitor and NC (100 nmol/l), the TPC1 and K1 cells were treated with 10 mmol/l 5-fluoro-2,4 (1H, 3H)-pyrimidinedione (5-FU) (Xudonghaipu, Shanghai) for 36 h. The medium and the trypsinized (without EDTA) cells were collected in a centrifuge tube, the cells were washed with PBS and centrifuged at 1200 rpm for 5 min. Subsequently, cells were double-stained with fluorescein (FITC)-conjugated Annexin V and propidium iodide (FITC-Annexin V/PI) according to manufacturer’s instruction, and then the rate of cell apoptosis were analyzed by flow cytometry (BD, Biosciences).
Luciferase reporter gene assay
TPC1 cells were seeded into 48-well plates at a final density of 3×10⁴ cells per well and cultured until the cells grown to 80% confluence. Cells were transfected with psiCHECK-2/FOXO1 3’-UTR (40 ng), miR-96 mimics or negative control (100 nmol/l) using lipofectamine 2000 (Invitrogen), according to the manufacturer’s instructions. 30 h after transfection, luciferase assay was performed using the Dual-Luciferase Reporter assay kit (Promega, USA). Briefly, the cells were washed three times with PBS and detached with a scraper, total protein was extracted with passive lysis buffer, then 30 μl of total protein per well were added into 48-well plates. Renilla luciferase as an internal control for transfection efficiency. Friefly luciferase activity was normalized to renilla luciferase activity for each transfected well. Each assay was replicated 4 times and results are shown as average of three independent assays.
Statistical analysis
Statistical analyses were performed with GraphPad Prism version 6.0 (GraphPad, San Diego, CA, USA) or SPSS 20.0 (IBM, Somers, NY). Data are presented as the mean ± standard error of the mean (SEM) from at least three independent assays. The Student’s t-test (Double-tailed) or One-way ANOVA was used to draw a comparison between groups. P value < 0.05 was considered to be statistically significant.
Results
MiR-96 expression is increased in papillary thyroid carcinoma (PTC) tissues
Extracted miRNA microarray data was normalized using a median normalization method. The fold change (FC) of miRNAs were calculated by comparing human PTC specimens with matched normal thyroid tissues. We identified 158 miRNAs with expression levels that differed significantly between PTC samples and their matched normal thyroid tissues. The detail was described by Li et al [21]. Among them, we found that the expression of miR-96 was significantly up-regulated in PTC tissues (FC = 5.45, P < 0.01). Then we conducted real-time PCR to measure miR-96 expression levels in 10 paired PTC specimens and adjacent normal thyroid tissues in order to verify the result of miRNA microarray, the results showed that the expression level of miR-96 is significantly increased in PTC tissues compared with their matched normal thyroid tissues (Figure 1A), (*P < 0.05; **P < 0.01; ***P < 0.001; ***P < 0.001).
Figure 1.
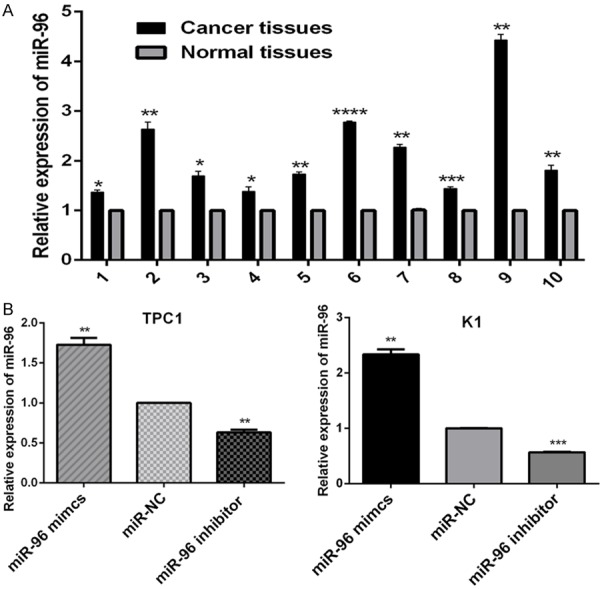
The relative expression of miR-96. A. Relative expression of miR-96 in ten, randomly picked, paired PTC samples (Cancer tissues) and matched normal thyroid tissues (Normal tissues). The graph represents the 2-ΔΔCt values ± SEM. *P < 0.05; **P < 0.01; ***P < 0.001; ***P < 0.001 (two tailed t test). B. 24 hours after transfected with miR-96 mimics, inhibitor and NC (100 nmol/l), the relative expression of miR-96 in PTC cell lines K1 and TPC1 was analyzed by RT-qPCR. The graph represents the 2-ΔΔCt values ± SEM. **P < 0.01; ***P < 0.001 (two tailed t test). SEM, standard error of the mean.
Expression of FOXO1 is down-regulated in PTC samples
The qRT-PCR and western blot analysis were conducted to analyze the expression of FOXO1 at the mRNA and protein levels in PTC samples and their matched normal thyroid tissues, respectively. As shown in Figure 2A, the expression of FOXO1 mRNA is significantly lower in 30 randomly selected PTC samples compared with their matched normal thyroid tissues (***P < 0.001). And also, FOXO1 protein expression was observed in 20 cases of PTC samples and their matched normal thyroid tissues, with varying band density. We noted a trend of lower band density in PTC samples compared to matched bands in normal thyroid tissues. Figure 2B shows four representative cases of PTC (C) with matched normal thyroid tissues (N), depicting decreased FOXO1 protein in PTC compared to matched normal thyroid tissues (Figure 2C), (*P < 0.05; **P < 0.01). Therefore, it was confirmed that the expression of FOXO1 is significantly decreased in PTC samples.
Figure 2.
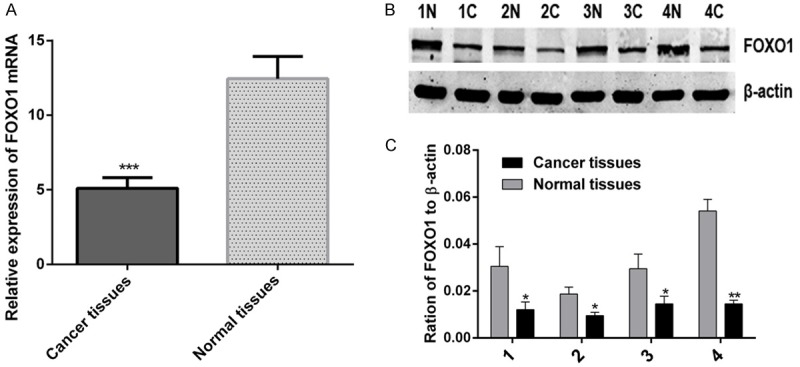
The expression of FOXO1 is down-regulated in papillary thyroid carcinoma (PTC) samples. A. The relative expression of FOXO1 mRNA in 30 paired PTC samples (Cancer tissues) and matched normal thyroid tissues (Normal tissues), the graph represents the 2-ΔΔCt values ± SEM, ***P < 0.001, (paired t test, two tailed). B. Western blot analysis of FOXO1 protein in four, randomly picked, paired PTC samples (C) and normal thyroid tissues (N), β-actin was used as a loading control. C. The graph shows the mean ± SEM of FOXO1 protein levels relative to their respective loading controls. Quantitative analysis was conducted by measuring the IDV of protein bands. *P < 0.05; **P < 0.01 (paired t test, two tailed). SEM, standard error of the mean; IDV, integrated density value.
MiR-96 may regulate the FOXO1 expression by activating the Akt/FOXO1/Bim pathway in papillary thyroid carcinoma cells
TPC1 and K1 cells were transfected with miR-96 inhibitor, mimics and NC (100 nmol/l) using lipofectamine 2000. As shown in Figure 1B, the TPC1 and K1 cells were successfully transfected with the miR-96 inhibitor and mimics (**P < 0.01; ***P < 0.001). To determine the effect of miR-96 inhibitor and mimics on the expression levels of FOXO1 by qRT-PCR and western blot analysis. The results of qRT-PCR showed that miR-96 inhibitors led to increased expression of endogenous FOXO1 mRNA in TPC1 and K1 cells (Figure 3A), (**P < 0.01; ***P < 0.001), similarly, as shown in Figure 3B, the results of western blot analysis indicated that FOXO1 protein expression of TPC1 and K1 cells was significantly upregulated by transfection with miR-96 inhibitors (Figure 3C), (**P < 0.01; ***P < 0.001). Additionally, the expression of FOXO1 in TPC1 and K1 cells was down-regulated both at mRNA and protein levels by transfection with miR-96 mimics. Therefore, it was confirmed that the miR-96 can effectively reduce the expression level of FOXO1 gene in PTC cells.
Figure 3.

72 hours after transfected with miR-96 mimics, inhibitor and NC (100 nmol/l), the relative expression of FOXO1and Bim in PTC cell lines K1 and TPC1. A. The relative expression of FOXO1 mRNA in K1and TPC1 cells, which was analyzed by RT-qPCR. The graph represents the 2-ΔΔCt values ± SEM, **P < 0.01; ***P < 0.001 (two tailed t test). B. The relative expression of FOXO1 and Bim protein in K1 and TPC1 cells, which analyzed by western blot analysis. β-actin was used as a loading control. C. The graph shows the mean ±SEM of FOXO1 and Bim protein levels relative to their respective loading controls. Quantitative analysis was conducted by measuring the IDV of protein bands. *P < 0.05; **P < 0.01 (two tailed t test). NC; negative control; SEM, standard error of the mean; IDV, integrated density value.
To confirm if the expression changes of miR-96 may alter downstream AKT/FOXO1 signaling in human PTC cells, we analyzed the expression changes of Bim protein, a downstream signaling of FOXO1 in AKT/FOXO1 pathway, in TPC1 and K1 cells by transfection with miR-96 mimics, inhibitor and NC (100 nmol/l). We found the expression of Bim protein in TPC1 and K1 cells was decreased by exogenous up-regulation of miR-96, in addition, up-regulation of Bim protein in TPC1 and K1 cells was obtained by transfection with miR-96 inhibitor. The results indicated that the activity of FOXO1 maybe affect the expression of Bim (Figure 3B and 3C), (*P < 0.05; **P < 0. 01), thus miR-96 may regulate the FOXO1 expression by activating the AKT/FOXO1/Bim pathway in PTC cells.
Cell proliferation and colony formation ability of PTC cells were promoted by miR-96
The effect of miR-96 on PTC cells proliferation was analyzed by MTT assay. TPC1 and K1 cells were transfected with 100 nmol/l miR-96 mimics, inhibitor and NC. The proliferation ability of transfected cells was measured and compared with that of NC at 24, 48, 72, 96 and 120 h post-transfection. The increased or inhibited growth rate was calculated as following: inhibited growth rate (%) = (OD value of the control group-OD value of experimental group)/OD value of control group ×100%; increased growth rate (%) = (OD value of experimental group-OD value of the control group)/OD value of control group ×100%. 120 h after transfection, the increased growth rate of miR-96 mimics reached 49.91 ± 12.07% in TPC1 cells and 25.70 ± 4.81% in K1 cells, and the inhibited growth rate of miR-96 inhibitors reached 19.48 ± 3.68% in TPC1 cells and 19.25 ± 2.3% in K1 cells. As shown in Figure 4, up-regulation of miR-96 significantly promoted the proliferation of K1and TPC1 cells, conversely, down-regulation of miR-96 inhibited the cells proliferation (**P < 0.01; ***P < 0.001).
Figure 4.

Over-expression of miR-96 promotes proliferation of TPC1 (A) and K1 (B) cells, which was measured by MTT assays. However, inhibition of miR-96 suppressed cell proliferation. The proliferation of TPC1 (A) andK1 (B) cells transfected with miR-96 mimics or inhibitor (100 nmol/l) was examined at various time points and compared with that of the NC groups. The graph represents OD 490 ± SEM nm; **P < 0.01; ***P < 0.001 (two tailed t test). NC, negative control; OD, optical density; SEM, standard error of the mean.
The effect of miR-96 on the colony forming ability of PTC cells was evaluated by performing colony formation assay. TPC1 and K1 cells were transfected with miR-96 inhibitor, mimics and NC (100 nmol/l). As shown in Figure 5, the clone formation rate of miR-96 mimics transfected groups (197 ± 14.47) were significantly higher than NC groups (128.3 ± 6.33) in TPC1 cells (*P < 0.05), however, miR-96 inhibitor transfected groups (59.67 ± 13.87) were significantly lower compared with NC groups (128.3 ± 6.33) (*P < 0.05). The similar results were achieved in K1 cells. These findings indicate that up-regulation of miR-96 may play a promotive role in thyroid cancer cells in vitro.
Figure 5.
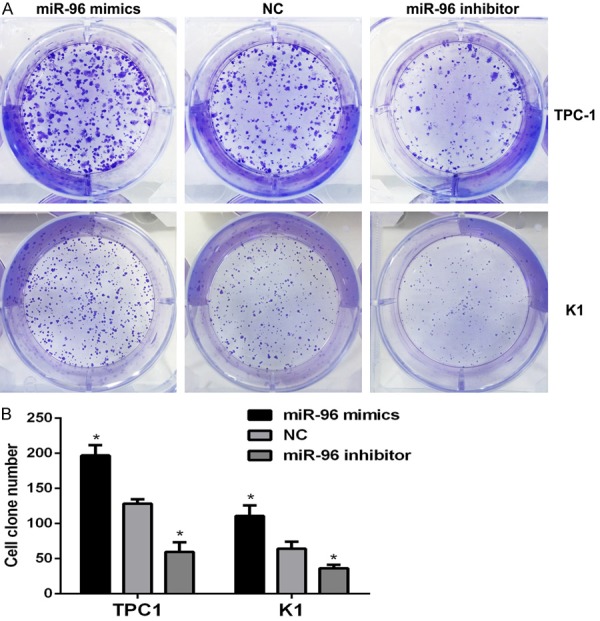
Over-expression of miR-96 promotes colony formation ability of TPC1 and K1 cells. A. Representative images of crystal violet-stained colonies in the TPC1 and K1 cells. B. The graph represents mean ± SEM of the clone number of TPC1 and K1 cells; *P < 0.05 (two tailed t test). NC, negative control; SEM, standard error of the mean.
MiR-96 inhibits PTC cells apoptosis in vitro
To investigate the biological significance of miR-96 in apoptosis of PTC cells in vitro, we performed apoptosis assay with TPC1 and K1 cells. TPC1 and K1 cells were transfected with 100 nmol/l miR-96 inhibitor, mimics and NC. 24 hours after transfection, the 5-FU (10 mmol/l) was used to induce the cell apoptosis, the apoptosis were measured by flow cytometry after treated with 5-FU for 36 hours, the results demonstrated that up-regulation of miR-96 decreased apoptosis of K1 and TPC1 cells compared with their respective NC. In contrast, the percentage of apoptotic cells was promoted by inhibiting the expression of miR-96 (Figure 6), (**P < 0.01; ***P < 0.001). These results indicated that up-regulation of miR-96 inhibited papillary thyroid carcinoma cells apoptosis in vitro.
Figure 6.

Effect of miR-96 on apoptosis of TPC1 and K1 cells. 24 hours after transfected with miR-96 mimics, inhibitor and NC (100 nmol/l), the apoptosis of TPC1 and K1 cells was induced by 5-FU (10 mmol/l) for 36 h, then measured by flow cytometry. The respective proportions of Q1, Q2+Q4, and Q3 are shown, Q2+Q4 represents mean ± SEM of cell apoptosis (%), **P < 0.01 (TPC1); ***P < 0.001 (K1), One-way ANOVA. NC, negative control; 5-FU, 5-fluoro-2,4 (1H, 3H)-pyrimidinedione; SEM, standard error of the mean; PI, propidium iodide; FITC, fluorescein isothiocyanate.
FOXO1 is a direct target of miR-96
To verify the possibility of FOXO1 as the target of miR-96, we performed search on several online databases, including targetscan, miRanda, miR-Base. According to a computational prediction, there were two potential binding sites of miR-96 on FOXO1 3’UTR (Figure 7A). Among them, miR-96/site 1 (probability of conserved targeting, PCT = 0.94) is highly conserved, while miR-96/site 2 (PCT < 0.1) is not. We constructed a psiCHECK-2/FOXO1 3’-UTR vector, which contained the renilla luciferase (RL) gene and the 3’-UTR region of FOXO1. Luciferase reporter assays were performed to measure whether these sites could directly mediate the suppression of FOXO1 expression. The luciferase activity was analyzed after co-transfection of psiCHECK-2/FOXO1 3’UTR together with miR-96 mimics or NC into TPC1 cells.
Figure 7.
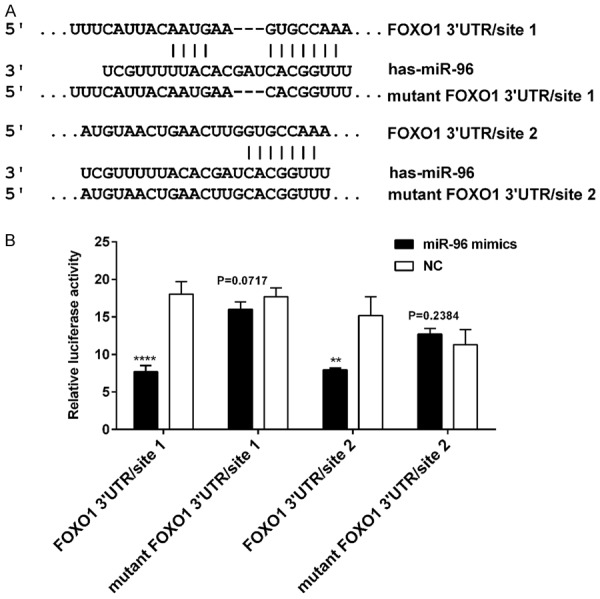
FOXO1 is a direct target of miR-96. A. The two binding sites for miR-96 on FOXO1 mRNA 3’-UTR. B. The relative luciferase activity (FL/RL) was measured in TPC1 cells after co-transfection of the FOXO1 3’-UTR or FOXO1 3’-UTR mutant luciferase construct with either miR-96 mimics or NC (100 nmol/l). Significant decrease of relative Luciferase activity was observed when miR-96 mimics and vectors containing FOXO1 3’-UTR site 1 or site 2 were co-transfected. Co-transfection with NC and vectors containing binding sites were used as controls. **P < 0.01; ****P < 0.0001 (two tailed t test). FOXO1, Forkhead box O 1; 3’-UTR, 3’-untranslated region; FL: firefly luciferase; RL: renilla luciferase; NC, negative control.
As shown in Figure 7B, when site 1 and site 2 were both intact, the luciferase activity was significantly decreased in miR-96 group/site 1 (co-transfection of psiCHECK-2/FOXO1 3’-UTR site 1 with miR-96 mimics) compared with the NC group/site 1 (co-transfection of psiCHECK-2/FOXO1 3’-UTR site 1 with mimics NC) (****P < 0.0001), and similar result was obtained in miR-96 group/site 2 compared with the NC group/site 2 (**P < 0.01). Meanwhile, site 1 alone mediated 57.3% reduction of luciferase activity in miR-96 group compared with the NC group, site 2 alone mediated 42.7% reduction of luciferase activity in miR-96 group compared with the NC group. Suggesting that the site 1 showed more affinity to miR-96 than the site 2 while both sites displayed some synergic effect. However, the effect of miR-96 was abolished in miR-96 group/mutant site 1 (co-transfection of psiCHECK-2/FOXO1 3’-UTR mutant site 1 with miR-96 mimics) (P > 0.05) and miR-96 group/mutant site 2 (P > 0.05). Taken together, FOXO1 may be the direct target of miR-96 in vitro. Additionally, qPCR and western blot analysis showed that up-regulation of miR-96 in K1 and TPC1 cells significantly decreased FOXO1 expression at both mRNA and protein levels when compared with their respective NC, and the results were reversed when cells transfected with miR-96 inhibitor (Figure 3). These results further demonstrate that FOXO1 is a target of miR-96.
Discussion
In recent years, miRNAs have been found to play an important role in the development of diverse diseases, including cancer. As reported in previous studies, several miRNAs have been found to play an important role in tumorigenesis of human PTC due to their over-expression in tumor tissues, which includes miR-221and miR-222 [22], miR-146a and miR-146b [23]. According to the results of miRNA microarray and qRT-PCR, we found that the expression of miR-96 was up-regulated in PTC tissues compared with matched normal thyroid tissues. Similar findings have been reported in several other cancer types [14-17,24]. Furthermore, up-regulation of miR-96 expression has been shown to promote cell proliferation and suppress cell apoptosis by targeting the FOXO1 genes in both LNCaP and DU145 prostate cancer cells [24].
In this study, we examined the role of miR-96 in carcinogenesis of human PTC cells. MiR-96 mimics and miR-96 inhibitor were transfected into human PTC cell lines K1 and TPC1, in order to generate its over-expression and down-expression, respectively. The exogenous up-regulation of miR-96 significantly promoted proliferation, colony formation ability of K1 and TPC1 cells, the apoptosis of K1 and TPC1 cells induced by 5-FU was decreased. Moreover, reverse results were obtained by exogenous down-regulation of miR-96. Suggesting that the expression of miR-96 is associated with the development of human PTC, and that it may function as a tumor promoter. To identify the putative targets of miR-96 is critical for understanding these functions of miR-96 in tumorigenesis. According to several online databases, we found that the 3’-UTR of FOXO1 contains two binding sites for miR-96.
Forkhead box protein O1 (FOXO1) has been shown to play key roles in the regulation of diverse cellular processes, including cell proliferation, differentiation, cell cycle progression and apoptosis [20,25]. In human PTC samples, we found that the expression of FOXO1 both at mRNA and protein levels were decreased in PTC samples compared with the matched non-tumor thyroid tissues. Consistent with the previous study reported by Zaballos et al [20]. These data indicate that FOXO1 is a key tumor suppressor for thyroid malignancies. FOXO1, as a direct target of miR-96, has been reported in numerous diseases [15,16,18,19]. To confirm whether FOXO1 is a real target of miR-96, we constructed the psiCHECK-2/FOXO1 3’-UTR plasmid, which contains the 3’-UTR of FOXO1. Based on the results of luciferase reporter assay, we identified FOXO1 as a direct target of miR-96 in TPC1 cells. Moreover, after transfection of TPC1 and K1 cells with miR-96 inhibitor, the expression of FOXO1 mRNA and protein levels were both increased compared with the negative control. And conversely, after transfection of TPC1 and K1 cells with miR-96 mimics, the opposite results can be obtained. Thus, further suggesting that FOXO1 is a novel direct target of miR-96. Furthermore, the expression changes of FOXO1 in TPC1 and K1 cells maybe alter the activity of Bim, which is a downstream PI3K/AKT/FOXO1 signaling. Therefore, miR-96 may contribute to the oncogenesis of PTC by inhibiting the FOXO1 and regulating AKT/FOXO1/Bim pathway.
In conclusion, we demonstrated that the miR-96 was upregulated in human PTC samples, and miR-96 promoted the proliferation, colony formation ability, and inhibited the cell apoptosis of papillary thyroid carcinoma cells in vitro by targeting FOXO1, therefore, the tumorigenesis of human PTC may be partly due to the over-expression of miR-96 to inhibit the expression of FOXO1 and downstream AKT/FOXO1/Bim signaling, indicating that miR-96 may be a potential diagnostic and therapeutic target for human PTC.
Acknowledgements
This work was supported by grants from National Natural Science Foundation of China (No. 82172240).
Disclosure of conflict of interest
None.
References
- 1.Ottosen S, Parsley TB, Yang L, Zeh K, Van Doorn LJ, Van Der Veer E, Raney AK, Hodges MR, Patick AK. In vitro antiviral activity and preclinical and clinical resistance profile of miravirsen, a novel anti-hepatitis C virus therapeutic targeting the human factor miR-122. Antimicrob Agents Chemother. 2015;59:599–608. doi: 10.1128/AAC.04220-14. [DOI] [PMC free article] [PubMed] [Google Scholar]
- 2.Xue W, Dahlman JE, Tammela T, Khan OF, Sood S, Dave A, Cai W, Chirino LM, Yang GR, Bronson R, Crowley DG, Sahay G, Schroeder A, Langer R, Anderson DG, Jacks T. Small RNA combination therapy for lung cancer. Proc Natl Acad Sci U S A. 2014;111:E3553–3561. doi: 10.1073/pnas.1412686111. [DOI] [PMC free article] [PubMed] [Google Scholar]
- 3.Stahlhut C, Slack FJ. Combinatorial Action of MicroRNAs let-7 and miR-34 Effectively Synergizes with Erlotinib to Suppress Non-small Cell Lung Cancer Cell Proliferation. Cell Cycle. 2015;14:2171–2180. doi: 10.1080/15384101.2014.1003008. [DOI] [PMC free article] [PubMed] [Google Scholar]
- 4.Romaine SP, Tomaszewski M, Condorelli G, Samani NJ. MicroRNAs in cardiovascular disease: an introduction for clinicians. Heart. 2015;101:921–928. doi: 10.1136/heartjnl-2013-305402. [DOI] [PMC free article] [PubMed] [Google Scholar]
- 5.Trajkovski M, Hausser J, Soutschek J, Bhat B, Akin A, Zavolan M, Heim MH, Stoffel M. MicroRNAs 103 and 107 regulate insulin sensitivity. Nature. 2011;474:649–653. doi: 10.1038/nature10112. [DOI] [PubMed] [Google Scholar]
- 6.Costa PM, Cardoso AL, Custodia C, Cunha P, Pereira De Almeida L, Pedroso De Lima MC. MiRNA-21 silencing mediated by tumor-targeted nanoparticles combined with sunitinib: a new multimodal gene therapy approach for glioblastoma. J Control Release. 2015;207:31–39. doi: 10.1016/j.jconrel.2015.04.002. [DOI] [PubMed] [Google Scholar]
- 7.Davies L, Welch HG. Current thyroid cancer trends in the United States. JAMA Otolaryngol Head Neck Surg. 2014;140:317–322. doi: 10.1001/jamaoto.2014.1. [DOI] [PubMed] [Google Scholar]
- 8.Lloyd RV, Buehler D, Khanafshar E. Papillary thyroid carcinoma variants. Head Neck Pathol. 2011;5:51–56. doi: 10.1007/s12105-010-0236-9. [DOI] [PMC free article] [PubMed] [Google Scholar]
- 9.Sharma GK, Dhillon VK, Masood R, Maceri DR. Overexpression of EphB4, EphrinB2, and epidermal growth factor receptor in papillary thyroid carcinoma: A pilot study. Head Neck. 2015;37:964–969. doi: 10.1002/hed.23694. [DOI] [PubMed] [Google Scholar]
- 10.Asmis LM, Gerber H, Kaempf J, Studer H. Epidermal growth factor stimulates cell proliferation and inhibits iodide uptake of FRTL-5 cells in vitro. J Endocrinol. 1995;145:513–520. doi: 10.1677/joe.0.1450513. [DOI] [PubMed] [Google Scholar]
- 11.Nilubol N, Boufraqech M, Zhang L, Kebebew E. Loss of CPSF2 expression is associated with increased thyroid cancer cellular invasion and cancer stem cell population, and more aggressive disease. J Clin Endocrinol Metab. 2014;99:E1173–1182. doi: 10.1210/jc.2013-4140. [DOI] [PMC free article] [PubMed] [Google Scholar]
- 12.Farid NR. P53 mutations in thyroid carcinoma: tidings from an old foe. J Endocrinol Invest. 2001;24:536–545. doi: 10.1007/BF03343889. [DOI] [PubMed] [Google Scholar]
- 13.Guerra A, Di Crescenzo V, Garzi A, Cinelli M, Carlomagno C, Tonacchera M, Zeppa P, Vitale M. Genetic mutations in the treatment of anaplastic thyroid cancer: a systematic review. BMC Surg. 2013;13(Suppl 2):S44. doi: 10.1186/1471-2482-13-S2-S44. [DOI] [PMC free article] [PubMed] [Google Scholar]
- 14.Zhang J, Kong X, Li J, Luo Q, Li X, Shen L, Chen L, Fang L. miR-96 promotes tumor proliferation and invasion by targeting RECK in breast cancer. Oncol Rep. 2014;31:1357–1363. doi: 10.3892/or.2013.2934. [DOI] [PubMed] [Google Scholar]
- 15.Haflidadottir BS, Larne O, Martin M, Persson M, Edsjo A, Bjartell A, Ceder Y. Upregulation of miR-96 enhances cellular proliferation of prostate cancer cells through FOXO1. PLoS One. 2013;8:e72400. doi: 10.1371/journal.pone.0072400. [DOI] [PMC free article] [PubMed] [Google Scholar]
- 16.Guo Y, Liu H, Zhang H, Shang C, Song Y. miR-96 regulates FOXO1-mediated cell apoptosis in bladder cancer. Oncol Lett. 2012;4:561–565. doi: 10.3892/ol.2012.775. [DOI] [PMC free article] [PubMed] [Google Scholar]
- 17.Xu D, He X, Chang Y, Xu C, Jiang X, Sun S, Lin J. Inhibition of miR-96 expression reduces cell proliferation and clonogenicity of HepG2 hepatoma cells. Oncol Rep. 2013;29:653–661. doi: 10.3892/or.2012.2138. [DOI] [PubMed] [Google Scholar]
- 18.Guttilla IK, White BA. Coordinate regulation of FOXO1 by miR-27a, miR-96, and miR-182 in breast cancer cells. J Biol Chem. 2009;284:23204–23216. doi: 10.1074/jbc.M109.031427. [DOI] [PMC free article] [PubMed] [Google Scholar]
- 19.Xie L, Ushmorov A, Leithauser F, Guan H, Steidl C, Farbinger J, Pelzer C, Vogel MJ, Maier HJ, Gascoyne RD, Moller P, Wirth T. FOXO1 is a tumor suppressor in classical Hodgkin lymphoma. Blood. 2012;119:3503–3511. doi: 10.1182/blood-2011-09-381905. [DOI] [PubMed] [Google Scholar]
- 20.Zaballos MA, Santisteban P. FOXO1 controls thyroid cell proliferation in response to TSH and IGF-I and is involved in thyroid tumorigenesis. Mol Endocrinol. 2013;27:50–62. doi: 10.1210/me.2012-1032. [DOI] [PMC free article] [PubMed] [Google Scholar]
- 21.Li D, Jian W, Wei C, Song H, Gu Y, Luo Y, Fang L. Down-regulation of miR-181b promotes apoptosis by targeting CYLD in thyroid papillary cancer. Int J Clin Exp Pathol. 2014;7:7672–7680. [PMC free article] [PubMed] [Google Scholar]
- 22.Visone R, Russo L, Pallante P, De Martino I, Ferraro A, Leone V, Borbone E, Petrocca F, Alder H, Croce CM, Fusco A. MicroRNAs (miR)-221 and miR-222, both overexpressed in human thyroid papillary carcinomas, regulate p27Kip1 protein levels and cell cycle. Endocr Relat Cancer. 2007;14:791–798. doi: 10.1677/ERC-07-0129. [DOI] [PubMed] [Google Scholar]
- 23.Sun M, Fang S, Li W, Li C, Wang L, Wang F, Wang Y. Associations of miR-146a and miR-146b expression and clinical characteristics in papillary thyroid carcinoma. Cancer Biomark. 2015;15:33–40. doi: 10.3233/CBM-140431. [DOI] [PMC free article] [PubMed] [Google Scholar]
- 24.Fendler A, Jung M, Stephan C, Erbersdobler A, Jung K, Yousef GM. The antiapoptotic function of miR-96 in prostate cancer by inhibition of FOXO1. PLoS One. 2013;8:e80807. doi: 10.1371/journal.pone.0080807. [DOI] [PMC free article] [PubMed] [Google Scholar]
- 25.Yu JJ, Wu YX, Zhao FJ, Xia SJ. miR-96 promotes cell proliferation and clonogenicity by down-regulating of FOXO1 in prostate cancer cells. Med Oncol. 2014;31:910. doi: 10.1007/s12032-014-0910-y. [DOI] [PubMed] [Google Scholar]