

Abstract
Metastasis is the main cause of cancer-related deaths and remains the most significant challenge to management of the disease. Metastases are established through a complex multistep process involving intracellular signaling pathways. To gain insight to proteins central to specific steps in metastasis formation, we used a metastasis cell line model that allows investigation of extravasation and colonization of circulating cancer cells to lungs in mice. Using stable isotopic labeling by amino acids in cell culture and subcellular fractionation, the nuclear, cytosol, and mitochondria proteomes were analyzed by LC-MS/MS, identifying a number of proteins that exhibited altered expression in isogenic metastatic versus nonmetastatic cancer cell lines, including NADH-cytochrome b5 reductase 3 (CYB5R3), l-lactate dehydrogenase A (LDHA), Niemann-pick c1 protein (NPC1), and nucleolar RNA helicase 2 (NRH2). The altered expression levels were validated at the protein and transcriptional levels, and analysis of breast cancer biopsies from two cohorts of patients demonstrated a significant correlation between high CYB5R3 expression and poor disease-free and overall survival in patients with estrogen receptor-negative tumors (DFS: p = .02, OS: p = .04). CYB5R3 gene knock-down using siRNA in metastasizing cells led to significantly decreased tumor burden in lungs when injected intravenously in immunodeficient mice. The cellular effects of CYB5R3 knock-down showed signaling alterations associated with extravasation, TGFβ and HIFα pathways, and apoptosis. The decreased apoptosis of CYB5R3 knock-down metastatic cancer cell lines was confirmed in functional assays. Our study reveals a central role of CYB5R3 in extravasation/colonization of cancer cells and demonstrates the ability of our quantitative, comparative proteomic approach to identify key proteins of specific important biological processes that may also prove useful as potential biomarkers of clinical relevance. MS data are available via ProteomeXchange with identifier PXD001391.
The development of metastasis is a complex, multistep process that includes activation of an aberrant intracellular signaling pathway responsible for signal transduction that enables cancer cells to interact with the environment, proliferate, avoid apoptosis, and thus colonize in the new environment (1). It has been proposed that the final steps in the metastatic process, metastatic colonization, referring to outgrowth of cancer cells at a distant site, may hold the most therapeutic promise (2). It was further suggested that therapies that interrupt metastatic colonization might be most beneficial to patients at high risk of developing metastasis (2).
Several key molecules involved in different intracellular signaling pathways important for cancer and metastasis formation have been characterized. Among these are p53, which, when mutated, is able to regulate proteins that mediate central steps in metastasis, such as proliferation, drug resistance, and survival (3). The p53 protein has been found to have very diverse roles in cancer cells: in the nuclei as transcription factor guarding the cell in response to various stress signals and in the cytoplasm modulating miRNA processing and survival proteins in the mitochondria (4). Other intracellular proteins associated with metastasis include the actin cytoskeleton-regulating proteins, e.g. the rho family of small GTPases, which play a crucial role in cell motility (5, 6), and proteins downstream of the human epidermal growth factor receptor, e.g. the ras/raf/mitogen-activated protein kinase pathway involved in cell migration and proliferation and phosphatidylinositol 3-kinase/akt pathway regulating cell growth, apoptosis, invasion, and migration (7).
Analysis of the individual steps of the metastatic process is not possible using patient tissue or in vitro assays, but in vivo models based on inoculation of isogenic human cell lines with different phenotypes into mice may allow studies of these processes and provide the means for comparative molecular screening and functional evaluation of candidate metastasis-related genes and proteins. One such metastasis model is based on the isogenic cell lines, NM-2C5 and M-4A4, which are equally tumorigenic in immunodeficient mice but only the latter produces metastases in the lungs and lymph nodes. Although NM-2C5-derived primary tumors disseminate single cells to the lungs, they remain dormant and do not form metastases (8, 9). Hence, the model recapitulates the mechanistic steps of extravasation and colonization of circulating cancer cells at distant sites, while avoiding problems inherent with the variations in genetic backgrounds of human tissue samples. Additionally, this model overcomes the complexities of identifying cells with metastatic potential from primary tumors (8, 9). Gene expression (10–12), miRNA expression (13), and analysis of plasma membrane proteins (14–16), ribosomal proteins (17), secreted proteins (18), soluble proteins (19), and phosphoproteins (20) from these cell lines has been described. In previous studies of this model, we analyzed the plasma membrane proteome and found higher expression of CD73 (ecto-5′-nucleotidase) and integrin β1 in M-4A4 versus NM-2C5, which was correlated with poor outcome of breast cancer patients (15).
Here, we describe a quantitative, comparative LC-MS/MS analysis of intracellular proteins from the cytosol, mitochondria, and nuclei by analyzing four subfractions of proteins metabolically labeled with amino acids containing stable isotopes from the NM-2C5 and M-4A4 cells. Among the proteins exhibiting altered expression between the two cell lines, NADH-cytochrome b5 reductase 3 (CYB5R3)1, l-lactate dehydrogenase A (LDHA), Niemann-pick c1 protein (NPC1), and nucleolar RNA helicase 2 (NRH2) were further studied using other biochemical techniques and their expression analyzed in primary breast cancer tissue biopsies of two cohorts of patients. The expression of CYB5R3, a membrane-bound enzyme not identified in any of the previous studies, was shown to correlate with clinical outcome, and its effect on extravasation and colonization was evaluated by injecting M-4A4 cells transfected with CYB5R3 siRNA or control siRNA into the tail vein of immunodeficient mice, demonstrating a reduction of lung metastasis when CYB5R3 expression was significantly reduced. Our study demonstrates a central role of CYB5R3 in extravasation/colonization of breast cancer cells.
EXPERIMENTAL PROCEDURES
Cell Culture and Stable Isotopic Labeling by Amino Acids in Cell Culture Reagents
The human breast carcinoma cell lines, NM-2C5 and M-4A4, kindly provided by Dr. David Tarin, UCSD Cancer Center, California, were propagated as previously described (14). For proteome analysis, the medium of the NM-2C5 cell line was supplemented with 12C6-l-arginine and 12C6- l-lysine (Sigma-Aldrich, St. Louis, MO), whereas that of the M-4A4 cell line was supplemented with 13C6-l-arginine and 13C6-l-lysine (Cambridge Isotope Laboratories, Andover, MA). To ensure complete incorporation of the stable isotopes, the cells were grown to at least five cell doublings in the customized media before isolating the proteins. The incorporation of stable isotopes was monitored by MS, as described previously (14). Proteome analysis was performed on cultures passaged no more than ten times from frozen stock vials designated passage 1 at the time of in vivo inoculation, thereby insuring genetic stability.
Subcellular Fractionation
All steps were performed at 4 °C or on ice, and all buffers contained Complete Protease Inhibitor (Roche Diagnostics, Mannheim, Germany). Cells were rinsed in PBS, removed from the flasks using a cell scraper, and the two cell lines were counted and mixed in a 1:1 ratio (a total of 2–8 × 10⁷cells), followed by two rounds of washing in PBS. Cells were lysed by incubation in a hypotonic buffer (10 mm Tris-base, 1.5 mm MgCl2, and 10 mm NaCl, pH 6.8) for 5 min followed by sedimentation by centrifugation (300 × g, 5 min), resuspended in gradient buffer (0.25 m Sucrose, 10 mm HEPES, 100 mm succinic acid, 1 mm EDTA, 2 mm CaCl2, and 2 mm MgCl2, pH 7.4) and homogenized by 50 strokes (1,500 rev/min) using a motor-driven Potter homogenizer (B. Braun Biotech, Allentown, PA). The homogenate was centrifuged at 1,000 × g for 10 min.
A preparation of the nuclear proteins was isolated from the sedimented homogenate. The pellet was resuspended in 0.5 ml 0.25 m sucrose, 10 mm MgCl2, 20 mm Tris-HCl (pH 7.4), and 1 mm DTT and layered on top of a two-step discontinuous sucrose gradient (1.3 m sucrose in 6.25 mm MgCl2, 20 mm Tris-HCl (pH 7.4), 0.5 mm DTT, and 2.3 m sucrose in 2.5 mm MgCl2, 20 mm Tris-HCl (pH 7.4)). Nuclei and cell debris were separated by centrifugation (5,000 × g, 45 min, 4 °C), and two layers of protein material were isolated (both layers were analyzed by LC-MS/MS). These layers were carefully resuspended in 1 ml 10 mm HEPES (pH 7.9), 10 mm KCl, 1.5 mm MgCl2, and 1 mm DTT, and the nuclei were sedimented by centrifugation (1,000 × g, 5 min, 4 °C). The supernatants were discarded, and the pellets resuspended in 1 ml gradient buffer. The nuclei were sonicated (2 min at 10% power) to release the proteins, which were centrifuged at 1,000 × g for 15 min at 4 °C and the supernatants recovered. A preparation of the cytosolic proteins was isolated using the postnuclear supernatant from the sedimented homogenate by recovering the supernatant after further sedimenting the membrane proteins by centrifugation at 120,000 × g for 60 min in a M150GX microultracentrifuge (Sorvall, Asheville, NC) using a S55-S swing-out rotor (Sorvall). Nuclear and cytosolic proteins were isolated from the same batch of cells and in three biological replicates. Mitochondrial proteins were isolated using Percoll/sucrose density membrane separation as described in reference (14), but rather than using the top fractions containing the plasma membrane proteins, the lower fractions containing the mitochondrial proteins were identified by enzymatic assays and isolated. Briefly, the homogenate was centrifuged as described above and the recovered supernatant was ultracentrifuged (100,000 × g, 30 min). The pellet, containing crude membranes, was resuspended in gradient buffer and sedimented twice (100,000 × g, 30 min). The purified and washed membranes were resuspended in 2 ml gradient buffer by manual homogenization (five strokes) and mixed with 1.9 ml Percoll (Amersham Biosciences, Uppsala, Sweden) containing 10% PBS and 0.19 ml 2.5 m sucrose in an Easy-SealTM tube (polyallomer, 5 ml, Sorvall). The tube was filled with gradient buffer, capped, and centrifuged at 120,000 × g for 15 min. The gradient was fractionated from the top into ten fractions of 235 μl by displacing it from the bottom with 2 m sucrose. Percoll was removed by centrifugation at 900,000 × g for 15 min. The fractions containing the mitochondrial proteins were identified by determining the activity of succinate dehydroxygenase as described previously (14). Mitochondrial proteins were isolated in three biological replicates. Protein concentrations were determined in triplicate using a colorimetric, detergent-compatible, Lowry-based assay (DC protein assay, Bio-Rad, Hercules, CA) in accordance with the manufacturer's protocol and using a BSA preparation as standard (Pierce, Rockford, IL).
Preparation for Mass Spectrometry
Nuclear and mitochondrial proteins (∼50 μg) were digested as previously detailed (14). Cytosolic proteins were precipitated in acetone (four volumes, −80 °C, 1 h), sedimented by centrifugation (10.000 × g, 10 min, 4 °C), and the supernatant carefully removed. The pellet was washed twice with ice-cold acetone/water (4:1) and dried in a fume hood for 15 min. The proteins were resolubilized in 50 mm NH4HCO3, 10 mm DTT and incubated at 56 °C for 30 min, after which iodoacetamide was added to a final concentration of 40 mm and incubated at room temperature in the dark for 60 min. The proteins were digested at 37 °C overnight using trypsin (2 μg enzyme/100 μg protein), and the peptides were vacuum-dried to a volume of 20 μl and acidified by adding formic acid. The tryptic peptides were desalted and concentrated on an Empore C18 extraction disk (3 m, St. Paul, MN) and reverse-phase POROS R3 (Perseptive Biosystems, Foster City, CA) packed in GELoader tips (Eppendorf, Hamburg, Germany) using a modified version of the previously described StageTips (14, 21, 22).
Liquid Chromatography–Tandem Mass Spectrometry
Peptides from the nuclear and cytosolic preparations were analyzed by nanoflow LC-MS/MS. Peptide separation was achieved with an LC-Packings Ultimate 3000 nanoflow system (LC Packings, Amsterdam, The Netherlands). Peptides were loaded at a flow rate of 3 μl/min onto a custom-made 1 cm precolumn (75 μm inner diameter) of fused silica with kasil-frits retaining the Reprosil C18, 3.5 μm reversed-phase particles (Dr. Maisch GmbH, Ammerbuch-Entringen, Germany). Nanoflow reversed-phase HPLC was then performed with a flow rate of 0.2 μl/min through a custom-made 8–12 cm analytical column (50 μm inner diameter) packed with Reprosil C18-AQ, 3 μm reversed-phase particles (Dr. Maisch, GmbH). Peptides were eluted directly into the ESI source of a Q-TOF LCT Premier tandem mass spectrometer (Waters/Micromass, Manchester, UK) using a stepped linear gradient (solvent A: 0.1% CH3COOH, solvent B: 95% acetonitrile, 0.1% CH3COOH): 0% B for 10 min, 0–35% B 90 min, and 35–100% B for 5 min. Mass- and charge-dependent collision energies were used for peptide fragmentation. Peptides from the mitochondrial preparations were separated similarly to the nuclear and cytosolic proteins but analyzed using a Q-TOF Micro tandem mass spectrometer (Waters/Micromass) as previously described (14). All protein preparations were analyzed in three technical replicates; one-third of the 50 μg protein used for protein digestion was used for each triplicate. The mass spectrometry proteomics data have been deposited to the ProteomeXchange Consortium (23) via the PRIDE partner repository with the dataset identifier PXD001391.
MS/MS Database Search and Quantification
Peak list files were created using Masslynx 4.0 (Waters/Micromass) with the following processing parameters: background subtraction: polynomial order 10, 10% below curve; smoothing: Savitzky Golay, three channels, two smooths; centroiding: min peak with at half height, 4, centroid top, 80%. The data were searched against all human proteins and common contaminants (n = 77,317) in the Mass Spectrometry International Protein Index (MSIPI) database (24) as of April 1, 2009 (ftp://ftp.ebi.ac.uk/pub/databases/IPI/msipi/) using an in-house Mascot server v2.2 (Matrix Science Ltd., London, UK). Search parameters were: 50 ppm precursor ion mass tolerance, 0.2 Da fragment ion mass tolerance, enzyme-specificity: trypsin (C terminally to R and K but not RP and KP), one missed cleavage, fixed modifications: cysteine carbamidomethyl, variable modifications: oxidation (M), label: 13C(6) (K and R). The criteria for accepting MS/MS spectra were Mascot scores above 60 and a false discovery rate (based on peptide scores) below 2%: The significance threshold was manually lowered for each MS-analysis to ensure a false discovery rate below 2%, but was never increased above p < .05 (standard setting). Moreover, only peptides with the highest rank (“red” peptides), i.e. the best match for the given mass, were used for quantification. The false discovery rate data were assessed against a human MSIPI decoy database essentially as described previously (25) and calculated as follows: false discovery rate (%) = decoy hits × 100/(MSIPI hits + decoy hits). Peak list files were recalibrated using the in-house developed Perl script MSRecal, and relative quantification of stable isotope-labeled peptides was performed using MSQuant v1.5 (26). MSQuant uses eXtracted Ion Chromatogram (XIC) for quantification, and all peptides fulfilling the criteria mentioned above for MS/MS spectra were quantified; no outlier points were removed. The quantifications were normalized to their collective median and imported via a comma separated values (CSV) format to ProteinCenter v2.8.1 (Proxeon A/S, Odense, Denmark) to identify differentially expressed proteins. All protein identifications from the same biological samples were merged (36 LC-MS/MS analyses were merged into six biological samples). The six biological samples were compared, and proteins that were 98% or more similar were clustered into groups to reduce redundancy. The inclusion criteria for the differentially expressed proteins included in Table I were: identification and quantification in two or more biological samples by two or more different peptides and differential expression above 1.5-fold, which was determined based on the 5 and 95% percentiles and manual inspection of protein spectra of proteins known to be associated with cancer. Quantitative and qualitative data of the differentially expressed proteins were manually inspected using the Mascot search and MSQuant to verify correct identification and quantification. Differences in protein expression were analyzed using the Student's t test to determine whether the mean quantification value differed from onefold (no differential expression). Low p values were preferred when selecting proteins for inclusion in the biochemical and transcriptional analyses described below. Further, since only one protein matching each set of peptides was quantified by MSQuant, the Mascot search results were manually inspected to identify any isoforms matching the same set of peptides of the reported differentially expressed proteins in Table I, and no such isoforms were identified for any of the proteins listed. Previously, we analyzed the membrane proteins of this cell line model (14, 15), focusing on the differentially expressed plasma membrane proteins. Membrane proteins that exhibited altered expression, but were not plasma membrane proteins, were included in this study.
Table I. Comparative, quantitative proteomics of proteins showing altered expression levels in M-4A4 vs. NM-2C5.
| Protein name | UniProt | Gene | Samples | Peptides | Sequence coverage | Fold-change M-4A4/NM-2C5a | p valuesb |
|---|---|---|---|---|---|---|---|
| Filamin-A | P21333 | FLNA | 2 | 4 | 2.4% | 1.1 to 1.8 | .07 |
| L-lactate dehydrogenase A | P00338 | LDHA | 6 | 8 | 24% | 1.2 to 2.5 | .01 |
| NADH-cytochrome b5 reductase 3 | P00387 | CYB5R3 | 3 | 4 | 18% | 1.2 to 3.2 | .03 |
| Niemann-pick c1 protein | O15118 | NPC1 | 2 | 4 | 6.3% | 5.4 to 6.5 | .03 |
| Protein ndrg1 | Q92597 | NDRG1 | 2 | 2 | 8.8% | 1.9 to 2.3 | .07 |
| Nucleolar RNA helicase 2 | Q9NR30 | DDX21 | 2 | 4 | 8.3% | –1.2 to –1.6 | .08 |
| Synaptic vesicle membrane protein VAT-1 homolog | Q99536 | VAT1 | 2 | 2 | 6.6% | –1.3 to –1.6 | .13 |
Uniprot: accession numbers from Uniprot. Samples: the number of samples the proteins were quantified in. Peptides: the maximum number of peptides identified.
a Fold change in M-4A4 vs. NM-2C5 in biological replicates.
b Student's t-test.
c Fold change in NM-2C5 vs. M-4A4.
Western Blotting
Based on protein concentration measurements, equal amounts of homogenates from M-4A4 and NM-2C5 cells isolated as described in the protein fractionation section were resolved on 4–20% SDS-PAGE (Pierce) and electroblotted onto a PVDF membrane. The membranes were blocked in PBS, 0.1% Tween-20, and 5% nonfat dry milk powder for 1 h at room temperature, incubated with primary antibody anti-CYB5R3 (1:5000, HPA001566, Atlas Antibodies), anti-NPC1 (1:1.000, H00004864-M02, Abnova, Taipei, Taiwan), anti-Na+/K+ ATPase (1:20.000, ab7671, Abcam, Cambridge, UK), or anti-β-actin (1:20.000, ab6276, Abcam) in PBS, 0.1% Tween-20, and 5% nonfat dry milk powder) for 1 h at room temperature, followed by washing (in PBS, 0.1% Tween-20, and 1% nonfat dry milk powder) and incubation with goat anti-mouse or anti-rabbit HRP-conjugated secondary antibody (Dako, in PBS, 0.1% Tween-20, and 1% nonfat dry milk powder) for 1 h at room temperature. The membranes were washed in PBS, 0.1% Tween-20 prior to visualization of immunoreactive bands using ECL Western blot kit or ECL Prime Western blot kit (Amersham Biosciences).
Quantitative Real-Time PCR
Relative quantification of gene expression was performed in triplicate using SYBR Green PCR Master Mix (Applied Biosystems, Foster City, CA) in accordance with the recommendation of the supplier using a 7500 or a StepOne Real-Time PCR system (Applied Biosystems). The median relative expression levels were normalized using the reference genes Thymine-Adenine-Thymine-Adenine (TATA) box-binding protein, β-actin, and Na+-K+-ATPase or Na+-K+-ATPase alone. The primers for specific amplification were all obtained from QuantiTect Primer Assay collection (Qiagen): TBP/TATA box-binding protein, QT00000721; ACTB/β-actin, QT00095431; ATP1A1/Na+-K+-ATPase, QT00059962; NPC1/Niemann-pick c1 protein, QT00066465; DDX21/nucleolar RNA helicase 2, QT00047187; CYB5R3, QT00090909; and LDHA/l-lactate dehydrogenase A, QT00001687.
Patient Samples
Formalin-fixed and paraffin-embedded archival tissue blocks from two cohorts of Danish patients with resectable, histologically verified, primary invasive breast carcinomas undergoing surgery at Odense University Hospital were used for this study. The carcinomas were classified according to the criteria of WHO and graded according to Bloom and Richardson's histological grading system (27). Clinicopathological parameters, including patient age at diagnosis, tumor size, lymph node status, tumor recurrence, and follow-up status, were retrospectively obtained from Danish Breast Cancer Group (DBCG). Observations of follow-up were censored at ten years after surgery. Disease-free survival (DFS) is defined as recurrence or death according to Punt et al. (28). Cohort 1 included women diagnosed with breast cancer from 1990 to 1998. A total of 30 patients were identified retrospectively according to recurrence status (50% with recurrence within ten years follow-up), estrogen receptor (ER), progesterone receptor (PR), and HER2 status. The selection of breast cancer biopsies for cohort 1, the generation of all tissue and cancer cell line microarrays, and the staining procedures are described elsewhere (15). Cohort 2 was also retrospectively identified and consisted of 122 patients who had undergone surgery between 1997 and 2001 at Odense University Hospital and were registered as ER-negative (ERneg). Further, a ten year follow-up was required for those patients who did not develop metastasis from time of surgery to date of data-withdrawal. Re-evaluation of ER and PR status with up-to-date immunohistochemical screening classified a number of patients as ER-positive (ERpos) and/or PRpos: ERneg/PRneg (<1% positive cells, n = 101), ERneg/PRneg and HER2 unamplified (triple-negative, n = 74), ERneg/PRneg and HER2 amplified (n = 24), ERpos and/or PRpos, HER2 unamplified (n = 19), and ERpos and/or PRpos, HER2 amplified (n = 2). Clinical data were retrieved from the Danish Breast Cancer Cooperative Group (DBCG) database on September 1, 2011. The majority of patients were enrolled in the DBCG 89, 99 programs (www.dbcg.dk). Patients had documented local or distant relapses, death (any cause), or were diagnosed with secondary malignant disease. Patients received adjuvant chemotherapy according to national guidelines. Normal liver tissues were also included in the tissue array (n = 1, in quadruplicates) for staining intensity control. For the tissue arrays, a representative area of each tumor was selected from a hematoxylin- and eosinstained tumor slide, and 2 mm diameter cores were retrieved from the corresponding formalin-fixed and paraffin-embedded tumor block. Each tissue array contained 15–20 cores in duplicate or quadruplicate. The two cohorts were used to study the association between expression of selected proteins and metastasis in ERneg patients. Further, anti-CYB5R3 antibodies were tested on whole-tissue breast tumor specimens to demonstrate homogenous staining prior to validation of cores on tissue arrays. The studies were approved by the Regional Scientific Ethical Committee of Southern Denmark.
Fisher's exact and Chi-square tests were used to investigate the significance of the relationship between CYB5R3 and the individual variables. Hazard ratio (HR) and p values were calculated via Cox proportional hazard regression model (STATA IC 11 statistical software) and DFS demonstrated with Kaplan–Meier plots (GraphPad Prism statistical software). Uni and multivariate analysis were performed using Cox proportional hazard regression model (STATA IC 11). Only variables with significant p values from univariate analyses were entered into the multivariate analysis (backward stepwise, probability for stepwise entry, and removal were set at 0.10 and 0.05). The p values ≤ .05 denote statistical significance.
Immunocytochemistry and Histochemistry
Tissue array sections (4 μm) from the formalin-fixed and paraffin-embedded tissue or cell lines were cut, deparaffinized, and rehydrated prior to antigen retrieval performed by microwave boiling in Tris EGTA (T-EG) buffer (10 mm Tris and 0.5 mm EGTA, pH 9). Sections were incubated with anti-ER ab clone 6F11 (Leica Biosystems), HER2 with HerceptestTM kit (DAKO); anti-NPC1 (1:1.000, HPA026618, Atlas Antibodies, Stockholm, Sweden); anti-NRH2 (1:1.000, ab84394, Abcam); anti-CYB5R3 (1:3–6.000, HPA001566, Atlas Antibodies); or anti-LDHA (1:2–4.000, TA301302, Origene, Rockville, MD) for 1 h at room temperature. Primary antibody binding was detected with either horseradish peroxidase (HRP)-conjugated EnVision™ polymer (K4001, Dako), or PowerVision Poly-HRP (Novocastra; Leica Biosystems) with 3,3′-diaminobenzidine (K3468, Dako) as chromogen. Microscopy of tissues was performed on a Leica DMLB microscope (100×/numerical aperture [NA] 1.25; Leica Microsystems) using LasV3.6 acquisition software. Evaluations of the immunohistochemical stainings were performed by a highly experienced pathologist using bright field microscopy in a blinded setup. No software-based approach was used. Based on standard histopathological criteria, the immunohistochemical staining results were rated according to staining intensity: no, weak, moderate, and strong staining. For cohort 1, a cut-off was calculated and used to stratify the cancers in two groups, strongly and weakly stained, using the average value as cut-off between them. This cut-off was also used for cohort 2.
siRNA Knock-Down
A total of 1–1.5 × 10⁶ cells were resuspended in 100 μl Ingenio Electroporation Solution (Mirusbio, Kem-En-Tec Nordic, Denmark) and siRNA (CYB5R3, GS1727; SI00008743 (CYB5R3 siRNA 1) and SI026663976 (CYB5R3 siRNA 2) Qiagen or negative control siRNA, SIC001, Sigma-Aldrich) were added to a final concentration of 0.3 μm. The resuspended cells were transfected using a Nucleofector II (P20 and T20 program, Amaxa, Köln, Germany). After transfection, the cells were transferred to complete medium, and mRNA levels were determined on day 1–6, 8, 11, and 15; protein levels on day 2, 3, 4, 6, 8, 11, and 15; proliferation assay on day 6, apoptosis assay on day 6; and protein array and experimental metastasis assay on day 3.
Evaluation of Metastasis Formation In Vivo
The M-4A4 cell line was transfected with luciferase 2 (Luc2)-expressing lentiviral particles (AMS Biotechnology) using a multiplicity of infection virus particle concentration of five in complete medium containing 5 μg/ml polybrene (Sigma-Aldrich). The virus-containing media was replenished with complete medium after 16 h. Stably luciferase-expressing M-4A4 cells (M-4A4-Luc2) were generated after blasticidine S (Life Technologies) selection (6 mg/ml) for 5 days. To ensure that the siRNA knock-down did not influence the bioluminescence properties of the cells, the luciferase activity was evaluated on day 3 after transfection using CYB5R3-targeting siRNAs as well as control siRNA. No difference in luciferase activity was observed between the cells transfected with the different siRNAs or untransfected cells. Further, we performed a Blast search of the siRNAs sequences on the luciferase gene and found only minimal overlap. Three days after siRNA transfection, the cells were harvested, resuspended in PBS at a concentration of 5 × 10⁶/ml, and 0.2 ml was injected into the tail vein of 8-week-old female CB-17 SCID mice. All animal experiments were approved by The Experimental Animal Committee, The Danish Ministry of Justice and performed at the animal facility core at University of Southern Denmark. The mice were housed under specific pathogen-free conditions with ad libitum food and drinking water. The mice were euthanized if they showed any adverse signs or symptoms of disease, including weight loss, paralysis, or general discomfort. Relative quantification of metastasis burden was performed at days 4 and 12 using whole-body bioluminescent imaging (IVIS-spectrum, Caliper Life Science). Mice were injected with 150 mg d-luciferin/kg body weight and then anesthetized with isoflurane gas. Images were acquired starting 10 min after luciferin injection. Regions of interest were drawn encircling the lung region to quantify metastatic burden as measured by the relative photon emission (photons/s/cm2/sr) using Caliper Life Science Living image (version 4.2).
Metastasis development was calculated as the fold increase of metastatic burden between days 4 and 12. The statistical significance of metastasis development between two groups was calculated using the Mann–Whitney statistical test. p values > .05 were considered insignificant. The increase was further analyzed using Grubb's test for detecting and removing outliers from the dataset. Before testing for significant outliers, all values were transformed to their logarithms to ensure that the data were sampled from a Gaussian distribution.
Protein Array
Three days after transfection, cell lysates (2 × 10⁶) were prepared for the Signaling Explorer protein array (Full Moon Biosystems, Sunnyvale, CA) according to the manufacturer's protocol. Briefly, the cells were washed in PBS containing protease inhibitors and harvested by scraping. The washed cells were lysed in extraction buffer, and the supernatant was cleared by centrifugation (10.000 × g, 20 min). Using a spin column, the extraction buffer was exchanged with labeling buffer and the protein content was measured at A280 (Nanodrop ND-1000, Fisher Scientific). CYB5R3 knock-down was verified by Western blotting prior to biotinylation. A milk-containing blocking solution was used prior to incubating the protein lysate (180 μg) on array slides, and the slides were washed extensively after both blocking and protein lysate incubation. Finally, bound biotinylated proteins were detected using Cy3-streptavidin (Invitrogen). The slides were scanned and the resulting data were analyzed by Full Moon Biosystems. The assay was performed in biological duplicates.
Global Pathway Analysis
Global pathway analysis was performed using the core analysis module of the Ingenuity Pathway Analysis software (Ingenuity Systems, Inc.). Canonical pathway functions are based on well-characterized metabolic and cell signaling pathways that have been curated and hand-drawn by PhD-level scientists, whereas the network function generates networks based on the data input and may contain proteins of several pathways.
Apoptosis Assay
An ELISA-based cell death Kit (Roche) was used to identify differences in apoptosis rate between CYB5R3 siRNA- and control siRNA-transfected M-4A4 cells. Cells were transfected and seeded in triplicate in 96-well plates at different densities (2,000–10,000 cells/well), and the apoptosis rate was measured on day 6 in accordance with the manufacturer's instructions. Briefly, cell growth medium was removed and the cells were lysed in lysis buffer. An aliquot of the lysate was transferred to a streptavidin-coated plate, and the immunoreagent (combination anti-histone-biotin-tagged and anti-DNA binding horse radish peroxidase-conjugated antibodies) was added. The wells were washed thoroughly after incubation, and the degree of apoptosis was measured at 405 nm (reference 490 nm) upon addition of a color-changing peroxidase substrate solution. To compensate for any cell loss during transfection and any minor differences in proliferation, the data were normalized to the number of cells present using proliferation assay. This assay was performed in biological triplicates.
Proliferation Assay
Cells (4 × 10⁴ CYB5R3 siRNA and control siRNA transfected) were seeded in quadruplicate and stained with crystal violet on day 6 as described by Lundholt et al. (29). Briefly, the cells were washed in PBS, followed by incubation (10 min) in 5% crystal violet (Sigma-Aldrich) and 25% methanol. The crystal violet was removed, and the cells were washed three times in water and dried. The crystal violet contained in the dry cells was dissolved in 0.1 m sodium citrate, 50% ethanol, and absorbance measured in triplicate at 570 nm using a Sunrise microplate Reader (Tecan Trading AG, Switzerland). This assay was performed in biological quadruplicates.
RESULTS
To identify proteins, particularly intracellular proteins, that may influence the ability of cancer cells to extravasate, colonize, and establish metastasis at distant sites, we used a model system consisting of two isogenic human cancer cell lines (M-4A4 and NM-2C5) that are equally tumorigenic in immunodeficient mice, but only one forms metastases, M-4A4, while NM-2C5-derived primary tumors disseminate single cells to the lungs that remain dormant. Comparison of protein expression levels in cytosol, mitochondria, and nuclei fractions of the two cell lines using stable isotopic labeling by amino acids in cell culture and LC-MS/MS proteomic analysis in biological and technical triplicates identified a total of 341 proteins, all identified by ≥ 2 peptides. Seven proteins exhibited 1.6–6.5-fold altered expression between the two cell lines and may be potential markers of the ability of cancer cells to colonize and establish metastasis (Table I). Of these, CYB5R3, LDHA, NPC1, filamin-A, and NDRG1 exhibited higher expression in M-4A4 versus NM-2C5, while NRH2 and synaptic vesicle membrane protein VAT-1 homolog (VAT-1) exhibited lower expression levels in M-4A4 versus NM-2C5. Supplemental Data 1 provides the accession number, number of unique peptides, and list of the sequences for each protein identified. Supplemental Data 2 provides the identified sequence, the precursor m/z, charge, and the Mascot score of all single peptide-based proteins. The mean and standard deviation for all quantified proteins and the number of peptides used for quantification are provided in Supplemental Data 3.
Biochemical and Transcriptional Evaluation of Proteins Exhibiting Altered Expression
To further evaluate the quantitative proteomic differences observed by mass spectrometry, the expression levels of four selected proteins were examined in the two cell lines by immunocytochemistry and/or Western blotting, and the corresponding gene expression levels were measured by quantitative real-time PCR.
Immunocytochemical analysis of the NM-2C5 and M-4A4 cell lines, as well as the parental cell line MDA-MB-435, was performed using a panel of commercial antibodies (Fig. 1). CYB5R3, LDHA, and NPC1 all showed more intense intracellular staining in M-4A4 and MDA-MB-435 than in NM-2C5, in accordance with the higher expression seen in the proteome analysis. LDHA showed homogeneous staining within the cell, corresponding to a cytosolic distribution, in agreement with the proteomic analysis that primarily identified this protein in the cytosolic fractions, whereas CYB5R3 and NPC1 showed more distinct staining, in agreement with the expected localization in the outer mitochondrial membrane and the endolysosomal organelles, respectively. CYB5R3 and NPC1 were identified primarily in the mitochondrial fractions, while a low level of CYB5R3 was also observed in nuclear fractions in the proteome analysis. Interestingly, analysis of NRH2 showed distinctly different cellular localizations in NM-2C5 versus M-4A4 cells: While NRH2 was found in the nucleoplasm in NM-2C5, it was found in the nucleoli in M-4A4 cells. In MDA-MB-435 cells, NRH2 was localized in the nucleoli of most cells, although nucleoplasmic staining was also observed. NRH2 was identified primarily in the nuclear fractions in the proteome analysis.
Fig. 1.
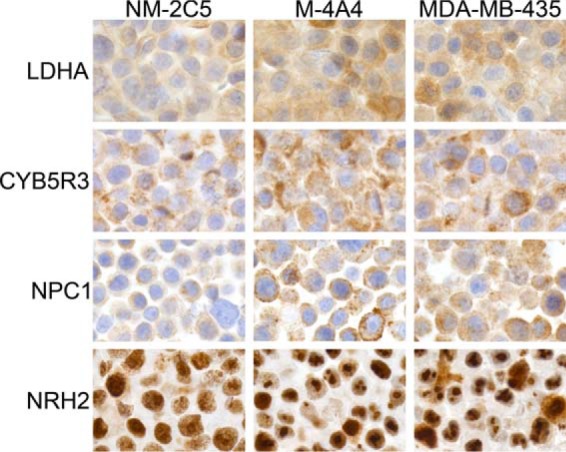
Comparison of the expression patterns of selected candidate proteins in NM-2C5, M-4A4, and MDA-MB-435 cells as analyzed by immunocytochemistry. Formalin-fixed and paraffin-embedded cells were stained with antibodies directed against l-lactate dehydrogenase A (LDHA), NADH-cytochrome b5 reductase 3 (CYB5R3), Niemann-pick c1 protein (NPC1), and nucleolar RNA helicase 2 (NRH2).
Semi-quantitative measurement of the denatured proteins by Western blotting was performed using Na+/K+-ATPase or β-actin for normalization; both proteins were present in quantitatively equal amounts in both cell lines based on the proteomic analysis (Fig. 2A). More intense bands corresponding to CYB5R3 (estimated molecular weight: 34 kDa) and glycosylated NPC1 (estimated molecular weight: 140 kDa) were, as expected, observed for M-4A4 compared with NM-2C5 cell lysate. Further evaluation of mRNA expression levels of the altered proteins LDHA, CYB5R3, NPC1, and NRH2 using quantitative real-time PCR also showed altered expression at the transcriptional level (Fig. 2B).
Fig. 2.
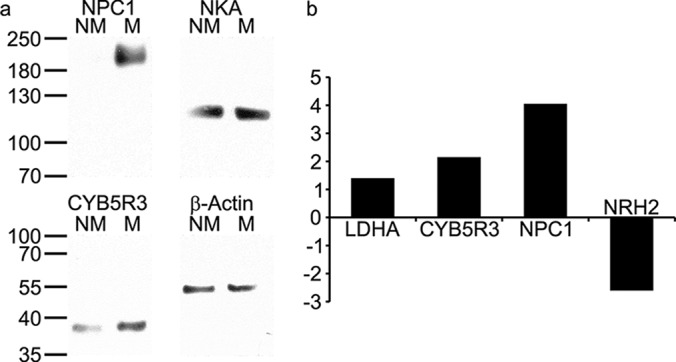
Investigation of selected intracellular proteins exhibiting altered expression using Western blotting and quantitative real-time PCR. (A) Comparison of expression levels of Niemann-pick c1 protein (NPC1) and NADH-cytochrome b5 reductase 3 (CYB5R3) in NM-2C5 (NM) versus M-4A4 (M) cells measured by Western blotting. Na+/K+-ATPase (NKA) and β-actin were used as loading controls, respectively. (B) Comparison of fold-change in expression levels of mRNA of l-lactate dehydrogenase A (LDHA), CYB5R3, NPC1, and nucleolar RNA helicase 2 (NRH2) in M-4A4/NM-2C5 cells as measured by quantitative real-time PCR.
High Expression of CYB5R3 Correlates with Poor Outcome of Patients with ERneg Breast Cancer
We next examined the expression of LDHA, CYB5R3, NPC1, and NRH2 in primary breast cancer tissue biopsies of two cohorts of patients by immunohistochemistry (Fig. 3). Cohort 1, consisting of 30 breast cancer patients who had or had not developed distant metastasis within a ten-year period following surgical removal of the primary tumor, was evaluated using staining intensity to group tumors as strongly and weakly stained using the average value as cut-off between them. The expression of ER, PR, and HER2 was used to further categorize these tumors into the three breast cancer subtypes: ERpos/PR pos, HER2 amplified, and triple-negative (ERneg/PRneg/HER2 unamplified). The NM-2C5 and M-4A4 cell lines have previously been shown to be ERneg/PRneg, and HER2 was unamplified (data not shown), indicating that these cell lines belong to the triple-negative subtype.
Fig. 3.
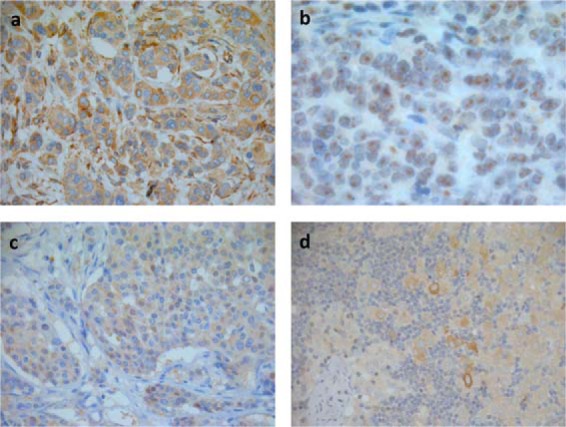
Staining pattern of antibodies against CYB5R3, NRH2, NPC1, and LDHA in human breast cancer tissue determined by immunohistochemical analysis. (A) Antibodies against CYB5R3 and (B) NPC1 exhibited cytoplasmic staining with perinuclear intensification, while (C) NRH2 staining was predominantly observed in nucleoli with weaker staining in the remaining parts of the nucleus. (D) LDHA exhibited heterogeneous cytosolic staining within the tumors with the most intense staining observed in vital tumor cells adjacent to necrotic areas.
High CYB5R3 expression was more frequently observed in primary tumors of patients that developed metastasis (67%, 14/21) compared with those that had not (44%, 4/9), although this did not reach significance (Table II). Strong staining of NRH2 was also associated with the ERneg/PRneg phenotype (p = .05) but not correlated with metastasis status, while no significant correlations between metastasis, recurrence, ER/PR status, HER2 status, and NPC1 or LDHA staining was observed. LDHA exhibited heterogeneous staining within the tumors, with the most intense staining observed in vital tumor cells adjacent to necrotic areas (Fig. 3).
Table II. Immunohistochemical analysis of protein expression of four candidate proteins in cohort 1 consisting of 30 primary breast cancer biopsies stratified according to metastasis, recurrence, and receptor status (ER, PR, and HER2). Distant metastasis and recurrence were registered within a 10-year period.
| LDHA | CYB5R3 | NPC1 | NRH2 | |
|---|---|---|---|---|
| Node-positive and/or distant metastasis | 45 (9/20)a | 67 (14/21) | 53 (10/19) | 42 (8/19) |
| Node-negative and no metastasis | 67 (6/9) | 44 (4/9) | 44 (4/9) | 44 (4/9) |
| Recurrence | 40 (6/15) | 67 (10/15) | 54 (7/13) | 50 (7/14 |
| No Recurrence | 64 (9/14) | 53 (8/15) | 47 (7/15) | 36 (5/14) |
| ERneg/PRneg/HER2unamplified | 50 (4/8) | 67 (6/9) | 63 (5/8) | 57 (4/7) |
| ERpos/PRpos and/or HER2amplified | 52 (11/21) | 57 (12/21) | 45 (9/20) | 38 (8/21) |
| ERpos and/or PRpos | 56 (10/18) | 50 (9/18) | 47 (8/17) | 28 (5/18)b |
| ERneg/PRneg | 46 (5/11) | 75 (9/12) | 55 (6/11) | 70 (7/10)b |
| HER2amplified | 50 (4/8) | 75 (6/8) | 29 (2/7) | 38 (3/8) |
| HER2unamplified | 52 (11/21) | 55 (12/22) | 57 (12/21) | 45 (9/20) |
a 9/20 indicates strong staining in nine of 20 biopsies.
b p = 0.05 (Fisher's exact test), LDHA—L-lactate dehydrogenase A, CYB5R3—NADH-cytochrome b5 reductase 3, NPC1—Niemann-pick c1 protein, NRH2—nucleolar RNA helicase 2, ER—estrogen receptor, PR—progesterone receptor, HER2—receptor tyrosine-protein kinase erbB-2, amp—amplification, neg—negative, pos—positive.
The expression level of the four candidate proteins was next examined in primary tumors of a second independent cohort of 122 breast cancer patients consisting of predominantly of ERneg/PRneg tumors (n = 101) using the cut-off established with cohort 1. The tumors were grouped according to their ER, PR, and HER2 status, and expression of the four candidate proteins analyzed for the individual subgroups for correlation to disease-free survival (DFS) and overall survival (OS)(Table III). The numbers of patients with metastasis among each breast cancer subtype are listed in Supplemental Data 4. Cox regression analysis identified two proteins, CYB5R3 and NRH2, significantly associated with DFS in the entire cohort (n = 122, p = .04 and p = .03, respectively). High expression levels of CYB5R3 also significantly correlated with poor outcome in the 101 patients with ERneg tumors (DFS, p = .02; HR = 1.87, 95% CI of ratio: 1.1–3.19; median DFS: 1178 days versus >3,650 days, Fig. 4A and OS p = .04; HR = 1.73, 95% CI of ratio: 1.02–2.94; median OS: 2,238 days versus >3,650 days)(Fig. 4B) but not in the smaller ERpos group. NRH2 was also significantly associated with DFS in the small ERpos group (n = 21, DSF and OS p = .04, HR = 10.3, 95% CI of ratio 1.15–92.9; median DFS: 2,737 days versus >3,650 days) but not in the ERneg group.
Table III. Immunohistochemical analysis of protein expression of four candidate proteins in cohort 2 consisting of 122 primary breast cancer biopsies stratified according to receptor status (ER, PR, and HER2). Disease-free survival (DFS) and overall survival (OS) with a 10-year follow-up period was evaluated using Cox regression analysis.
| LDHA |
CYB5R3 |
NPC1 |
NRH2 |
||||||
|---|---|---|---|---|---|---|---|---|---|
| p- value | HR (95% CI)a | p- value | HR (95% CI) | p- value | HR (95% CI) | p- value | HR (95% CI) | ||
| All tumors | DFS | .58 | 0.86 | .04b | 1.72 | .49 | 0.84 | .03b | 1.76 |
| (n = 122) | (0.51–1.46) | (1.04–2.87) | (0.50–1.39) | (1.04–2.96) | |||||
| OS | .6 | 0.87 | .06 | 1.62 | .66 | 0.89 | .03b | 1.8 | |
| (0.51–1.48) | (0.98–2.69) | (0.54–1.49) | (1.07–3.02) | ||||||
| ERneg and PRneg | DFS | .58 | 0.86 | .02b | 1.87 | .67 | 0.89 | .3 | 1.33 |
| (n = 101) | (0.49–1.49) | (1.1–3.19) | (0.52–1.52) | (0.78–2.29) | |||||
| OS | .62 | 0.87 | .04b | 1.73 | .9 | 0.96 | .25 | 1.37 | |
| (0.5–1.5) | (1.02–2.94) | (0.56–1.64) | (0.8–2.36) | ||||||
| ERneg/PRneg/HER2unamp | DFS | .23 | 0.66 | .09 | 1.75 | .86 | 0.94 | .67 | 1.15 |
| (n = 74) | (0.34–1.3) | (0.92–3.32) | (0.5–1.78) | (0.60–2.21) | |||||
| OS | .23 | 0.66 | .13 | 1.65 | .96 | 1.02 | .69 | 1.14 | |
| (0.34–1.3) | (0.87–3.12) | (0.54–1.92) | (0.6–2.19) | ||||||
| ERpos and/or PRpos | DFS | .5 | 0.47 | .58 | 0.54 | .87 | 0.87 | .04b | 10.3 |
| (n = 21) | (0.05–4.2) | (0.06–4.81) | (0.14–5.19) | (1.15–92.9) | |||||
| OS | .5 | 0.47 | .58 | 0.54 | .87 | 0.87 | .04b | 10.3 | |
| (0.05–4.2) | (0.06–4.81) | (0.14–5.19) | (1.15–92.9) | ||||||
| HER2amp | DFS | .38 | 1.6 | .1 | 2.43 | .86 | 0.91 | .25 | 1.84 |
| (n = 24) | (0.56–4.59) | (0.85–6.93) | .91 | (0.32–2.63) | .14 | (0.66–5.13) | |||
| OS | .3 | 1.75 | .18 | 2.04 | 1.06 | 2.17 | |||
| (0.61–5.01) | (0.72–5.77) | (0.37–3.08) | (0.78–6.01) | ||||||
a Hazard ratio (95% confidence interval).
b p < .05 (Cox regression analysis). LDHA—L-lactate dehydrogenase A, CYB5R3—NADH-cytochrome b5 reductase 3, NPC1—Niemann-pick c1 protein, NRH2—nucleolar RNA helicase 2, ER—estrogen receptor, PR—progesterone eceptor, HER2—receptor tyrosine-protein kinase erbB-2, amp—amplified, unamp—unamplified, neg—negative, pos—positive.
Fig. 4.
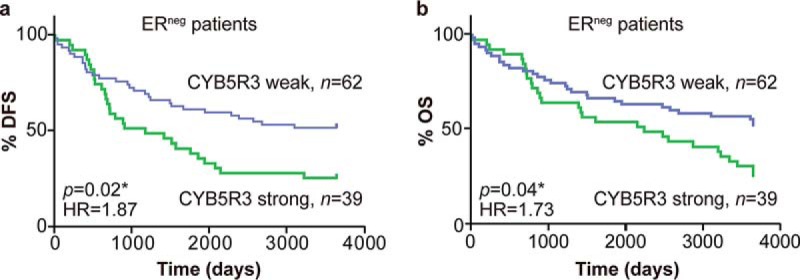
NADH-cytochrome b5 reductase 3 (CYB5R3) protein expression correlates with disease-free survival (DFS) and overall survival (OS) of patients with estrogen receptor-negative (ERneg) breast cancer (p < .02 and .04, respectively, Cox regression analysis). Kaplan–Meier curves illustrate (A) DSF and (B) OS of ERneg breast cancer patients of cohort 2.
The clinicopathologic characteristics at the time of surgery according to CYB5R3weak and CYB5R3strong staining in the ERneg/PRneg, ERneg/PRneg/HER2unamplified (triple-negative), ERneg/PRneg/HER2amplified, and ERpos and/or PRpos groups, respectively, identified no differences relative to age, tumor size, nodal status, and tumor grade (chi-square test, Supplemental Data 5). Univariate and multivariate Cox proportional hazard regression analyses were performed to identify the independent prognostic value of each variable for DFS and OS. CYB5R3 expression and clinicopathological characteristics, including age, tumor size, tumor grade, and lymph node status, were included in the multivariate analysis (Table IV). CYB5R3 and lymph node status were identified as independent prognostic factors of DFS and OS in ERneg breast cancer patients (HR: 1.93, 95% CI: 1.12–3.31, p = .02, and HR: 1.78, 95% CI: 1.04–3.07, p = .04, respectively, Table IV). The results from the multivariate analysis revealed a 1.9-fold higher risk of poor outcome for ERneg tumor patients exhibiting strong versus weak staining of CYB5R3.
Table IV. Univariate and multivariate analysis of CYB5R3 expression in ERneg breast cancer patients of cohort 2.
| Variable | Univariate |
Multivariate |
||
|---|---|---|---|---|
| p value | HR (95% CI) | p value | HR (95% CI) | |
| Age | ||||
| DFS | .41 | 1.27 (0.72–2.25) | ||
| OS | .62 | 1.39 (0.78–2.46) | ||
| Tumor size | ||||
| DFS | .90 | 1.07 (0.38–2.96) | ||
| OS | .97 | 1.02 (0.37–2.83) | ||
| Lymph node status | ||||
| DFS | .11 | 1.59 (0.9–2.81) | .05a | 1.74 (1.01–3.02) |
| OS | .09 | 1.63 (0.92–2.88) | .04a | 1.77 (1.02–3.07) |
| Tumor grade | ||||
| DFS | .43 | 1.31 (0.68–2.52) | ||
| OS | .36 | 1.35 (0.71–2.57) | ||
| CYB5R3 | ||||
| DFS | .02a | 1.87 (1.1–3.19) | .02a | 1.93 (1.12–3.31) |
| OS | .04 | 1.73 (1.02–2.94) | .04a | 1.78 (1.04–3.07) |
p values were calculated by cox regression analysis.
a p ≤ .05 is considered significant. CYB5R3—NADH-cytochrome b5 reductase 3.
High Expression of CYB5R3 Correlates with Metastatic Capabilities of Triple-Negative Cell Lines in Mice
The expression of CYB5R3 in a total of nine triple-negative breast cancer cell lines showed a correlation between strong expression of CYB5R3 and metastatic capability in mice (Table V). Four cell lines known to metastasize in mice had strong staining, while three cell lines known to lack metastatic capabilities had low expression of CYB5R3. For two cell lines, the metastatic capabilities were unknown.
Table V. Immunocytochemical analysis of CYB5R3 expression in triple-negativea breast cancer cell lines stratified according to their metastatic capability in mice.
| Cell line | Metastatic capability in mice | References | CYB5R3 expression |
|---|---|---|---|
| MDA-MB-435 | + | (37) | +++ |
| M-4A4 | + | (8, 9) | +++ |
| Cal51 | + | (38) | +++ |
| MDA-MB-231 | + | (39, 40) | ++ |
| NM-2C5 | - | (8, 9) | +/++ |
| BT20 | - | (41) | + |
| MDA-MB-468 | - | (41) | + |
| MDA-MB-157 | Unknown | ++ | |
| Hs578T | Unknown | +++ |
a ERneg/PRneg/HER2unamplified.
CYB5R3—NADH-cytochrome b5 reductase 3.
Reduction of CYB5R3 Expression by Knock-Down in M-4A4 Cells Inhibit the Late Steps in the Metastatic Process In Vivo
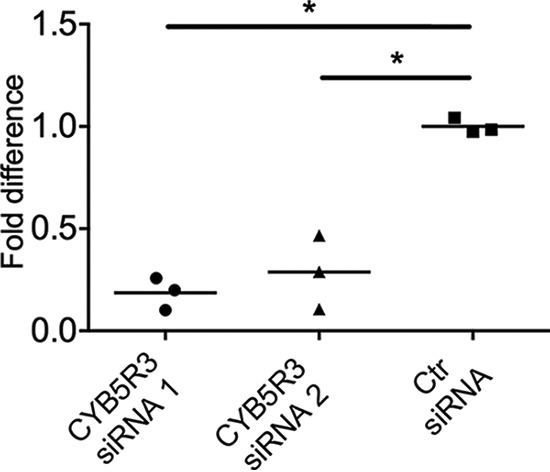
To investigate the role of CYB5R3 in the late steps of the metastatic process (extravasation and/or colonization), the gene was knocked-down in M-4A4 cells using transient transfection with two different siRNAs (CYB5R3 siRNA 1 and 2, respectively), which resulted in >90% reduction in the mRNA level of CYB5R3 in M-4A4 cells (Supplemental Fig. 1A) and corresponding decrease in CYB5R3 protein expression as evaluated by Western blotting (Supplemental Fig. 1B). CYB5R3 expression was decreased from days 2 to 11 for CYB5R3 siRNA 1 and day 2 to 6 for CYB5R3 siRNA2, with the level being lowest on days 2–6.
The effect of CYB5R3 on lung metastasis burden was evaluated by injecting 106 M-4A4 cells transfected with CYB5R3 siRNA 1 or control siRNA into the tail vein of immunodeficient mice (n = 10 in each group) and monitoring them by bioluminescence imaging (days 4 and 12). Metastasis burden was calculated as the fold increase of lung metastases at day 12 as measured by quantitative bioluminescence using the measurement at day 4 for comparison and was shown to be significantly lower in mice injected with CYB5R3 siRNA-transfected M-4A4 cells than in those injected with control siRNA-transfected M-4A4 cells (p < .05, Fig. 5), indicating that knock-down of CYB5R3 in M-4A4 cells inhibits their extravasation and/or colonization.
Fig. 5.
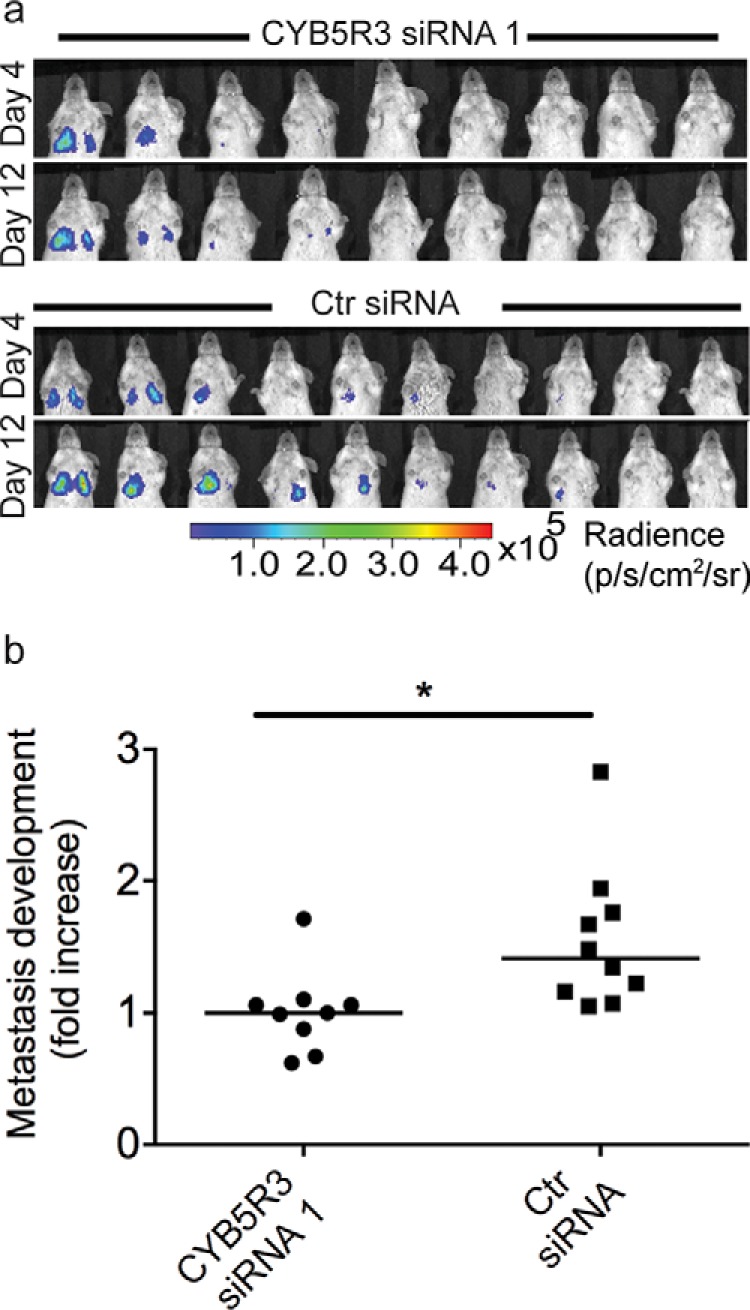
Knock-down of NADH-cytochrome b5 reductase 3 (CYB5R3) inhibits metastasis formation of M-4A4 cells after intravenous injection. CYB5R3 siRNA 1- or control siRNA-transfected cells (106) were injected into the tail vein of female CB-17 SCID mice. (A) Lung metastasis development in mice injected with CYB5R3 siRNA 1- or control (ctr) siRNA-transfected cells (n = 10 per group) was monitored by bioluminescence imaging. (B) Comparison of metastasis development calculated as the fold increase of lung metastases between days 4 and 12. CYB5R3 knock-down significantly inhibited metastasis development compared with control cells. Metastasis development was compared using the Mann Whitney statistical test (p < .05).
CYB5R3 Gene Knock-Down in M-4A4 Cells Influence Signaling Associated with Extravasation, Apoptosis and TGFβ- and HIFα-Pathways
To investigate the consequences of the gene knock-down on cell signaling, protein lysates from M-4A4 cells at day 3 following CYB5R3 siRNA 1 or control siRNA transfection were analyzed for alterations in 1,360 signaling molecules using antibody array (Supplemental Data 6). Of these, 49 showed differential expression (>1.5-fold) between M-4A4 cells transfected with CYB5R3 siRNA and those transfected with control siRNA. IPA analysis revealed that seven of these proteins were involved in decrease of apoptosis and cell death signaling (versus 38 proteins in the entire data set of 1,360 proteins, p < .01, Fishers exact test), including mitogen-activated protein kinase (MAPK) 1 (1.6-fold increase in M-4A4 cells transfected with CYB5R3 siRNA versus control siRNA), BCL2-associated agonist of cell death (1.5-fold increase), and caspase 2, 6, and 8 (1.6-, 1.8-, and 1.6-fold decrease, respectively)(Table VI and Supplemental Fig. 2). Other pathways included extravasation signaling (7 of 49 versus 65 of 1,360, p < .05): Claudin 5, MAPK1, and 11 (1.7-, 1.6-, and 1.5-fold increase, respectively); β-catenin, and matrix metallopeptidase (MMP) 1, 12, and 14 (1.7-, 1.6-, 2-, and 1.5-fold decrease, respectively); TGFβ-signaling (5 of 49 versus 25 of 1,360, p < .01): MAPK 1 and 11 and CREB binding protein, inhibin α, and TGFβ receptor 2 (1.5, 1.8, and1.8-fold decrease, respectively), and HIFα signaling (6 of 49 versus 40 of 1,360, p < .01): MAPK 1 and 11, CREB binding protein, and MMP 1, 12, and 14.
Table VI. Proteins related to apoptosis signaling exhibiting differential expression in cells transfected with siRNA against CYB5R3 compared to cells transfected with control siRNA.
| Gene | Protein name | CYB5R3 siRNA/Control |
|---|---|---|
| MAPK1 | Mitogen-activated protein kinase 1 | 1,6 |
| BAD | BCL2-associated agonist of cell death | 1,5 |
| DFFA | DNA fragmentation factor, 45kDa, alpha Polypeptide | –1,5 |
| CASP2 | Caspase 2, apoptosis-related cysteine peptidase | –1,6 |
| PARP1 | Poly (ADP-ribose) polymerase 1 | –1,6 |
| CASP8 | Caspase 8, apoptosis-related cysteine peptidase | –1,7 |
| CASP6 | Caspase 6, apoptosis-related cysteine peptidase | –1,8 |
CYB5R3—NADH-cytochrome b5 reductase 3.
Biological Validation of the Protein Array Data
To validate the biological significance of the apoptosis-associated protein alterations observed by protein array, the effect of CYB5R3 knock-down on apoptosis was investigated. M-4A4 cells transfected with CYB5R3 siRNA 1, 2, or control siRNA were examined using an ELISA-based cell death assay, which showed between 3.6- and 5.4-fold decrease in apoptosis of the CYB5R3 siRNA versus control siRNA transfected cells at day 6 following transfection (Fig. 6, p < .01), confirming the protein array data.
Fig. 6.
Knock-down of NADH-cytochrome b5 reductase 3 (CYB5R3) leads to decreased apoptosis in M-4A4 cells compared with cells transfected with control siRNA. CYB5R3 expression was knocked down using two CYB5R3 siRNA and the effect on apoptosis was measured using an ELISA-based cell death assay. CYB5R3 siRNA 1 versus control (ctr) siRNA exhibited 5.4-fold difference (p < .01), while CYB5R3 siRNA 2 versus siRNA control exhibited 3.5-fold difference (p < .01).
DISCUSSION
The ability of cancer cells to establish metastasis at distant sites is a complex process that involves interactions between cancer cells and surrounding tissues as well as cellular signaling within the cancer cells. The precise nature of these processes is poorly understood and is difficult to study in clinical samples. We used a cell model system that depicts the ability of tumor cells to extravasate, colonize, and form metastases at distant sites, and by quantitative, comparative proteomics of cytosolic, nuclear, and mitochondrial fractions, we identified seven intracellular proteins exhibiting significantly altered expression, including CYB5R3, which exhibited higher expression levels in the metastatic versus nonmetastatic cell lines.
CYB5R3 (NADH-cytochrome b5 reductase 3) is a membrane-bound enzyme found in the plasma membrane, mitochondrial outer membrane, endoplasmic reticulum, and other membranes of most cell types, while a soluble form is present in red cells (30). CYB5R3 participates in cholesterol biosynthesis, fatty acid homeostasis, and P-450-mediated hydroxylation of drugs and steroid hormones. Finally, CYB5R3 is involved in the trans-plasma membrane redox system that both protects against extracellular oxidants and prevents initiation of apoptosis by specific mechanisms (30, 31). CYB5R3 is believed to play a role in cellular aging (31), and Siendones and colleagues (32) showed that CYB5R3 is involved in protection against cellular senescence as the primary human fibroblasts aged. However, no studies have yet examined the role of CYB5R3 in cancer, including metastasis.
The higher expression level of CYB5R3 in M-4A4 versus NM-2C5 cells, as observed by our proteomic study, was validated using Western blotting and immunocytochemistry, and similar expression differences were observed at the transcriptional level. Immunohistochemical analysis of CYB5R3 expression in a large cohort of ERneg/PRneg breast cancer patients identified a significant correlation between high CYB5R3 expression and poor DFS and OS. Moreover, multivariate analysis revealed a 1.9-fold higher risk of poor outcome for ERneg/PRneg patients exhibiting strong staining of CYB5R3 compared with those expressing weak staining. A correlation between CYB5R3 expression and outcome did not reach significance in the ERneg/PRneg/HER2unamplified subgroup, likely due to the smaller sample size.
The role of CYB5R3 in metastatic M-4A4 cells was investigated by gene knock-down using transient transfection with two different siRNAs. An experimental metastasis assay based on injection of CYB5R3 siRNA- and control siRNA-transfected M-4A4 cells, respectively, into the tail vein of immunodeficient mice showed that the tumor burden in lungs was significantly lower in the mice injected with M-4A4 cells transfected with CYB5R3 siRNA versus control siRNA, indicating that the CYB5R3 knock-down in M-4A4 inhibits extravasation and/or colonization.
To illuminate the effect of CYB5R3 knock-down at the molecular level, cell lysates from CYB5R3 siRNA- and control siRNA-transfected M-4A4 cells, respectively, were analyzed using signaling protein arrays, analysis of which indicated a role for CYB5R3 in signaling associated with extravasation, apoptosis, and TGFβ and HIFα pathways. The biological validity of the protein array data was confirmed by a DNA/histone ELISA assay showing a 4.5-fold decrease of apoptosis in CYB5R3 siRNA-transfected cells compared with control transfected cells.
It should be noted that there is a continued debate as to whether the parental cell line of our cell line model, MDA-MB-435, originated from a breast cancer or a melanoma. MDA-MB-435 was originally derived from a pleural effusion of a patient with invasive ductal carcinoma (33), but the breast cancer origin was questioned when a microarray study showed that MDA-MB-435 had a gene expression pattern primarily resembling melanoma cells (34). However, other studies have shown that MDA-MB-435 expresses breast-specific markers and can be induced to secrete milk lipids, a characteristic unique to breast cancer cell lines, thereby confirming it is a breast cancer cell line (35). Montel and colleagues (36) later showed that surgically excised primary human breast cancers, as well as other human breast cancer cell lines, also expressed melanoma-related genes, demonstrating that this is a common phenomenon of breast carcinomas and confirming that MDA-MB-435 is of breast cancer origin. Whether or not MDA-MB-435 is a breast cancer cell line, the isogenic cell lines comprise a good representative model system for analyzing differences in cancer extravasation and colonization.
This study demonstrates the feasibility of mass spectrometry and other proteomics techniques to identify novel key pathways associated with the ability of cancer cells to colonize and establish metastasis in distant organs. The study was designed to focus on intracellular proteins, thereby increasing the likelihood of identifying proteins involved in intracellular processes allowing cancer cells to colonize in the new environment. This study complements our earlier findings on plasma membrane proteins involved in the same model (14, 15) and adds to the global picture of protein alteration associated with distinct steps of the metastatic process.
Supplementary Material
Acknowledgments
We thank Kate Rafn and Eva Christina Østerlund for expert technical assistance with LC-MS/MS; Lisbeth Mortensen and Ole Nielsen for excellent technical assistance with the immunohistochemical analysis; Henriette Vever, Annette Rasmussen, Lene Johansen, and Christina Pedersen for excellent technical assistance; Heidi Rosenqvist and Peter Mortensen for assistance with processing the MS-data; the PRIDE and ProteomeXchange Teams providing a repository for the dissemination of our data; and M. K. Occhipinti for editorial assistance.
Footnotes
Author contributions: R.R.L., R.L., M.G.T., and H.J.D. designed the research; R.R.L., T.D.C., M.G.T., J.N., and A.L. performed research; O.N.J. contributed new reagents or analytic tools; R.R.L., R.L., M.G.T., and A.L. analyzed data; R.R.L., R.L., M.G.T., and H.J.D. wrote the paper.
* This work was supported by the Danish Cancer Society, the Danish Cancer Research Foundation, A Race Against Breast Cancer, Sino-Danish Breast Cancer Research Centre, the Dagmar Marshall Foundation, the Gangsted Foundation, and Danish Center for Translational Breast Cancer research (DCTB). The bioimaging experiments reported herein were performed at the Danish Molecular Biomedical Imaging Center, a bioimaging research core facility at the University of Southern Denmark established by an equipment grant from the Danish Agency for Science Technology and Innovation, and by internal funding from the University of Southern Denmark.
 This article contains supplemental material Supplemental Data 1–6 and Supplemental Figs. 1 and 2.
1 The abbreviations used are:
- CYB5R3
- NADH-cytochrome b5 reductase 3
- DFS
- disease-free survival
- ER
- estrogen receptor
- HER2
- receptor tyrosine-protein kinase erbB-2
- LDHA
- L-lactate dehydrogenase A
- MAPK
- mitogen-activated protein kinase
- MMP
- matrix metallopeptidase
- Neg
- negative
- NPC1
- Niemann-pick c1 protein
- NRH2
- nucleolar RNA helicase 2
- OS
- overall survival
- Pos
- positive
- PR
- progesterone receptor.
REFERENCES
- 1. Cairns R. A., Khokha R., and Hill R. P. (2003) Molecular mechanisms of tumor invasion and metastasis: an integrated view. Curr. Mol. Med. 3, 659–671 [DOI] [PubMed] [Google Scholar]
- 2. Steeg P. S., and Theodorescu D. (2008) Metastasis: A therapeutic target for cancer. Nat. Clin. Pract. Oncol. 5, 206–219 [DOI] [PMC free article] [PubMed] [Google Scholar]
- 3. Brosh R., and Rotter V. (2009) When mutants gain new powers: News from the mutant p53 field. Nat. Rev. Cancer 9, 701–713 [DOI] [PubMed] [Google Scholar]
- 4. Brown C. J., Lain S., Verma C. S., Fersht A. R., and Lane D. P. (2009) Awakening guardian angels: Drugging the p53 pathway. Nat. Rev. Cancer 9, 862–873 [DOI] [PubMed] [Google Scholar]
- 5. Jiang P., Enomoto A., and Takahashi M. (2009) Cell biology of the movement of breast cancer cells: Intracellular signalling and the actin cytoskeleton. Cancer Lett. 284, 122–130 [DOI] [PubMed] [Google Scholar]
- 6. Parsons J. T., Horwitz A. R., and Schwartz M. A. (2010) Cell adhesion: Integrating cytoskeletal dynamics and cellular tension. Nat. Rev. Mol. Cell Biol. 11, 633–643 [DOI] [PMC free article] [PubMed] [Google Scholar]
- 7. Lurje G., and Lenz H. J. (2009) EGFR signaling and drug discovery. Oncology 77, 400–410 [DOI] [PubMed] [Google Scholar]
- 8. Urquidi V., Sloan D., Kawai K., Agarwal D., Woodman A. C., Tarin D., and Goodison S. (2002) Contrasting expression of thrombospondin-1 and osteopontin correlates with absence or presence of metastatic phenotype in an isogenic model of spontaneous human breast cancer metastasis. Clin. Cancer Res. 8, 61–74 [PubMed] [Google Scholar]
- 9. Goodison S., Kawai K., Hihara J., Jiang P., Yang M., Urquidi V., Hoffman R. M., and Tarin D. (2003) Prolonged dormancy and site-specific growth potential of cancer cells spontaneously disseminated from nonmetastatic breast tumors as revealed by labeling with green fluorescent protein. Clin. Cancer Res. 9, 3808–3814 [PubMed] [Google Scholar]
- 10. Schwirzke M., Evtimova V., Burtscher H., Jarsch M., Tarin D., and Weidle U. H. (2001) Identification of metastasis-associated genes by transcriptional profiling of a pair of metastatic versus non-metastatic human mammary carcinoma cell lines. Anticancer Res. 21, 1771–1776 [PubMed] [Google Scholar]
- 11. Euer N., Schwirzke M., Evtimova V., Burtscher H., Jarsch M., Tarin D., and Weidle U. H. (2002) Identification of genes associated with metastasis of mammary carcinoma in metastatic versus non-metastatic cell lines. Anticancer Res. 22, 733–740 [PubMed] [Google Scholar]
- 12. Goodison S., Yuan J., Sloan D., Kim R., Li C., Popescu N. C., and Urquidi V. (2005) The RhoGAP protein DLC-1 functions as a metastasis suppressor in breast cancer cells. Cancer Res. 65, 6042–6053 [DOI] [PMC free article] [PubMed] [Google Scholar]
- 13. Thomsen K. G., Terp M. G., Lund R. R., Sokilde R., Elias D., Bak M., Litman T., Beck H. C., Lyng M. B., and Ditzel H. J. (2015) miR-155, identified as anti-metastatic by global miRNA profiling of a metastasis model, inhibits cancer cell extravasation and colonization in vivo and causes significant signaling alterations. Oncotarget (Epub ahead of print) [DOI] [PMC free article] [PubMed] [Google Scholar]
- 14. Lund R., Leth-Larsen R., Jensen O. N., and Ditzel H. J. (2009) Efficient isolation and quantitative proteomic analysis of cancer cell plasma membrane proteins for identification of metastasis-associated cell surface markers. J. Proteome Res. 8, 3078–3090 [DOI] [PubMed] [Google Scholar]
- 15. Leth-Larsen R., Lund R., Hansen H. V., Laenkholm A. V., Tarin D., Jensen O. N., and Ditzel H. J. (2009) Metastasis-related plasma membrane proteins of human breast cancer cells identified by comparative quantitative mass spectrometry. Mol. Cell. Proteomics 8, 1436–1449 [DOI] [PMC free article] [PubMed] [Google Scholar]
- 16. Karhemo P. R., Ravela S., Laakso M., Ritamo I., Tatti O., Mäkinen S., Goodison S., Stenman U. H., Hölttä E., Hautaniemi S., Valmu L., Lehti K., and Laakkonen P. (2012) An optimized isolation of biotinylated cell surface proteins reveals novel players in cancer metastasis. J. Proteomics 77, 87–100 [DOI] [PMC free article] [PubMed] [Google Scholar]
- 17. Kreunin P., Yoo C., Urquidi V., Lubman D. M., and Goodison S. (2007) Differential expression of ribosomal proteins in a human metastasis model identified by coupling 2-D liquid chromatography and mass spectrometry. Cancer Genomics Proteomics 4, 329–339 [PMC free article] [PubMed] [Google Scholar]
- 18. Kreunin P., Urquidi V., Lubman D. M., and Goodison S. (2004) Identification of metastasis-associated proteins in a human tumor metastasis model using the mass-mapping technique. Proteomics 4, 2754–2765 [DOI] [PMC free article] [PubMed] [Google Scholar]
- 19. Kreunin P., Yoo C., Urquidi V., Lubman D. M., and Goodison S. (2007) Proteomic profiling identifies breast tumor metastasis-associated factors in an isogenic model. Proteomics 7, 299–312 [DOI] [PMC free article] [PubMed] [Google Scholar]
- 20. Xie X., Feng S., Vuong H., Liu Y., Goodison S., and Lubman D. M. (2010) A comparative phosphoproteomic analysis of a human tumor metastasis model using a label-free quantitative approach. Electrophoresis 31, 1842–1852 [DOI] [PMC free article] [PubMed] [Google Scholar]
- 21. Rappsilber J., Ishihama Y., and Mann M. (2003) Stop and go extraction tips for matrix-assisted laser desorption/ionization, nanoelectrospray, and LC/MS sample pretreatment in proteomics. Anal. Chem. 75, 663–670 [DOI] [PubMed] [Google Scholar]
- 22. Callesen A. K., Mohammed S., Bunkenborg J., Kruse T. A., Cold S., Mogensen O., Christensen R., Vach W., Jørgensen P. E., and Jensen O. N. (2005) Serum protein profiling by miniaturized solid-phase extraction and matrix-assisted laser desorption/ionization mass spectrometry. Rapid Commun. Mass Spectrom. 19, 1578–1586 [DOI] [PubMed] [Google Scholar]
- 23. Vizcaíno J. A., Deutsch E. W., Wang R., Csordas A., Reisinger F., Ríos D., Dianes J. A., Sun Z., Farrah T., Bandeira N., Binz P. A., Xenarios I., Eisenacher M., Mayer G., Gatto L., Campos A., Chalkley R. J., Kraus H. J., Albar J. P., Martinez-Bartolomé S., Apweiler R., Omenn G. S., Martens L., Jones A. R., and Hermjakob H. (2014) ProteomeXchange provides globally coordinated proteomics data submission and dissemination. Nat. Biotechnol. 32, 223–226 [DOI] [PMC free article] [PubMed] [Google Scholar]
- 24. Schandorff S., Olsen J. V., Bunkenborg J., Blagoev B., Zhang Y., Andersen J. S., and Mann M. (2007) A mass spectrometry-friendly database for cSNP identification. Nat. Methods 4, 465–466 [DOI] [PubMed] [Google Scholar]
- 25. Elias J. E., Gibbons F. D., King O. D., Roth F. P., and Gygi S. P. (2004) Intensity-based protein identification by machine learning from a library of tandem mass spectra. Nat. Biotechnol. 22, 214–219 [DOI] [PubMed] [Google Scholar]
- 26. Mortensen P., Gouw J. W., Olsen J. V., Ong S. E., Rigbolt K. T., Bunkenborg J., Cox J., Foster L. J., Heck A. J., Blagoev B., Andersen J. S., and Mann M. (2010) MSQuant, an open source platform for mass spectrometry-based quantitative proteomics. J. Proteome Res. 9, 393–403 [DOI] [PubMed] [Google Scholar]
- 27. Bloom H. J., and Richardson W. W. (1957) Histological grading and prognosis in breast cancer; a study of 1409 cases of which 359 have been followed for 15 years. Br. J. Cancer 11, 359–377 [DOI] [PMC free article] [PubMed] [Google Scholar]
- 28. Punt C. J., Buyse M., Köhne C. H., Hohenberger P., Labianca R., Schmoll H. J., Påhlman L., Sobrero A., and Douillard J. Y. (2007) Endpoints in adjuvant treatment trials: A systematic review of the literature in colon cancer and proposed definitions for future trials. J. Nat. Cancer Inst. 99, 998–1003 [DOI] [PubMed] [Google Scholar]
- 29. Lundholt B. K., Briand P., and Lykkesfeldt A. E. (2001) Growth inhibition and growth stimulation by estradiol of estrogen receptor transfected human breast epithelial cell lines involve different pathways. Breast Cancer Res. Treat. 67, 199–214 [DOI] [PubMed] [Google Scholar]
- 30. Elahian F., Sepehrizadeh Z., Moghimi B., and Mirzaei S. A. (2014) Human cytochrome b5 reductase: structure, function, and potential applications. Crit. Rev. Biotechnol. 34, 134–143 [DOI] [PubMed] [Google Scholar]
- 31. de Cabo R., Siendones E., Minor R., and Navas P. (2010) CYB5R3: A key player in aerobic metabolism and aging? Aging 2, 63–68 [DOI] [PMC free article] [PubMed] [Google Scholar]
- 32. Siendones E., SantaCruz-Calvo S., Martín-Montalvo A., Cascajo M. V., Ariza J., López-Lluch G., Villalba J. M., Acquaviva-Bourdain C., Roze E., Bernier M., de Cabo R., and Navas P. (2014) Membrane-bound CYB5R3 is a common effector of nutritional and oxidative stress response through FOXO3a and Nrf2. Antioxidants Redox Signaling 21, 1708–1725 [DOI] [PMC free article] [PubMed] [Google Scholar]
- 33. Cailleau R., Olivé M., and Cruciger Q. V. (1978) Long-term human breast carcinoma cell lines of metastatic origin: Preliminary characterization. In Vitro 14, 911–915 [DOI] [PubMed] [Google Scholar]
- 34. Ross D. T., Scherf U., Eisen M. B., Perou C. M., Rees C., Spellman P., Iyer V., Jeffrey S. S., Van de Rijn M., Waltham M., Pergamenschikov A., Lee J. C., Lashkari D., Shalon D., Myers T. G., Weinstein J. N., Botstein D., and Brown P. O. (2000) Systematic variation in gene expression patterns in human cancer cell lines. Nat. Genet. 24, 227–235 [DOI] [PubMed] [Google Scholar]
- 35. Sellappan S., Grijalva R., Zhou X., Yang W., Eli M. B., Mills G. B., and Yu D. (2004) Lineage infidelity of MDA-MB-435 cells: Expression of melanocyte proteins in a breast cancer cell line. Cancer Res. 64, 3479–3485 [DOI] [PubMed] [Google Scholar]
- 36. Montel V., Suzuki M., Galloy C., Mose E. S., and Tarin D. (2009) Expression of melanocyte-related genes in human breast cancer and its implications. Differentiation 78, 283–291 [DOI] [PubMed] [Google Scholar]
- 37. Price J. E., and Zhang R. D. (1990) Studies of human breast cancer metastasis using nude mice. Cancer Metastasis Rev. 8, 285–297 [DOI] [PubMed] [Google Scholar]
- 38. Victor R., Chauzy C., Girard N., Gioanni J., d'Anjou J., Stora De Novion H., and Delpech B. (1999) Human breast-cancer metastasis formation in a nude-mouse model: Studies of hyaluronidase, hyaluronan and hyaluronan-binding sites in metastatic cells. Int. J. Cancer 82, 77–83 [DOI] [PubMed] [Google Scholar]
- 39. Shah S. N., Cope L., Poh W., Belton A., Roy S., Talbot C. C. Jr., Sukumar S., Huso D. L., and Resar L. M. (2013) HMGA1: A master regulator of tumor progression in triple-negative breast cancer cells. PLoS ONE 8, e63419. [DOI] [PMC free article] [PubMed] [Google Scholar]
- 40. Quail D. F., Zhang G., Walsh L. A., Siegers G. M., Dieters-Castator D. Z., Findlay S. D., Broughton H., Putman D. M., Hess D. A., and Postovit L. M. (2012) Embryonic morphogen nodal promotes breast cancer growth and progression. PLoS ONE 7, e48237. [DOI] [PMC free article] [PubMed] [Google Scholar]
- 41. Mukhopadhyay R., Theriault R. L., and Price J. E. (1999) Increased levels of alpha6 integrins are associated with the metastatic phenotype of human breast cancer cells. Clin. Exp. Metastasis 17, 325–332 [DOI] [PubMed] [Google Scholar]
Associated Data
This section collects any data citations, data availability statements, or supplementary materials included in this article.