

Abstract
The dried blood spot (DBS) methodology provides a minimally invasive approach to sample collection and enables room-temperature storage for most analytes. DBS samples have successfully been analyzed by liquid chromatography multiple reaction monitoring mass spectrometry (LC/MRM-MS) to quantify a large range of small molecule biomarkers and drugs; however, this strategy has only recently been explored for MS-based proteomics applications. Here we report the development of a highly multiplexed MRM assay to quantify endogenous proteins in human DBS samples. This assay uses matching stable isotope-labeled standard peptides for precise, relative quantification, and standard curves to characterize the analytical performance. A total of 169 peptides, corresponding to 97 proteins, were quantified in the final assay with an average linear dynamic range of 207-fold and an average R2 value of 0.987. The total range of this assay spanned almost 5 orders of magnitude from serum albumin (P02768) at 18.0 mg/ml down to cholinesterase (P06276) at 190 ng/ml. The average intra-assay and inter-assay precision for 6 biological samples ranged from 6.1–7.5% CV and 9.5–11.0% CV, respectively. The majority of peptide targets were stable after 154 days at storage temperatures from −20 °C to 37 °C. Furthermore, protein concentration ratios between matching DBS and whole blood samples were largely constant (<20% CV) across six biological samples. This assay represents the highest multiplexing yet achieved for targeted protein quantification in DBS samples and is suitable for biomedical research applications.
The dried blood spot (DBS)1 methodology provides several advantages over traditional plasma or serum samples throughout the entire pre-analytical workflow including sample collection, transportation, and storage (1, 2) These blood samples are typically generated using a small sterile lancet to prick the skin and then spotting a drop onto a collection card. Therefore, DBS sampling is less invasive than venipuncture and does not require a trained phlebotomist. This sampling approach also does not require time-sensitive centrifugation, which is crucial for plasma and serum samples to prevent degradation. Many analytes have been determined to be stable in the DBS format at room temperature, eliminating the cost associated with cold-chain logistics for sample transportation and storage. These considerations are also important for sample collection in remote locations that may be without reliable access to a centrifuge and/or a freezer designated for biohazardous materials. Quantitative bioanalytical methods using the DBS methodology have been developed for genomic, metabolomic, and proteomic applications including newborn screening (3, 4), therapeutic drug monitoring (5, 6), toxicology and drugs of abuse (7, 8), viral disease management (9, 10), and many others (2, 11).
Targeted MS, in particular selected/multiple reaction monitoring (SRM/MRM) using internal standards, enables the rapid development of quantitative assays with high specificity, precision, and robustness (12–15). The integration of DBS sampling with MRM is well-established for quantifying a wide range of small molecules (16–18). This is now the standard analytical approach for population-wide screening of newborns for errors in metabolism by targeting amino acids, fatty acid acylcarnitines, and organic acid acylcarnitines (3, 4). DBS with MRM is also emerging as an important analytical tool throughout pre-clinical and clinical small-molecule drug development and monitoring (16, 17, 19–21). Furthermore, Zukunft et al. recently demonstrated the high multiplexing capabilities of MRM by using 2 methods to quantify 188 metabolites in DBS samples, including acylcarnitines, amino acids, biogenic amines, free carnitine, glycerophospholipids, hexoses, lysophosphatidylcholines, phosphatidylcholines, and sphingolipids (22).
Although DBS with MRM is well-established in small molecule applications, there are only a handful of reports showing the use of this approach to quantify endogenous proteins (23). Daniel et al. measured the ratio between hemoglobin δ and β to screen for β-thalassemia (24). Boemer et al. measured the relative ratios of several hemoglobin variants (including HbS, HbC, HbE, and others) to help diagnose Sickle Cell disease and other clinically relevant hemoglobinopathies (25). The same group then screened >40,000 newborns in Belgium and successfully detected 16 patients with severe hemoglobin disorders (26). Moats et al. used a similar approach to screen >13,000 newborns in the UK for Sickle Cell disease and correctly identified all seven disease occurrences (27). Because hemoglobin is the most abundant protein in whole blood (∼150 mg/ml), these four studies achieved adequate sensitivity by simply infusing the trypsin digested samples into a triple-quadrupole MS. To move beyond hemoglobin, additional sensitivity can be provided by using liquid chromatography (LC) separations coupled online with MRM. deWilde et al. used LC/MRM-MS to quantify ceruloplasmin as a screen for Wilson's disease (28). Recently, Cox et al. reported LC/MRM-MS methods for quantifying insulin-like growth facter-1 for the detection of human growth hormone abuse in sports (29, 30).
Our group reported the first LC/MRM-MS assay to quantify multiple endogenous proteins in DBS samples (31). In that exploratory study, we selected a small test panel of 60 high-abundance proteins and were ultimately able to quantify 37 proteins using stable isotope-labeled standard (SIS) peptides and standard curves. In this work, we describe method refinement and further evaluation of LC/MRM-MS for quantifying endogenous proteins in human DBS samples. A more comprehensive approach has now been taken to evaluate sensitivity and suitability, as the initial target panel has been increased to 393 proteins. The protocol has also been modified so that all liquid handling steps in the sample preparation protocol are now automated in a 96-well format for improved sample throughput. Standard curves using SIS peptides were produced using a pooled patient sample, and assay precision was determined in biological samples from six different individuals. In addition, we have provided a detailed discussion of the quantification results from multiple peptides per protein, a comparison to measured protein concentrations in whole blood, an analyte stability assessment at various storage temperatures, and an evaluation of volumetric spotting devices. Ultimately, we have developed a multiplexed LC/MRM-MS assay to quantify 97 proteins in DBS samples that is suitable for biomedical research applications.
EXPERIMENTAL PROCEDURES
Whole Blood Samples
All human whole blood samples were purchased from a commercial vendor (Bioreclamation, Westbury, NY). This vendor collected intravenous blood from healthy, nonfasting individuals into K2-EDTA coated plastic tubes (367863, Vacutainer Plus, BD Biosciences, San Jose, CA) with signed donor consent under Institutional Review Board protocol 2010–017, Prospective Collection of Normal Control Samples for Research. A total of 14 different whole blood samples were used in these sets of experiments, and these are identified as follows: Pool 1 (P1), Pool 2 (P2), and Samples 1–12 (S1–S12). S1–S6 indicate the 6 individual whole blood samples that comprise P2. The sex and age of each donor is provided in supplemental Table S1. All samples were stored at 4 °C and shipped cold but not frozen. Then 1 ml aliquots of these samples were then stored at 4 °C (fresh) or −80 °C (frozen) as stated in the text. All fresh whole blood samples were used within 8 days.
Target Protein and Peptide Selection
The initial target panel for this DBS assay was composed of 912 peptides, corresponding to 393 human proteins according to the UniProtKB/Swiss-Prot database (32). Supplemental Table S2 lists all proteins and peptides in the initial panel. This panel of target proteins was selected from our in-house library of available SIS peptides that have been developed to target many potential biomarkers of clinically relevant conditions (i.e. lung cancer and cardiovascular disease) in various biofluids including cerebrospinal fluid, (33) plasma, (34, 35) and urine (36). From this list, 68 proteins have been reported as FDA-cleared or -approved protein analytes in serum or plasma (see supplemental Table S2) (37). Furthermore, 38 additional proteins are offered by at least 1 of the 3 major reference laboratories or listed within the Directory of Rare Analyses (37). Therefore, there is interest in developing quantitative assays for several of these proteins in DBS samples for future evaluation of their diagnostic value for patients in remote locations. We have previously reported our approaches for selecting and synthesizing optimal SIS peptides for each target protein (38). The older peptides in this library were selected manually whereas the recent additions were chosen using automated software (PeptidePicker) that we have made freely available to the scientific community (39).
SIS Peptide Synthesis
All SIS peptides were synthesized in-house (Prelude or Overture, Protein Technologies, Tucson, AZ) using a C-terminal heavy arginine [13C6, 15N4] or lysine ([13C6] or [13C6, 15N2]) amino acid residue (Cambridge Isotope Laboratories, Tewksbury, MA). Peptides were purified by reversed-phase HPLC before characterization by MALDI, amino acid analysis, and capillary zone electrophoresis. A detailed overview of our peptide synthesis and characterization procedures has previously been reported (38).
Sample Preparation
The sample preparation was adapted from our earlier method (31). A 1.5 ml vial (MCT-150-l-C, Axygen, Scientific, Union City, CA) containing whole blood was rotated on an inversion mixer for 5 min and 15 μl was spotted onto DBS collection cards (903 Protein Saver Card, Whatman, GE Healthcare Life Sciences, Pittsburgh, PA). All spots were created using an electronic laboratory pipette (Proline 5–100 μl, formerly BioHit, now Sartorius Corporation, Bohemia, NY), except were alternative volumetric spotting devices were evaluated (see Volumetric Spotting Devices). Samples were dried for 3 h in a biosafety cabinet at room temperature and were then stored in polyethylene plastic bags with desiccant (61161–319, sponge humidity indicating, VWR International, Edmonton, Canada) and a humidity indicator card capable of measuring 10%, 20%, 30%, and 40% humidity (4HIC100, VWR). All DBS samples were stored at room temperature overnight unless otherwise stated in the text (see Stability). The entire DBS sample was excised from the collection card and placed in a 2-ml 96-well microplate (P-DW-20-C, Axygen). All liquid handling steps in the sample preparation were performed on a Tecan Freedom EVO 150 liquid handling robot equipped with an 8-channel multi-pipetting arm. Each DBS sample was extracted with 970 μl solution of 758 μl of 25 mm ammonium bicarbonate, 113 μl of 10% (w/v) sodium deoxycholate, and 99 μl of 5 mm tris(2-carboxyethyl)phosphine (Thermo Scientific, Waltham, MA). The extraction was performed at 60 °C for 1 h while vortexing at 700 rpm (Thermomixer with microplate adaptor, Eppendorpf Canada Ltd., Mississauga, ON, Canada). Then 250 μl of extract was transferred to a 1 ml 96-well microplate (P-DW-11-C, Axygen). This aliquot was alkylated with 28 μl of 0.1 m iodoacetamide for 30 min at 37 °C and quenched with 31 μl of 0.1 m dithiothreitol for 30 min at 37 °C. Next, 30 μl of trypsin (TPCK-treated trypsin, Worthington Biochemical Corporation, Lakewood, NJ) at 0.44 μg/μl in 25 mm ammonium bicarbonate was added and the digestion was allowed to proceed for 16 h at 37 °C. In a separate 300 μl 96-well microplate (PCR-96-FLT-C), the following solutions were combined sequentially: 45.6 μl of 2% formic acid, 36.4 μl of a SIS peptide mixture, and 117.5 μl of the digested DBS sample. An equimolar SIS peptide mixture was used for interference screening (see Interference Screening) and a balanced SIS mixture was used for all other experiments (see Standard Curves and Precision). The microplate was vortexed to thoroughly mix the solutions, and then centrifuged for 20 min at 3000 rpm to pellet the acid-insoluble sodium deoxycholate. An aliquot of the supernatant was then desalted by solid-phase extraction (Oasis HLB μElution plate, Waters Corporation, Milford, MA) using the following procedure: condition with 0.5 ml methanol, equilibrate with 0.5 ml water, sample loading with 250 μl of 0.1% formic acid and 133.3 μl of digest, first wash with 0.5 ml of water, second wash with 0.5 ml of water, and sample elution with 70 μl of 0.1% formic acid in 50% acetonitrile into a new 96-well plate (951020401, Eppendorf). Samples were then frozen, lyophilized overnight, and stored at −80 °C until analysis. Samples were rehydrated with 60 μl of 0.1% formic acid in water for LC/MRM-MS.
LC/MRM-MS Analysis
Peptides were separated using UHPLC (1290 Infinity, Agilent Technologies, Santa Clara, CA) with a reversed-phase column (Zorbax Eclipse Plus Rapid Resolution High Definition, 2.1 mm i.d. × 150 mm long, packed with 1.8 μm C18 particles, Agilent). Mobile phase A was composed of 0.1% formic acid in water whereas mobile phase B was 0.1% formic acid in acetonitrile. The flow rate was 400 μl/min and the column was maintained at 50 °C using a column heater. The LC gradient used the following steps (time, %B): 0 min, 2.7%; 1.5 min, 6.3%; 16.0 min, 13.5%; 18.0 min, 13.8%; 33.0 min, 22.5%, 38.0 min, 40.5%, 39 min, 81.0%; 42.9 min, 81.0%; 43.0 min, 2.7%. The sample injection volume was 15 μl which corresponds to 224 nL of the original whole blood sample. The UHPLC system was interfaced with a triple quadrupole (QQQ) mass spectrometer (Agilent 6490) using a standard-flow Jet Stream electrospray source operated in positive ion mode. Additional parameters are as follows: capillary voltage 3.5 kV, cone voltage 300 V, drying gas flow rate 15 L/min at 250 °C, nebulizer gas pressure 30 PSI at 250 °C, and unit resolution for Q1 and Q3. All data was acquired using scheduled MRM with 1.5 min retention time windows and a 700 ms total cycle time. For the interference screening experiments described in Interference Screening, three transitions were monitored for the light and heavy versions of the 912 peptides. The total number of transitions was 5742 and these were divided among 8 different acquisition methods as designated in supplemental Table S3. For all subsequent experiments, two transitions were monitored for both the light and heavy forms of each peptide in a single acquisition method. This was done to reduce the number of concurrent transitions while maintaining high sample throughput. Therefore, the single acquisition method used for generating standard curves for the 209 peptides described in Standard Curves was composed of 836 transitions as provided in supplemental Table S4. Afterward, the 173 peptides that were successfully quantified (see Results, Standard Curves) were monitored in all remaining experiments (see sections Precision through Volumetric Spotting Devices) and the transition list is shown in supplemental Table S5. Data was initially analyzed using MassHunter (version B.07.00, build 7.0.457.0, Agilent) to ensure the natural and SIS peaks were correctly integrated and then exported to Qualis-SIS for further analysis (see Standard Curves) (40).
Interference Screening
The three most abundant transitions for each peptide were screened for chemical interference in P1 (previously frozen) DBS samples using LC/MRM-MS. For interference screening, an equimolar SIS mixture was created which contains each of the 912 SIS peptides at 30.9 fmol/μl. During sample preparation, 36.4 μl of this equimolar SIS mixture (1125 fmol of each peptide) was spiked into an equivalent of 1.34 μl of extracted whole blood (see Sample Preparation). The amount injected on-column for MRM analysis was 188 fmol of each SIS peptide in an equivalent of 224 nL of whole blood. Eight replicate samples were pooled after solid-phase extraction. Data was acquired in triplicate for the following three conditions: the SIS peptide in buffer, the SIS peptide in plasma, and the natural peptide in plasma. Because of the large number of peptides in the initial panel (912 peptides), this interference-screening procedure was accomplished by sequentially analyzing the same sample with 8 different MRM acquisition methods that monitored roughly 112 peptides each. We then compared the average peak area ratios between multiple transitions from the same peptide (transition 1 versus transition 2, transition 1 versus transition 3, transition 2 versus transition 3) across these 3 conditions. Because peptide fragmentation within QQQ instruments is very reproducible, substantial changes in these ratios indicates chemical interference in at least one of the MRM transitions. Peak area ratios with a coefficient of variation (CV) of <20% across the 3 conditions were considered to be free of chemical interference. All peptide targets that did not meet this criteria were now removed from assay development. In addition, peptides with poor peak shape as observed in extracted ion chromatograms were also removed from the panel.
Standard Curves
Standard curves were generated by spiking varying amounts of SIS peptides into extracted DBS samples (P1, previously frozen) to hold the background matrix constant. For standard curves, a “balanced” SIS peptide mixture was created so that concentration of each SIS peptide was ∼10-times greater than the corresponding natural (NAT) peptide in the digested sample as observed in previous experiment (Interference Screening). This balanced SIS peptide mixture was then diluted using serial dilutions with a factor 2.25 to create 8 concentration levels for the standard curve (concentration levels A to H, with A being the most concentrated). Therefore the curve spanned a 391-fold range and the relative peak area ratio (NAT/SIS) for each peptide was approximately equal at concentration level D. The natural peptide is generated by sample digestion and no additional natural peptide was spiked into any samples. For each concentration level, 3 DBS samples were prepared and analyzed in full-process analytical replicates. In this work, a “full-process analytical replicate” refers to the entire workflow which includes the spotting, drying, and extraction steps in the sample preparation. Supplemental Tables S6 and S7 list the amount of each SIS peptide added during sample preparation and the amount injected on column, respectively. Data analysis for the standard curve performed by exporting the peak area ratios from MassHunter into our automated software (Qualis-SIS) (40). The weighting for linear regression was set to 1/x2. Inclusion criteria for each concentration level was a precision of <20% CV and an average accuracy between 80–120% among the three concentration level replicates. The “low-to-high” removal strategy was selected for concentration levels that were outside the average accuracy tolerance. In addition, a minimum of three qualified concentration levels was required for each curve, no concentration levels could be “skipped” within the curve, and the endogenous peptide concentrations in the reference sample must lie within the linear standard curve. The lower limit of quantification (LLOQ) was defined as the lowest concentration level on the curve that satisfied these criteria. The peptide fragment ion with the largest dynamic range was designated as the quantifier transition for the peptide.
Precision
Analytical precision was determined by three full-process analytical replicates, prepared and analyzed on 3 consecutive days. For this experiment and all others (see Sections Fresh versus Previously Frozen through Volumetric Spotting Devices), the amount of the balanced SIS peptide mixture used was approximately equal to endogenous peptide in the digested DBS sample (almost identical to level D from the standard curve). This amount of SIS peptide added during sample preparation and the amount injected on column is provided in supplemental Tables S6 and S7. Otherwise all samples were then prepared as previously described in Sample Preparation. Intra-assay precision was defined as the peptide concentration CV for the three runs on the same day and then averaged across the 3 days. The inter-assay precision was defined as the peptide concentration CV for the same run on 3 days (e.g. Day 1, Run 1; Day 2, Run 1; and Day 3, Run 1) and then averaged across the 3 runs. This experiment was performed for 6 individual fresh whole-blood samples (S1-S6).
Fresh versus Previously Frozen
DBS samples were prepared in 3 full-process analytical replicates from whole blood that was either fresh or previously frozen for 1 day at −80 °C. The peptide concentrations for the 3 replicates were averaged and the percent difference between the fresh and previously frozen sample was calculated. This experiment was performed for six individual whole blood samples (S1-S6).
Stability
A total of 84 DBS samples were spotted at the same time using a pooled whole-blood sample (P2, fresh) and stored at four temperatures (−20 °C, 4 °C, RT, 37 °C). Three DBS samples were stored in separate polyethylene bags for each of the 7 time points (Day 1, 2, 7, 16, 29, 77, 154) for each temperature, to prevent repeated exposure to humidity. At each time point, the 3 corresponding DBS samples were prepared and analyzed by LC/MRM-MS. The replicates were averaged and the percent difference was calculated for each time point, referenced to the peptide concentration observed on Day 1.
DBS versus Whole Blood
Matching whole blood and DBS samples were prepared in 3 full-process analytical replicates. For the whole blood samples, a 15 μl aliquot was added directly to the extraction solution in the 96-well microplate. Confirmation of red blood cell lysis following the extraction step was performed by centrifugation of all DBS and whole blood sample extracts at 600 × g for 10 min. As expected, there was no red blood cell pellet observed visually. The peptide concentrations from the replicates were averaged and the DBS:whole blood ratio for each peptide was calculated. This experiment was performed for six individual fresh whole-blood samples (S1-S6).
Volumetric Spotting Devices
DBS samples were prepared in 3 full-process analytical replicates using three different spotting devices: Proline 5–100 μl (formerly BioHit, now Sartorius Corporation), 15 μl Microsafe (Safe-Tec, Ivyland PA), and 15 μl Microcaps (Drummond, Broomall, PA). For the MicroSafe and Drummond devices, 100 μl of whole blood was initially pipetted into the cap of a 1.5 ml vial (MCT-150-l-C, Axygen) using a standard laboratory pipette. Then the MicroSafe or Drummond device was used to transfer exactly 15 μl unto the DBS collection card and a new device was used for each replicate. The precision (%CV) was then calculated for each peptide concentration across the three replicates for each device. This experiment was repeated for 6 individual fresh whole blood samples (S7-S12).
RESULTS AND DISCUSSION
Sample Preparation
For many current clinical applications, DBS samples are generated by pricking the patient's skin and spotting a drop of blood directly onto a collection card. Only the center of the DBS is later punched out for analysis, so the volume of blood is dependent on the punch size and uniform spreading of the sample across the collection card. The punch size is easily controlled, but the uniform spreading of the sample may depend on the volume of blood spotted, the hematocrit, and any chromatographic interactions with the card. A more accurate alternative is to generate DBS samples using known volumes of blood and to then remove the entire DBS for analysis (41, 42). In preclinical applications, it is common to transfer blood to the collection card using a narrow bore capillary tube (with 10 and 20 μl being most common) (20). Disposable capillary devices are commercially available at nominal cost (approximately $0.25 USD) and fill via capillary action to accurate predetermined volumes. For example, Li et al. demonstrated that capillary devices from two manufacturers (Drummond and Safe-Tec) were both capable of precisely generating DBS samples using only 5 μl of blood (<5% CV) (43). It is possible that the use of a transfer capillary may be difficult for inexperienced patients at home but this method should certainly be feasible for professionally trained staff, such as a general nurse in a remote clinic location (41, 42). We therefore have chosen to use volumetric spotting and “entire spot” analysis to eliminate any potential bias because of nonuniform spot spreading. A laboratory pipette was used to create DBS samples during assay development and we have compared its performance with alternative volumetric spotting devices in Results, Volumetric spotting Devices.
Detectability
Multiple MRM transitions for each peptide were screened by LC/MRM-MS to confirm detection of the endogenous target peptide and to determine if chemical interference was present. In this work, only peptides that passed our rigorous chemical-interference screening (see Interference Screening) were considered to be “detected” and continued for assay development. From the initial panel of 912 peptides (393 proteins), a total of 209 peptides (110 proteins) were detected in DBS samples as shown in supplemental Table S2 (column F). We were not surprised that many peptides in the initial target panel were not detected within DBS samples. These SIS peptides were originally created for MRM assay development in a wide range of human biological samples including plasma, cerebrospinal fluid, urine, or cell lysates. Their concentration in whole blood may be well below the limit of detection of our current LC/MRM-MS method. For example, our initial protein panel included interleukin-6 (P05231) which was reported to be <4 pg/ml in human DBS samples as measured by a single-plex immunoassay (44). Our objective was to develop a highly-multiplexed assay and we have not optimized the sample preparation conditions independently for each target protein. Further optimization may enable LC/MRM-MS assays to be successfully developed for high-value targets. For example, we were not able to detect tryptic peptides from insulin-like growth factor-1(P05019) in digested DBS samples. However, Cox and coworkers developed an elegant analytical method for this 7.6 kDa protein by using an acetonitrile precipitation step to remove most background proteins (29, 30). In addition, detectability could be improved by using multidimensional separations or immunoaffinity enrichment prior to LC/MRM-MS (45–47).
Standard Curves
Standards curves were successfully generated for 83% of the detected peptide targets (173 peptides, 99 proteins) as shown in supplemental Table 2 (column G). This represents the largest reported number of proteins that have been quantified in DBS by targeted MS. Fig. 1 shows an extracted ion chromatogram for the 173 quantified peptide targets, with NAT peptides shown in blue and SIS peptides shown in red. Supplemental Table S8 provides the analytical metrics for each peptide including: LLOQ in fmol/μl, protein LLOQ in ng/ml, linear dynamic range, coefficient of determination (R2), endogenous concentration in fmol/μl, and endogenous protein concentration in ng/ml. Fig. 2 shows representative standard curves for a peptide from transthyretin (P02766, determined endogenous protein concentration 79 μg/ml) and neutrophil gelatinase-associated lipocalin (P80188, determined endogenous protein concentration 377 ng/ml). Note that the balanced SIS mixture (see Standard Curves) enabled the endogenous peptide concentration to be approximately centered on the standard curve, as indicated in Fig. 2 where the relative response value equals 1. Overall, the assay linearity was excellent, as demonstrated by a wide linear dynamic range (average 204-fold) with strong correlation (average R2 value = 0.986). Note that a total of 20 of the 173 quantified peptides had a linear dynamic range of less than 50-fold; therefore, further assay optimization may be necessary for certain targets. Ultimately, the specific assay requirements are protein dependent and will be dictated by the intended biological application. As shown in Fig. 3, the overall dynamic range of the assay spanned almost five orders of magnitude, from albumin at 18 mg/ml down to cholinesterase at 190 ng/ml. For proteins quantified by multiple peptides, the peptide that resulted in the highest protein concentration is plotted in this figure. A detailed discussion of the agreement between multiple peptide per protein is included in the next section.
Fig. 1.

Multiplexed Analysis. Extracted ion chromatograms for the 173 peptides (99 proteins) initially quantified by LC/MRM-MS in DBS samples. Natural (NAT) peptides are shown in blue and SIS peptides are shown in red. A total of 4 peptides were later removed during assay refinement (see Results, Final Assay): IPTTFENGR from apolipoprotein D (P05090), AASGTQNNVLR from complement component C7 (P10643), LSSGLVTAALYGR from biotinidase (P43251) and VAVNDAHLLQYNHR from galectin-3 (P17931). Because Apolipoprotein D and galectin-3 also were quantified by other peptides, the final assay consisted of 169 peptides targeting 97 proteins.
Fig. 2.

Standard Curves. Representative standard curves for protein quantification. The relative response is plotted as (SIS/NAT) and the dashed lines represent the 95% confidence interval. A, Transthyretin, ALGISPFHEHAEVVFTANDSGPR, endogenous protein concentration 79 μg/ml B, Neutrophil gelatinase-associated lipocalin, ITLYGR, endogenous protein concentration 377 ng/ml).
Fig. 3.
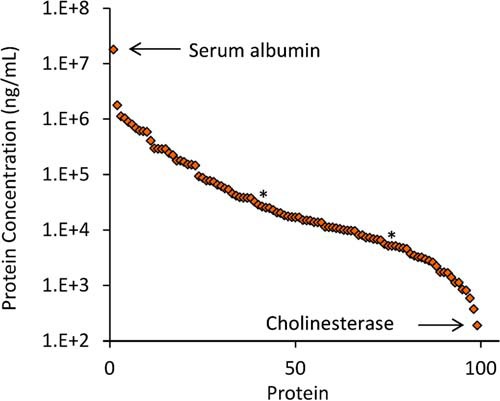
Overall Dynamic Range. The determined concentrations for the 99 proteins quantified spanned almost 5 orders of magnitude. Two proteins marked by an asterisk (*) - biotinidase and complement component C7 - were later removed from the assay because of poor precision or stability (see Results, Final Assay). Therefore the final analytical assay quantified a total of 97 proteins.
Multiple Peptides per Protein
The data from the standard curves shows that proteins were successfully quantified by targeting one or more peptides as indicated: 55 proteins by 1 peptide, 22 proteins by 2 peptides, 15 proteins by 3 peptides, 6 proteins by 4 peptides and 1 protein by 5 peptides. For each of the 44 proteins quantified by multiple peptides, we focused on comparing the 2 peptides that gave the highest and the lowest determined endogenous protein concentration. Some pairs of peptides gave identical protein concentrations, such as galectin-3-binding protein (Q08380) which was determined to be exactly 4.88 μg/ml based on both ELSEALGQIFDSQR and SDLAVPSELALLK. Conversely, there was a 21-fold difference in protein concentration when determined from two different peptides (FSAEFDFR and VYFAGFPR) from vitamin K-dependent protein S (P07225). The average protein concentration fold-change between pairs of peptides was 2.8 and a histogram of these values is included as supplemental Fig. S1. Similar discrepancies for protein concentrations calculated from multiple peptides have commonly been reported in biofluids and cell cultures when using peptide-level internal standards (31, 33, 34, 48, 49), and it is generally accepted that the main source of divergence is incomplete trypsin digestion (50, 51). One potential solution to this fundamental challenge in all bottom-up proteomic experiments is the use of full-length SIS proteins that could be spiked into the sample to account for digestion efficiency (52). However, these standards are currently prohibitively expensive and difficult to characterize in terms of confirming native protein conformational folding (53). Although multiple peptides per protein resulted in different calculated protein concentrations in our experiments, this difference was found to be constant across multiple biological samples. For example, Fig. 4A shows a slope of 4.6 when comparing two peptides from apolipoprotein C-II (P02655); however, the correlation was excellent with an R2 value of 0.994. For a global view, the histogram in Fig. 4B illustrates that variance between peptide ratios across 6 different biological samples was low (average CV 7.7%) for the 44 proteins quantified by multiple peptides. These results confirm previous reports demonstrating good correlation among multiple peptides per protein in plasma trypsin digests (34, 54, 55).
Fig. 4.

Multiple Peptides Per Protein. The agreement of multiple peptides per protein across 6 biological samples. A, The correlation between two peptides from apolipoprotein C-II (P02655). B, Peptide ratio CVs for the 44 proteins quantified by multiple peptides. If >two peptides were quantified for a given protein, then the ratio CV between the highest and lowest measured peptide concentration is shown.
Precision
Assay precision was determined from 3 full-process analytical replicates measured on three consecutive days for the six fresh biological samples (S1-S6). All 173 target peptides were quantified in all replicates for each sample except: apolipoprotein L1 (O14791) using LNILNNNYK in S1; complement component C7 (P10643) using AASGTQNNVLR in S1, S3, S4; galectin-3-binding protein (Q08380) using ELSEALGQIFDSQR in S1, vitamin K-dependent protein S (P07225) using SFQTGLFTAAR in S3. Fig. 5A shows that the intra-assay precision was excellent as >97% of peptide targets had a CV <20% and the average CV ranged between 6.2–7.7% for these six biological samples. These intra-assay precision values are similar to highly multiplexed LC/MRM-MS assays that we have previously developed for protein quantification, such as in plasma (average 6.9% CV) and in cerebrospinal fluid (average 5.8% CV) (33, 55). Fig. 5B shows the inter-assay precision shows again that most peptides targets (range 83–91%) had a CV <20% and the average CV ranged between 9.7 and 11.5%. As expected, there was slightly higher inter-assay variation than intra-assay variation.
Fig. 5.
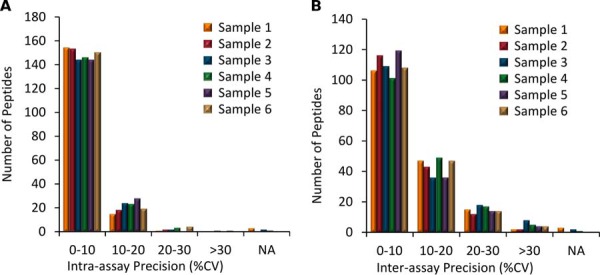
Precision. The analytical precision for 173 peptide targets for each of the 6 biological samples. A, Intra-assay precision, average 6.2–7.7% CV; B, Inter-assay precision, average 9.7–11.5% CV. Peptides not observed in all replicates for a given biological sample are listed as “NA.”
Fresh versus Previously Frozen
The DBS samples used in interference screening and standard curves were prepared from a whole blood sample that had been previously frozen. Freezing the whole blood will cause the red blood cells to lyse and may change the global properties of the sample. Therefore we investigated if freezing whole blood would substantially change our analytical results. Whole blood aliquots from each of the six individuals (S1-S6) were stored at 4 °C or −80 °C overnight. Then both sets of samples were spotted the next day and allowed to dry overnight as described in the sample preparation protocol. All 180 target peptides were quantified in all replicates for all samples except for: apolipoprotein L1 (O14791) using LNILNNNYK in S1, complement component C7 (P10643) using AASGTQNNVLR in S3, and vitamin K-dependent protein S (P07225) using SFQTGLFTAAR in S3. Fig. 6 shows the percent difference between fresh and previously frozen blood for Sample 1; data for all six samples are included in supplemental Table S8. When comparing the average peptide concentrations between fresh and previously frozen whole blood, the differences for most peptide targets (S1-S6, 89–97%) were within 20%. Overall, these results show that using previously frozen whole blood to generate DBS samples does not change the analytical results for the majority of targets in our assay. The use of frozen whole blood samples would be especially advantageous for use as quality control and proficiency testing samples for a MRM-based DBS assay in routine clinical use.
Fig. 6.
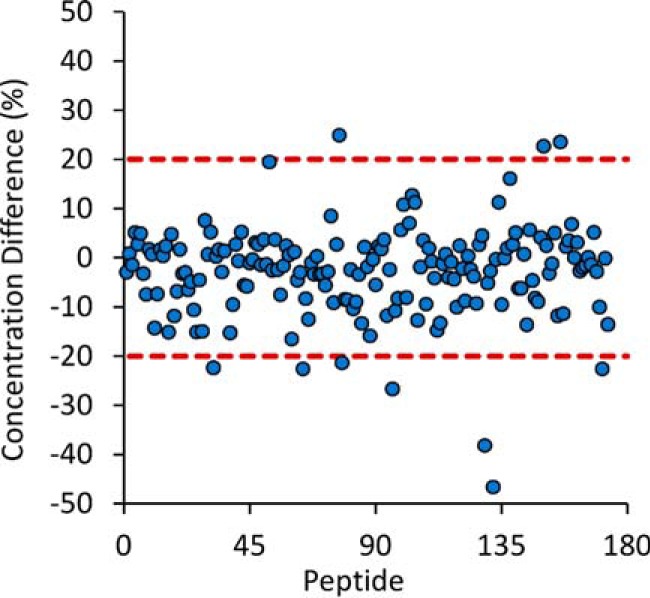
Fresh versus Previously Frozen. The difference between fresh and previously frozen whole blood on the measured peptide concentrations in DBS samples. Data shown for biological Sample 1 and data for biological Samples 2–6 are available as supplemental information.
Stability
One of the greatest advantages of DBS sampling is improved analyte stability over a wide range of temperatures during storage and transportation (56). In this work, we stored DBS samples at −20 °C, 4 °C, RT, and 37 °C for 1, 2, 7, 16, 29, 77, and 154 days. The stability was determined by comparing the absolute difference in the peptide concentration normalized to the values obtained on day 1. There were only two targets that were not quantified in all replicates on day 1 and these were therefore removed from this analysis: apolipoprotein D using IPTTFENGR and galectin-3 using VAVNDAHLLQYNHR. In addition, there were several peptides that showed stability trends that alternate throughout the time course study. For example, fibronectin (SYTITGLQPGTDYK) was measured at an absolute difference of 0.2% after 2 days, 9.4% after 7 days, 25.9% after 16 days and 9.0% after 29 days at room temperature. We interpret this data to mean that this particular peptide target had excellent stability for the first 7 days but questionable stability afterward. In this case, the alternative peptides for this same protein (NTFAEVTGLSPGVTYYFK and SSPVVIDASTAIDAPSNLR) would be preferable for studies requiring more than 7 days of storage as these were stable within 20% for the entire study. Fig. 7 shows the number of peptides that remained stable at various time points and storage conditions. After 2 days of storage, >95% of the peptides were stable across all storage temperatures. The percentage of stable peptides ranged between 81–84% after 7 days, 72–80% after 16 days, 72–76% after 29 days, 65–72% after 77 days, and 52–66% after 154 days. Most importantly, analyte stability was largely independent of storage temperatures. In this work, we used the Whatman 903 collection cards because they are already widely used in clinical DBS applications for small molecules (16). Further improvements in stability may be possible with newer commercially available cards which are chemically treated to denature endogenous enzymes and inhibit bacterial growth.
Fig. 7.
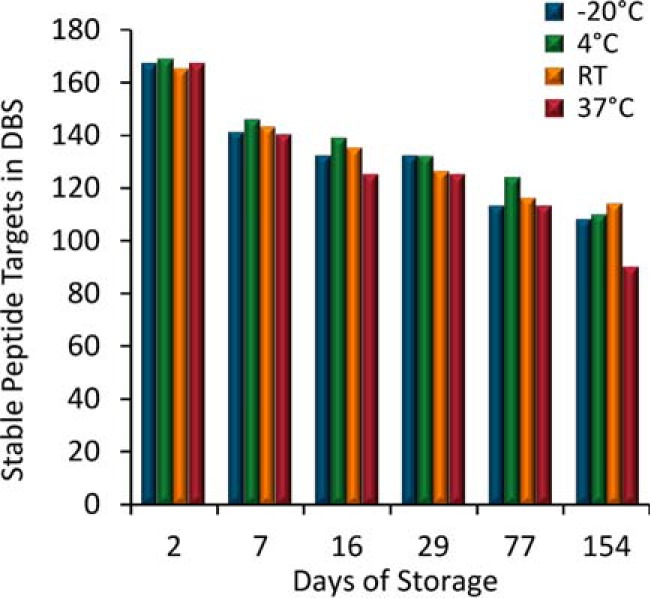
Stability. The number of stable endogenous peptide targets after storage at various temperatures. Peptides are considered stable if their measured concentration remains within 20% in reference to Day 1.
DBS versus Whole Blood
Matching DBS and whole blood samples from 6 different biological samples were prepared in parallel and analyzed by LC/MRM-MS. As shown in supplemental Table S8, six of the 173 peptides were not observed in all replicates for both sample types and therefore were removed from this analysis. The measured protein concentrations for some targets were very similar in DBS and whole blood, such as coagulation factor X (P00742) using TGIVSGFGR which yields an average fold-change of 1.01 between DBS and whole blood. The largest difference was for fibrinogen gamma chain (P02679) using IHLISTQSAIPYALR which had a 5.7-fold higher concentration in DBS samples. This increase in observed protein concentration in DBS samples may have resulted from improved protein denaturation as the blood sample dries on the collection card. However, the protein concentration ratios between the matching DBS and whole blood samples were constant across the six biological samples. Fig. 8A shows the strong correlation in protein concentration for lumican (P51884) using SLEDLQLTHNK, producing an R2 value of 0.984. To summarize this data, Fig. 8B shows that the DBS-to-whole blood concentration ratio was <20% for the majority (91%) of the peptides quantified. This suggests that peptide-specific correction factors could be used to accurately convert between DBS and whole blood values. However, it would be prudent to analyze a larger sample set to confirm these initial observations before establishing recommended correction factors.
Fig. 8.
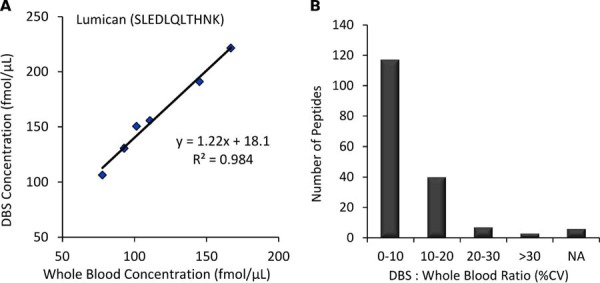
DBS versus Whole Blood. The comparison of measured concentrations in DBS and whole blood across 6 biological samples. A, The correlation for lumican (P51884) using SLEDLQLTHNK; B, The DBS : whole blood ratio CVs for peptide measurements.
Volumetric Spotting Devices
All previous experiments utilized an electronic laboratory pipette (Proline 5–100 μl, BioHit) for spotting 15 μl whole blood onto the DBS collection cards. However, it may be advantageous to use simple, disposable devices for volumetric spotting in remote locations. Therefore we compared the analytical performance of the laboratory pipette with 2 commercially available devices: Drummond Microcaps and Safe-Tec Microsafe. Histograms for the intra-assay precision for the 3 spotting methods are shown for 6 different biological samples in supplemental Fig. S2. In addition CV values for each peptide are shown in supplemental Table S8. The average intra-assay precision in this experiment when using the BioHit pipette ranged between 6.1–7.1% across the six biological samples. This matches the average intra-assay precision obtained with this pipette in the original precision evaluation (see Results, Precision). The average intra-assay precision for the Drummond Microcaps and Safe-Tec Microsafe ranged from 6.0–10.1% and 6.6–7.6%, respectively. In summary, all three volumetric spotting methods performed well as the majority of peptides (>92%) had a CV <20% for all six samples.
Final Assay
It is critical for all targeted MS assays to be developed according to their intended use. A recent publication has divided these uses into 3 tiers for proteomic applications (53). Tier-1 assays require the highest level of analytical validation as they are proposed for clinical diagnostics. A summary of attributes for these assays includes batch-to-batch quality control, the use of labeled internal standards and standard curves for every analyte, accepted reference standards for each target, high specificity, high precision (typically <20–25% CV), and the goal of absolute accuracy. Tier-2 assays still require moderate-to-high analytical validation and are suitable for high-quality research use (e.g. pathway analysis or biomarker verification). In this category, the emphasis is on precise, relative quantification (precision typically <20–35% CV) using internal standards for each analyte, and the generation of standard curves. Suitable reference standards may not be available, and absolute accuracy is less critical than precise measurements across biological samples. Finally, Tier-3 assays require low-to-moderate validation and are suitable only for exploratory investigations.
Our multiplexed LC/MRM-MS assay was developed for research use, so the experimental design aligns with the goals of a Tier-2 assay. We incorporated SIS peptides for each target peptide to enable precise relative quantification, and we generated standard curves in DBS samples for assay characterization. We discussed assay performance largely in reference to our target criteria of <20% CV, which is most important for analytical precision and stability. As described above, the majority of the protein targets were within this range; however, there were a few specific exceptions outside the <35% CV (Tier-2 assay criteria minimum). Peptide targets with an intra-assay or inter-assay precision of >35% CV in more than 1 of the 6 different biological samples investigated were now removed from the analytical assay. The peptide IPTTFENGR from apolipoprotein D (P05090) was also removed for exceeding the allowed inter-assay precision, and AASGTQNNVLR from complement component C7 (P10643) was removed because it was not quantified in all of the replicates of 3 biological samples. Similarly, peptides that were not stable (>35% difference) for at least 2 days were also now removed from the assay. This meant the removal of two additional peptides: LSSGLVTAALYGR from biotinidase (P43251) and VAVNDAHLLQYNHR from galectin-3 (P17931). Because Apolipoprotein D and galectin-3 also were quantified by other peptides, the final analytical assay was composed of 97 proteins, represented by 169 peptides (supplemental Table S2, column H) that adhere to Tier-2 assay requirements. The final assay MRM transition list is provided in supplemental Table S9.
Future Applications and Outlook
The ease of sample collection and storage has made DBS sampling desirable for biomedical research applications, especially outside traditional healthcare environments (e.g. at home, remote locations, resource limited countries) (1). The sensitivity of our current LC/MRM-MS assay extends to endogenous proteins in the high ng/ml range in DBS samples and enables several potentially high-value protein targets to be readily quantified. There are 33 proteins in our final assay that are listed as FDA-approved or -cleared protein targets in plasma and serum samples (see supplemental Table S2) (37). In addition, our final assay includes another 10 proteins in serum or plasma that are offered by at least one of the major three clinical laboratories or the Directory of Rare Analyses (37). One cannot assume, however, that the individual protein concentrations in DBS samples are equal to those in plasma or serum. Comparisons of analyte concentrations between DBS and plasma or serum must consider the fraction of analyte present inside the red blood cells (57). Our Tier-2 DBS-MRM assays could be compared with existing plasma assays using the same biological donors to determine the blood-to-plasma ratio for each target and to verify that this ratio remains constant across disease states. Alternatively, our Tier-2 LC/MRM-MS assays can be used to directly quantify these proteins in control and patient DBS samples to evaluate their diagnostic potential. Proteins with promising biomarker performance (e.g. sensitivity and specificity) will require further assay development and validation to reach the Tier-1 clinical assay designation. In addition, our LC/MRM-MS assays may be useful for the verification of other proposed biomarker proteins in DBS samples at moderate-to-high abundance.
There are many established or potential biomarker proteins that are below our current sensitivity and this is the main limitation of our current method. However, there are additional strategies that enable MRM-based approaches to reach lower abundance proteins. Multidimensional separations coupled with MRM allow the detection of proteins at the low ng/ml to high pg/ml range in human plasma (47, 58). For example, leptin has been previously reported at a concentration of <30 ng/ml in both human plasma and DBS samples using a single-plex immunoassay (44) We were not able to detect leptin in DBS samples using 1D LC/MRM-MS as described in this manuscript. In a recent study, leptin was also not detected in human plasma using 1D LC/MRM-MS; however, detection was possible with the increased separation power of 2D LC/MRM-MS (47). Alternatively, immunoaffinity enrichment prior to LC/MRM-MS can also provide access to proteins in low ng/ml to high pg/ml range in human plasma (59, 60). Both 2D separations and immunoaffinity enrichment will be investigated in future experiments in attempt to expand the number of proteins quantified from DBS samples.
CONCLUSION
We have developed a novel MRM assay for the quantification of 97 endogenous proteins in human DBS samples. Our method uses volumetric application of blood to eliminate potential bias from nonuniform spreading of blood across the collection card. Standard curves were generated using SIS peptides for in-depth assay characterization. The entire sample preparation protocol was robust, as evidenced by excellent intra-assay and inter-assay precision for multiple biological samples. Most importantly, the majority of targets were stable for at least 22 weeks in DBS samples across a wide range of temperatures. This assay represents the highest multiplexing for targeted protein quantification in DBS samples and is suitable for biomedical research applications. Future work will focus on validating sample collection in a clinical setting by individuals with various levels of medical training. In addition, the protein concentrations in both capillary and venous whole blood will be compared with matching plasma samples. Finally, steps can be taken toward Tier 1 MRM assay development for high-value clinical targets by the inclusion of certified reference materials and the use of full-length SIS proteins to normalize for the protein extraction and digestion efficiencies.
Supplementary Material
Footnotes
Author contributions: A.G.C. and C.H.B. designed research; A.G.C., A.J.P., and J.Y. performed research; A.G.C. and A.J.P. analyzed data; A.G.C. wrote the paper.
* This work was supported by the Genome Canada and Genome BC who funded the Science and Technology Innovation Centre in Proteomics, the Western Economic Diversification program for instrumentation support, and the Partnership for Clean Competition for supporting DBS method development. We are grateful for the support.
 This article contains supplemental Figs. S1 and S2 and Tables S1 to S9.
1 The abbreviations used are:
- DBS
- dried blood spot
- SRM
- selected reaction monitoring
- MRM
- multiple reaction monitoring
- SIS
- stable isotope-labeled standard peptides.
REFERENCES
- 1. McDade T. W., Williams S., and Snodgrass J. J. (2007) What a Drop Can Do: Dried Blood Spots as a Minimally Invasive Method for Integrating Biomarkers into Population-Based Research. Demography 44, 899–925 [DOI] [PubMed] [Google Scholar]
- 2. Demirev P. A. (2013) Dried blood spots: analysis and applications. Anal. Chem. 85, 779–789 [DOI] [PubMed] [Google Scholar]
- 3. Chace D. H., Kalas T. A., and Naylor E. W. (2003) Use of tandem mass spectrometry for multianalyte screening of dried blood specimens from newborns. Clin. Chem. 49, 1797–1817 [DOI] [PubMed] [Google Scholar]
- 4. Lehotay D. C., Hall P., Lepage J., Eichhorst J. C., Etter M. L., and Greenberg C. R. (2011) LC-MS/MS progress in newborn screening. Clin. Biochem. 44, 21–31 [DOI] [PubMed] [Google Scholar]
- 5. Edelbroek P. M., van der Heijden J., and Stolk L. M. L. (2009) Dried Blood Spot Methods in Therapeutic Drug Monitoring: Methods, Assays, and Pitfalls. Ther. Drug Monit. 31, 327–336 [DOI] [PubMed] [Google Scholar]
- 6. Wilhelm A. J., den Burger J. C., and Swart E. L. (2014) Therapeutic drug monitoring by dried blood spot: progress to date and future directions. Clin. Pharmacokinet. 53, 961–973 [DOI] [PMC free article] [PubMed] [Google Scholar]
- 7. Stove C. P., Ingels A. S., De Kesel P. M., and Lambert W. E. (2012) Dried blood spots in toxicology: from the cradle to the grave? Critical Rev. Toxicol. 42, 230–243 [DOI] [PubMed] [Google Scholar]
- 8. Quraishi R., Jain R., and Ambekar A. (2013) The Use of Dried Blood Spot Samples in Screening Drugs of Abuse. Pharmacol. Pharm. 4, 152–159 [Google Scholar]
- 9. Snijdewind I. J. M., van Kampen J. J. A., Fraaij P. L. A., van der Ende M. E., Osterhaus A. D. M. E., and Gruters R. A. (2012) Current and future applications of dried blood spots in viral disease management. Antiviral Research 93, 309–321 [DOI] [PubMed] [Google Scholar]
- 10. Johannessen A. (2010) Dried blood spots in HIV monitoring: applications in resource-limited settings. Bioanalysis 2, 1893–1908 [DOI] [PubMed] [Google Scholar]
- 11. Lehmann S., Delaby C., Vialaret J., Ducos J., and Hirtz C. (2013) Current and future use of “dried blood spot” analyses in clinical chemistry. Clin. Chem. Lab. Med. 51, 1897–1909 [DOI] [PubMed] [Google Scholar]
- 12. Addona T. A., Abbatiello S. E., Schilling B., Skates S. J., Mani D. R., Bunk D. M., Spiegelman C. H., Zimmerman L. J., Ham A.-J. L., Keshishian H., Hall S. C., Allen S., Blackman R. K., Borchers C. H., Buck C., Cardasis H. L., Cusack M. P., Dodder N. G., Gibson B. W., Held J. M., Hiltke T., Jackson A., Johansen E. B., Kinsinger C. R., Li J., Mesri M., Neubert T. A., Niles R. K., Pulsipher T. C., Ransohoff D., Rodriguez H., Rudnick P. A., Smith D., Tabb D. L., Tegeler T. J., Variyath A. M., Vega-Montoto L. J., Wahlander A., Waldemarson S., Wang M., Whiteaker J. R., Zhao L., Anderson N. L., Fisher S. J., Liebler D. C., Paulovich A. G., Regnier F. E., Tempst P., and Carr S. A. (2009) Multi-site assessment of the precision and reproducibility of multiple reaction monitoring-based measurements of proteins in plasma. Nat. Biotech. 27, 633–641 [DOI] [PMC free article] [PubMed] [Google Scholar]
- 13. Boja E. S., and Rodriguez H. (2012) Mass spectrometry-based targeted quantitative proteomics: Achieving sensitive and reproducible detection of proteins. Proteomics 12, 1093–1110 [DOI] [PubMed] [Google Scholar]
- 14. Picotti P., and Aebersold R. (2012) Selected reaction monitoring-based proteomics: workflows, potential, pitfalls and future directions. Nat. Meth. 9, 555–566 [DOI] [PubMed] [Google Scholar]
- 15. Abbatiello S. E., Schilling B., Mani D. R., Zimmerman L. J., Hall S. C., MacLean B., Albertolle M., Allen S., Burgess M. W., Cusack M. P., Ghosh M., Hedrick V., Held J. M., Inerowicz H. D., Jackson A., Keshishian H., Kinsinger C. R., Lyssand J., Makowski L., Mesri M., Rodriguez H., Rudnick P., Sadowski P., Sedransk N., Shaddox K., Skates S. J., Kuhn E., Smith D., Whiteaker J. R., Whitwell C., Zhang S., Borchers C. H., Fisher S. J., Gibson B. W., Liebler D. C., MacCoss M. J., Neubert T. A., Paulovich A. G., Regnier F. E., Tempst P., and Carr S. A. (2015) Large-scale inter-laboratory study to develop, analytically validate and apply highly multiplexed, quantitative peptide assays to measure cancer-relevant proteins in plasma. Mol. Cell. Proteomics pii: mcp.M114.047050. [DOI] [PMC free article] [PubMed] [Google Scholar]
- 16. Keevil B. G. (2011) The analysis of dried blood spot samples using liquid chromatography tandem mass spectrometry. Clin. Biochem. 44, 110–118 [DOI] [PubMed] [Google Scholar]
- 17. Li W., and Tse F. L. S. (2010) Dried blood spot sampling in combination with LC-MS/MS for quantitative analysis of small molecules. Biomed. Chromatogr. 24, 49–65 [DOI] [PubMed] [Google Scholar]
- 18. Wagner M., Tonoli D., Varesio E., and Hopfgartner G. (2014) The use of mass spectrometry to analyze dried blood spots. Mass Spectrom. Rev. 9999, 1–78 [DOI] [PubMed] [Google Scholar]
- 19. van Amsterdam P., and Waldrop C. (2010) The application of dried blood spot sampling in global clinical trials. Bioanalysis 2, 1783–1786 [DOI] [PubMed] [Google Scholar]
- 20. Burnett J. E. C. (2011) Dried blood spot sampling: practical considerations and recommendation for use with preclinical studies. Bioanalysis 3, 1099–1107 [DOI] [PubMed] [Google Scholar]
- 21. Xu Y., Woolf E. J., Agrawal N. G. B., Kothare P., Pucci V., and Bateman K. P. (2013) Merck's perspective on the implementation of dried blood spot technology in clinical drug development – why, when and how. Bioanalysis 5, 341–350 [DOI] [PubMed] [Google Scholar]
- 22. Zukunft S., Sorgenfrei M., Prehn C., Moller G., and Adamski J. (2013) Targeted Metabolomics of Dried Blood Spot Extracts. Chromatographia 76, 1295–1305 [Google Scholar]
- 23. Martin N. J., and Cooper H. J. (2014) Challenges and opportunities in mass spectrometric analysis of proteins from dried blood spots. Expert Rev. Proteomics 11, 685–695 [DOI] [PubMed] [Google Scholar]
- 24. Daniel Y. A., Turner C., Haynes R. M., Hunt B. J., and Dalto R. N. (2007) Quantification of Hemoglobin A2 by Tandem Mass Spectrometry. Clin. Chem. 53, 1448–1454 [DOI] [PubMed] [Google Scholar]
- 25. Boemer F., Ketelslegers O., Minon J.-M., Bours V., and Schoos R. (2008) Newborn Screening for Sickle Cell Disease Using Tandem Mass Spectrometry. Clin. Chem. 54, 2036–2041 [DOI] [PubMed] [Google Scholar]
- 26. Boemer F., Cornet Y., Libioulle C., Segers K., Bours V., and Schoos R. (2011) 3-years experience review of neonatal screening for hemoglobin disorders using tandem mass spectrometry. Clin. Chim. Acta 412, 1476–1479 [DOI] [PubMed] [Google Scholar]
- 27. Moat S. J., Rees D., King L., Ifederu A., Harvey K., Hall K., Lloyd G., Morrell C., and Hillier S. (2014) Newborn blood spot screening for sickle cell disease by using tandem mass spectrometry: implementation of a protocol to identify only the disease states of sickle cell disease. Clin. Chem. 60, 373–380 [DOI] [PubMed] [Google Scholar]
- 28. deWilde A., Sadilkova K., Sadilek M., Vasta V., and Hahn S. H. (2008) Tryptic Peptide Analysis of Ceruloplasmin in Dried Blood Spots Using Liquid Chromatography–Tandem Mass Spectrometry: Application to Newborn Screening. Clin. Chem. 54, 1961–1968 [DOI] [PubMed] [Google Scholar]
- 29. Cox H. D., Rampton J., and Eichner D. (2013) Quantification of insulin-like growth factor-1 in dried blood spots for detection of growth hormone abuse in sport. Anal. Bioanal. Chem. 405, 1949–1958 [DOI] [PubMed] [Google Scholar]
- 30. Cox H. D., Hughes C. M., and Eichner D. (2014) Sensitive quantification of IGF-1 and its synthetic analogs in dried blood spots. Bioanalysis 6, 2651–2662 [DOI] [PubMed] [Google Scholar]
- 31. Chambers A. G., Percy A. J., Yang J., Camenzind A. G., and Borchers C. H. (2013) Multiplexed Quantitation of Endogenous Proteins in Dried Blood Spots by Multiple Reaction Monitoring Mass Spectrometry. Mol. Cell. Proteomics 12, 781–791 [DOI] [PMC free article] [PubMed] [Google Scholar]
- 32. The_UniProt_Consortium (2015) UniProt: a hub for protein information. Nucleic Acids Res. 43, D204–D212 [DOI] [PMC free article] [PubMed] [Google Scholar]
- 33. Percy A. J., Yang J., Chambers A. G., Simon R., Hardie D. B., and Borchers C. H. (2014) Multiplexed MRM with Internal Standards for Cerebrospinal Fluid Candidate Protein Biomarker Quantitation. J. Proteome Res. 13, 3733–3747 [DOI] [PubMed] [Google Scholar]
- 34. Domanski D., Percy A. J., Yang J., Chambers A. G., Hill J. S., Cohen Freue G. V., and Borchers C. H. (2012) MRM-based Multiplexed Quantitation of 67 Putative Cardiovascular Disease Biomarkers in Human Plasma. Proteomics 12, 1222–1243 [DOI] [PubMed] [Google Scholar]
- 35. Percy A. J., Chambers A. G., Yang J., Jackson A. M., Domanski D., Burkhart J., Sickmann A., and Borchers C. H. (2013) Method and platform standardization in MRM-based quantitative plasma proteomics. J. Proteomics 95, 66–76 [DOI] [PubMed] [Google Scholar]
- 36. Percy A. J., Yang J., Hardie D. B., Chambers A. G., Tamura-Wells J., and Borchers C. H. (2015) Precise Quantitation of 136 Urinary Proteins by LC/MRM-MS using Stable Isotope Labeled Peptides as Internal Standards for Biomarker Discovery and/or Verification Studies. Methods 81, 24–33 [DOI] [PubMed] [Google Scholar]
- 37. Anderson N. L. (2010) The clinical plasma proteome: a survey of clinical assays for proteins in plasma and serum. Clin. Chem. 56, 177–185 [DOI] [PubMed] [Google Scholar]
- 38. Kuzyk M. A., Parker C. E., Domanski D., and Borchers C. H. (2013) Development of MRM-based assays for the absolute quantitation of plasma proteins. Methods Mol. Biol. 1023, 53–82 [DOI] [PubMed] [Google Scholar]
- 39. Mohammed Y., Domański D., Jackson A. M., Smith D. S., Deelder A. M., Palmblad M., and Borchers C. H. (2014) PeptidePicker: a scientific workflow with web interface for selecting appropriate peptides for targeted proteomics experiments. J. Proteomics 106, 151–161 [DOI] [PubMed] [Google Scholar]
- 40. Mohammed Y., Percy A. J., Chambers A. G., and Borchers C. H. (2015) Qualis-SIS: Automated Standard Curve Generation and Quality Assessment for Multiplexed Targeted Quantitative Proteomic Experiments with Labeled Standards. J. Proteome Res. 14, 1137–1146 [DOI] [PubMed] [Google Scholar]
- 41. De Kesel P. M., Sadones N., Capiau S., Lambert W. E., and Stove C. P. (2013) Hemato-critical issues in quantitative analysis of dried blood spots: challenges and solutions. Bioanalysis 5, 2023–2041 [DOI] [PubMed] [Google Scholar]
- 42. De Kesel P. M., Capiau S., Lambert W. E., and Stove C. P. (2014) Current strategies for coping with the hematocrit problem in dried blood spot analysis. Bioanalysis 6, 1871–1874 [DOI] [PubMed] [Google Scholar]
- 43. Li F., Ploch S., Fast D., and Michael S. (2012) Perforated dried blood spot accurate microsampling: the concept and its applications in toxicokinetic sample collection. J. Mass Spectrom. 47, 655–667 [DOI] [PubMed] [Google Scholar]
- 44. Miller E. M., and McDade T. W. (2012) A highly sensitive immunoassay for interleukin-6 in dried blood spots. Am. J. Hum. Biol. 24, 863–865 [DOI] [PMC free article] [PubMed] [Google Scholar]
- 45. Whiteaker J. R., Zhao L., Anderson L., and Paulovich A. G. (2010) An Automated and Multiplexed Method for High Throughput Peptide Immunoaffinity Enrichment and Multiple Reaction Monitoring Mass Spectrometry-based Quantification of Protein Biomarkers. Mol. Cell. Proteomics 9, 184–196 [DOI] [PMC free article] [PubMed] [Google Scholar]
- 46. Shi T., Su D., Liu T., Tang K., Camp D. G., Qian W. J., and Smith R. D. (2012) Advancing the sensitivity of selected reaction monitoring-based targeted quantitative proteomics. Proteomics 12, 1074–1092 [DOI] [PMC free article] [PubMed] [Google Scholar]
- 47. Percy A. J., Simon R., Chambers A. G., and Borchers C. H. (2014) Enhanced Sensitivity and Multiplexing with 2D LC/MRM-MS and Labeled Standards for Deeper and More Comprehensive Protein Quantitation. J. Proteomics 106, 113–124 [DOI] [PubMed] [Google Scholar]
- 48. Keshishian H., Addona T., Burgess M., Kuhn E., and Carr S. A. (2007) Quantitative, multiplexed assays for low abundance proteins in plasma by targeted mass spectrometry and stable isotope dilution. Mol. Cell. Proteomics 6, 2212–2229 [DOI] [PMC free article] [PubMed] [Google Scholar]
- 49. Kennedy J. J., Abbatiello S. E., Kim K., Yan P., Whiteaker J. R., Lin C., Kim J. S., Zhang Y., Wang X., Ivey R. G., Zhao L., Min H., Lee Y. H., Yu M. H., Yang E. G., Lee C., Wang P., Rodriguez H., Kim Y., Carr S. A., and Paulovich A. G. (2014) Demonstrating the feasibility of large-scale development of standardized assays to quantify human proteins. Nature Meth. 11, 149–155 [DOI] [PMC free article] [PubMed] [Google Scholar]
- 50. Arsene C. G., Ohlendorf R., Burkitt W., Pritchard C., Henrion A., O'Connor G., Bunk D. M., and Güttler B. (2008) Protein quantification by isotope dilution mass spectrometry of proteolytic fragments: cleavage rate and accuracy. Anal. Chem. 80, 4154–4160 [DOI] [PubMed] [Google Scholar]
- 51. Brownridge P., and Beynon R. J. (2011) The importance of the digest: proteolysis and absolute quantification in proteomics. Methods 54, 351–360 [DOI] [PubMed] [Google Scholar]
- 52. Brun V., Masselon C., Garin J., and Dupuis A. (2009) Isotope dilution strategies for absolute quantitative proteomics. J. Proteomics 72, 740–749 [DOI] [PubMed] [Google Scholar]
- 53. Carr S. A., Abbatiello S. E., Ackermann B. L., Borchers C., Domon B., Deutsch E. W., Grant R. P., Hoofnagle A. N., H Uumlttenhain R., Koomen J. M., Liebler D. C., Liu T., Maclean B., Mani D. R., Mansfield E., Neubert H., Paulovich A. G., Reiter L., Vitek O., Aebersold R., Anderson L., Bethem R., Blonder J., Boja E., Botelho J., Boyne M., Bradshaw R. A., Burlingame A. L., Chan D., Keshishian H., Kuhn E., Kinsinger C., Lee J., Lee S. W., Moritz R., Oses-Prieto J., Rifai N., Ritchie J., Rodriguez H., Srinivas P. R., Townsend R. R., Van Eyk J., Whiteley G., Wiita A., and Weintraub S. (2014) Targeted Peptide Measurements in Biology and Medicine: Best Practices for Mass Spectrometry-based Assay Development Using a Fit-for-Purpose Approach. Mol. Cell. Proteomics 13, 907–917 [DOI] [PMC free article] [PubMed] [Google Scholar]
- 54. Hoofnagle A. N., Becker J. O., Oda M. N., Cavigiolio G., Mayer P., and Vaisar T. (2012) Multiple-reaction monitoring-mass spectrometric assays can accurately measure the relative protein abundance in complex mixtures. Clin. Chem. 58, 777–778 [DOI] [PMC free article] [PubMed] [Google Scholar]
- 55. Percy A. J., Chambers A. G., Yang J., Hardie D. B., and Borchers C. H. (2014) Advances in multiplexed MRM-based protein biomarker quantitation toward clinical utility. Biochim. Biophys. Acta 1844, 917–926 [DOI] [PubMed] [Google Scholar]
- 56. Bowen C. L., Dopson W., Kemp D. C., Lewis M., Lad R., and Overvold C. (2011) Investigations into the environmental conditions experienced during ambient sample transport: impact to dried blood spot sample shipments. Bioanalysis 3, 1625–1633 [DOI] [PubMed] [Google Scholar]
- 57. Emmons G., and Rowland M. (2010) Pharmacokinetic considerations as to when to use dried blood spot sampling. Bioanalysis 2, 1791–1796 [DOI] [PubMed] [Google Scholar]
- 58. Shi T., Sun X., Gao Y., Fillmore T. L., Schepmoes A. A., Zhao R., He J., Moore R. J., Kagan J., Rodland K. D., Liu T., Liu A. Y., Smith R. D., Tang K., Camp D. G., and Qian W. J. (2013) Targeted Quantification of Low ng/mL Level Proteins in Human Serum without Immunoaffinity Depletion. J. Proteome Res. 12, 3353–3361 [DOI] [PMC free article] [PubMed] [Google Scholar]
- 59. Whiteaker J. R., Lin C., Kennedy J., Hou L., Trute M., Sokal I., Yan P., Schoenherr R. M., Zhao L., Voytovich U. J., Kelly-Spratt K. S., Krasnoselsky A., Gafken P. R., Hogan J. M., Jones L. A., Wang P., Amon L., Chodosh L. A., Nelson P. S., McIntosh M. W., Kemp C. J., and Paulovich A. G. (2011) A targeted proteomics-based pipeline for verification of biomarkers in plasma. Nat. Biotech. 29, 625–634 [DOI] [PMC free article] [PubMed] [Google Scholar]
- 60. Schoenherr R. M., Saul R. G., Whiteaker J. R., Yan P., Whiteley G. R., and Paulovich A. G. (2015) Anti-peptide monoclonal antibodies generated for immuno-multiple reaction monitoring-mass spectrometry assays have a high probability of supporting Western blot and ELISA. Mol. Cell. Proteomics 14, 382–398 [DOI] [PMC free article] [PubMed] [Google Scholar]
Associated Data
This section collects any data citations, data availability statements, or supplementary materials included in this article.