Abstract
The purpose of this study was to evaluate the dark adaptation time in canine electroretinography (ERG) using a contact lens electrode with a built-in LED. Twelve eyes of six normal laboratory beagle dogs were used and exposed to steady room light at 500 lux for 30 min for light adaption. ERG was recorded at different time points during dark adaptation in sedated and light-adapted beagles. The stimulus intensity was 0.0096 cd/m2/sec. The b-wave amplitude increased significantly until 25 min of dark adaptation, whereas no significant changes in amplitudes were observed after 30 min. Dark adaptation for more than 25 min would be necessary for accurate ERG in canine ERG using a contact lens electrode with a built-in LED.
Keywords: canine, dark adaptation, electroretinogram
Electroretinography (ERG), which records the changes in membrane potentials of retinal cells in response to a light stimulus, is applied for the diagnosis of retinal disease. It is known as a very useful method when fundus examination is difficult because of ocular media opacity [4, 13]. ERG is used for evaluation of retinal function, such as for presurgical evaluation, estimation of the degree of progression of retinal disease or evaluation of therapeutic response [6, 11, 13]. Since hereditary retinal degeneration was reported in the Gordon setter in 1911, inherited retinal degeneration has been reported in a number of breeds to date [7, 11]. Like rod dysplasia in the Norwegian Elkhound and cone degeneration in the Alaskan Malamute, the types of hereditary retinal degeneration are diverse [1, 2, 11]. Therefore, in the ERG examination, it is necessary to evaluate accurate ERGs under both scotopic and photopic conditions.
Various factors have an influence on the ERG waveform, such as the intensity of stimulation, pupil diameter and dark adaptation time [4]. Dark adaptation is a self-regulation system that increases the sensitivity to the light stimulus applied to the retina when the environment of an animal changes from light to dark. Rod ERG cannot be recorded under photopic conditions, because the visual pigments of rod cells, rhodopsin, are quickly used up. Therefore, in order to record rod ERG, dark adaptation time is necessary for reproduction of rhodopsin.
In human ophthalmology, ERG is performed under standard conditions according to the protocol prescribed by International Society for Clinical Electrophysiology of Vision (ISCEV) [8]. In the ISCEV ERG protocol, the dark adaptation time is 20 min or more. On the other hand, a dark adaptation time of 20 min or more is necessary in canine ERG according to the European College of Veterinary Ophthalmologists (ECVO) [10]. However, nobody has determined whether or not 20 min is a sufficient duration of dark adaption for rod ERG in canines. Thus, we recorded rod ERG for up to 60 min of dark adaptation and investigated the changes in ERG waveforms to reevaluate the dark adaptation time.
Twelve eyes of 6 normal laboratory beagle dogs were used in this study. The beagles were 1 to 3 years old, and their body weights were 10 to 12 kg. This study was conducted according to the guidelines of the experimental animal research committee of Rakuno Gakuen University. A portable ERG system (LE-3000, TOMEY, Nagoya, Japan) was used for the study. This ERG system combines a stimulus instrument, amplifier and recorder. We used an ERG contact lens electrode with a built-in diode light sourced (LED-electrode H2000, Kyoto Contact Lens, Kyoto, Japan). The pupil was fully dilated with 0.5% tropicamide and 0.5% phenylephrine (Mydrin-P, Santen, Osaka, Japan), and all dogs were exposed to steady room light (around 500 lux) for 30 min as light adaptation prior to ERG recording. Room light was measured by light meter (CENTER 337, Multi Measuring Instruments, Tokyo, Japan). ERG was recorded under sedation with a combination 0.01 mg/kg medetomidine (Domitor, ZENOAQ, Koriyama, Japan), 0.15 mg/kg midazolam (Midazolam, Fuji Pharma, Fuji, Japan) and 0.025 mg/kg butorphanol (Vetorphale, Meiji Seika, Tokyo, Japan) injected intravenously in a dark room. The LED electrode was positioned on the cornea after topical anesthesia with 0.4% oxybuprocaine (Benoxil ophthalmic solution 0.4%, Santen, Osaka, Japan) and protection of the cornea with 0.15% methylcellulose (SCOPISOL 15, Senju, Osaka, Japan). A needle-type electrode was positioned subcutaneously in the front of the region as the reference electrode, and a plate-type electrode was positioned at the tip of the ear as the earth electrode. ERG was recorded at different time points (T): 0, 5, 10, 15, 20, 25, 30, 40, 50 and 60 min of dark adaptation. The stimulus intensity was 0.0096 cd/m2/sec. From the recorded ERG waveforms, we measured the b-wave amplitude and implicit time in accordance with the ISCEV guidelines [8]. Comparison of the amplitude and implicit time between different time points was performed with the paired t-test. Differences were considered statistically significant at P<0.05. Below, we discuss the linear relationship between the dark adaptation time and b-wave amplitude.
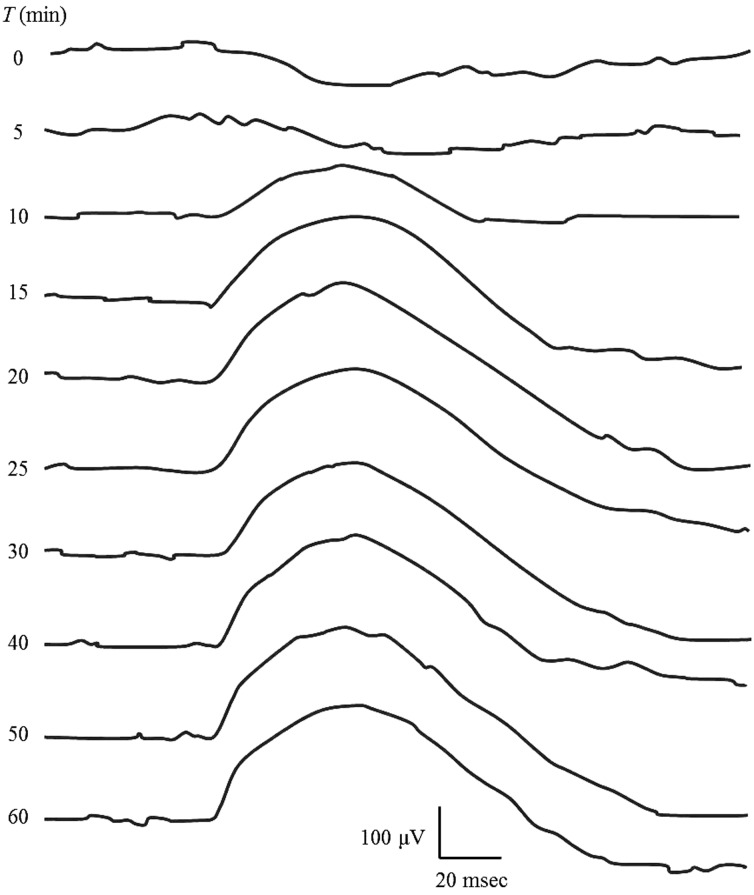
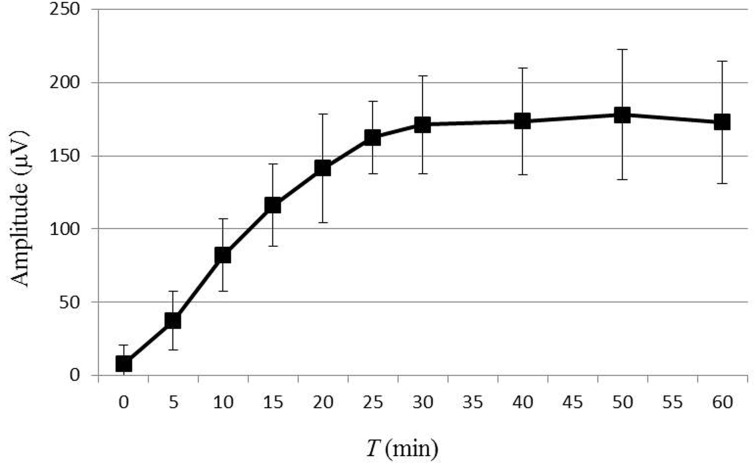
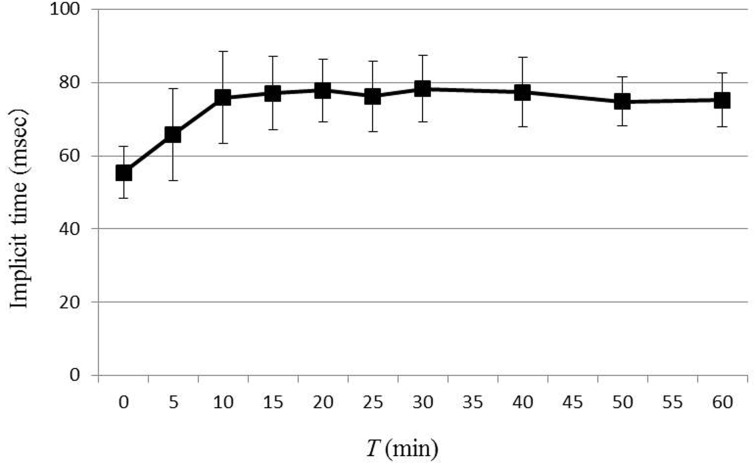
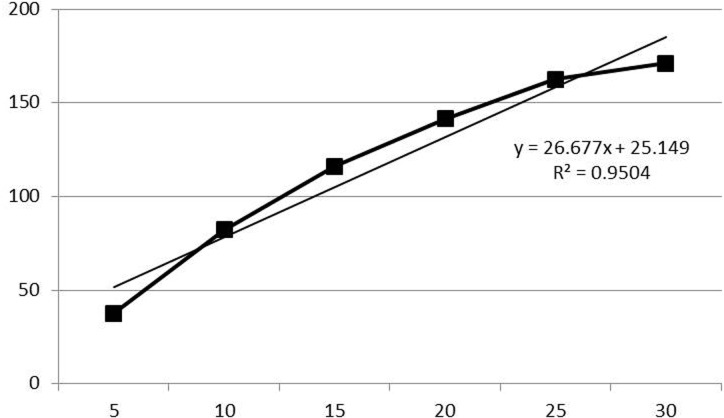
ERG waveforms recorded for each time point during dark adaptation from one dog are shown in Fig. 1. The average values for b-wave amplitude and implicit time are plotted in Figs. 2 and 3, respectively. In 8 out of 12 eyes, rod ERG could not be recorded at T=0. The b-wave amplitude was 37.6 ± 19.9 µV at T=5, 82.2 ± 24.4 µV at T=10, 116.2 ± 28.1 µV at T=15, 141.5 ± 37.0 µV at T=20, 162.6 ± 24.7 µV at T=25, 171.0 ± 33.2 µV at T=30, 173.5 ± 36.2 µV at T=40, 178.0 ± 44.3 µV at T=50 and 172.7 ± 41.8 µV at T=60. Comparison of each value for b-wave amplitude with that of the previous time point revealed significant increases in b-wave amplitude until T=25. There was no significance in b-wave amplitude after 30 min of dark adaptation. The average value for b-wave implicit time was 65.8 ± 12.6 msec at T=5, 75.9 ± 12.5 msec at T=10, 77.0 ± 10.0 msec at T=15, 77.8 ± 8.5 msec at T=20, 76.2 ± 9.6 msec at T=25, 78.2 ± 9.1 msec at T=30, 77.3 ± 9.4 msec at T=40, 74.8 ± 6.6 msec at T=50 and 75.2 ± 7.4 msec at T=60. Comparison of each value for b-wave implicit time with that of the previous time point revealed significant prolongation of the b-wave implicit time at only 10 min of dark adaptation, with no significant change after 10 min. Linear regression of the dark adaptation slope for 5 to 30 min of dark adaptation is shown in Fig. 4. A strong linear relationship was detected between the dark adaptation time and b-wave amplitude (R2=0.9504).
Fig. 1.
ERG waveform of each dark adaptation time recorded from one dog.
Fig. 2.
The changes in b-wave amplitude by dark adaptation time. The data represent the means of 12 eyes of 6 dogs, and the error bars represent the standard deviations. Comparison of the b-wave amplitude between each recording time and previous recording time revealed significant differences in b-wave amplitude until 25 min of dark adaptation. There was no significant change in b-wave amplitude after 30 min of dark adaptation.
Fig. 3.
The changes in b-wave implicit time by dark adaptation time. The data represent the means for 12 eyes of 6 dogs, and the error bars represent the standard deviations. Comparison b-wave implicit time between each recording time and previous recording time revealed a significant prolongation of the b-wave implicit time at only 10 min of dark adaptation. There was no significant change of b-wave implicit time after 10 min of dark adaptation.
Fig. 4.
Linear regression of the dark adaptation slope for 5 to 30 min of dark adaptation. A strong linear relationship between the dark adaptation time and b-wave amplitude was detected for 5 to 30 min of dark adaptation.
In this study, the b-wave amplitude increases until 25 min of dark adaptation, and no significant change in b-wave amplitude was observed after 30 min of dark adaptation. From these results, it appears that dark adaptation for more than 25 min would be necessary for accurate canine ERG using a contact lens electrode with a built-in LED.
In the previous protocol advocated by the ECVO, the required dark adaptation time was 20 min in the guidelines for canine ERG [10]. However, no reports were available about rod ERG with a dark adaptation time of more than 20 min. In this study, we recorded rod ERG with a dark adaptation time of more than 20 min, and an increased b-wave amplitude was detected. The differences between the ECVO protocol and the method in this study were the light stimulation device and stimulus intensity. Regarding the light stimulation device, a Ganzfeld dome is used in the ECVO protocol, while a contact lens electrode with a built-in LED was used in our study. Regarding the stimulus intensity, the ECVO recommends that, rod ERG be recorded with a stimulus intensity of 0.02–0.03 cd/m2/sec [10], while in our study, it was recorded with a stimulus intensity of 0.0096 cd/m2/sec based on our previous study with a contact lens electrode with a built-in LED [5]. In our previous study, the a-wave was recorded with the stimulus intensity recommended by the ECVO; therefore, a weaker stimulus intensity was better for recording rod ERG using a contact lens electrode with a built-in LED [5]. Because the required dark adaptation time might be different depending on the light stimulation device and stimulus intensity, it seems necessary to determine the dark adaptation time with each recording devise for ERG.
In this study, dark adaptation was started after 30 min of light adaptation under steady room light with 500 lux. This illumination is equivalent to the brightness of nearly all general animal hospital examination rooms. But, in the veterinary ophthalmology clinic, ERG was often recorded after slit lamp biomicroscopy, or funduscopy, both of which utilize a high-intensity light source. Tuntivanich reported that 60 min was needed for recovery of the ERG waveform after funduscopy [12]. According to the results of this study, 25 min of dark adaptation is necessary to record rod ERG using a contact lens electrode with a built-in LED, but it seems that the state of the animal before dark adaptation should be considered to record canine ERG accurately.
A strong linear relationship was detected between the dark adaptation time and the b-wave amplitude in our study. The ECVO canine ERG guidelines recommend that rod ERG be recorded after 1, 4, 8, 12, 16 and 20 min of dark adaptation, and ERG was evaluated change of wave form [10]. It has been reported that the individual variation of ERG amplitude is large, and therefore, it is difficult to evaluate retinal function by ERG recorded with only one recording condition [8, 10]. The ECVO has proposed evaluation of the changes in waveform under dark adaptation, but it has not been clear how the waveform changes. In this study, after dark adaptation, the amplitude of rod ERG was found to increase linearly. Our results suggest that the ERG amplitude changes depending on the dark adaptation time, and this suggests that it should be necessary to evaluate rod cell function in detail.
The dark adaptation time in human being is 20 min or more by ISECV [8], and in horses, rod ERG should be recorded after a minimum of 20 min of dark adaptation [3]. Based on our results, canine rod ERG using a contact lens electrode with a built-in LED should be performed after 25 min or more of dark adaptation, and the amount of dark adaption considered sufficient would differ by animal species. In humans, it is known that maximum density of rods is 1.60 × 10⁵/mm2 and that of cones is 1.99 × 10⁵/mm2 [4, 12]. On the other hand, it is known that the density of rods in the central retina is 5.00 × 10⁵/mm2 in the dog, and that of rods in the peripheral retina is 3.05 × 10⁵/mm2 [9]. Furthermore, it has been reported in the cat that the maximum rod cell density is 4.60 × 10⁵/mm2 [4, 12]. Given that the distribution and density of rod cells are different, we suggest that the dark adaptation time differs by animal species. In veterinary medicine, examinations were performed in a variety of animals with different distributions and densities of photoreceptor cells. We would like to propose establishment of the ERG examination protocols for each animal species.
REFERENCES
- 1.Aguirre G. D., Rubin L. F.1971. Progressive retinal atrophy (rod dysplasia in the Norwegian Elkhound. J. Am. Vet. Med. Assoc. 158: 208–218. [PubMed] [Google Scholar]
- 2.Aguirre G. D., Rubin L. F.1974. Pathology of hemeralopia in the Alaskan malamute dog. Invest. Ophthalmol. 13: 231–235. [PubMed] [Google Scholar]
- 3.Ben-Shlomo G., Plummer C., Barrie K., Brooks D.2012. Characterization of the normal dark adaptation curve of the horse. Vet. Ophthalmol. 15: 42–45. doi: 10.1111/j.1463-5224.2011.00923.x [DOI] [PubMed] [Google Scholar]
- 4.Ekesten B.2013. Ophthalmic examination and diagnostics. Part 4: Electrodiagnostic evaluation of vision. pp. 684–703. In: Veterinary Ophthalmology, 5th ed. (Gelatt, K. N., Gilger, B. C. and Kern, T. J. eds.), Wiley-BlackWell, Ames. [Google Scholar]
- 5.Maehara S., Itoh N., Itoh Y., Wakaiki S., Tsuzuki K., Seno T., Kushiro T., Yamashita K., Izumisawa Y., Kotani T.2005. Electroretinography using contact lens electrode with built-in light source in dogs. J. Vet. Med. Sci. 67: 509–514. doi: 10.1292/jvms.67.509 [DOI] [PubMed] [Google Scholar]
- 6.Maehara S., Itoh N., Wakaiki S., Yamasaki A., Tsuzuki K., Izumisawa Y.2007. The effects of cataract stage, lens-induced uveitis and cataract removal on ERG in dogs with cataract. Vet. Ophthalmol. 10: 308–312. doi: 10.1111/j.1463-5224.2007.00559.x [DOI] [PubMed] [Google Scholar]
- 7.Magnusson H.1911. Uber retinitis pigmentosa und konsanquinitat beinm hunde. Archiv. Fur. Vergleichende. Ophtalmologie. 2: 147–163. [Google Scholar]
- 8.Marmor M. F., Fulton A. B., Holder G. E., Miyake Y., Brigell M., Bach M., International Society for Clinical Electrophysiology of Vision. 2009. ISCEV Standard for full-field clinical electroretinography (2008 update). Doc. Ophthalmol. 118: 69–77. doi: 10.1007/s10633-008-9155-4 [DOI] [PubMed] [Google Scholar]
- 9.Mowat F. M., Petersen-Jones S. M., Williamson H., Williams D. L., Luthert P. J., Ali R. R., Bainbridge J. W.2008. Topographical characterization of cone photoreceptors and the area centralis of the canine retina. Mol. Vis. 14: 2518–2527. [PMC free article] [PubMed] [Google Scholar]
- 10.Narfström K., Ekesten B., Rosolen S. G., Spiess B. M., Percicot C. L., Ofri R., Committee for a Harmonized ERG Protocol, European College of Veterinary Ophthalmology. 2002. Guidelines for clinical electroretinography in the dog. Doc. Ophthalmol. 105: 83–92. doi: 10.1023/A:1020524305726 [DOI] [PubMed] [Google Scholar]
- 11.Narfström K., Peterson-Jones S. M.2013. Disease of canine ocular fundus. pp. 1303–1392. In: Veterinary Ophthalmology, 5th ed. (Gelatt, K. N., Gilger, B. C. and Kern, T. J. eds.), Wiley-BlackWell, Ames. [Google Scholar]
- 12.Tuntivanich N., Mentzer A. L., Eifler D. M., Montiani-Ferreira F., Forcier J. Q., Johnson C. A., Petersen-Jones S. M.2005. Assessment of the dark-adaptation time required for recovery of electroretinographic responses in dogs after fundus photography and indirect ophthalmoscopy. Am. J. Vet. Res. 66: 1798–1804. doi: 10.2460/ajvr.2005.66.1798 [DOI] [PubMed] [Google Scholar]
- 13.Wilkie D. A., Colitz C. M. H.2013. Surgery of the lens. pp. 1234–1286. In: Veterinary Ophthalmology, 5th ed. (Gelatt, K. N., Gilger, B. C. and Kern, T. J. eds.), Wiley-BlackWell, Ames. [Google Scholar]


