Abstract
In this paper, we revisit a 1986 article we published in this Journal, Meta-Analysis in Clinical Trials, where we introduced a random-effect model to summarize the evidence about treatment efficacy from a number of related clinical trials. Because of its simplicity and ease of implementation, our approach has been widely used (with more than 12,000 citations to date) and the “DerSimonian and Laird method” is now often referred to as the ‘standard approach’ or a ‘popular’ method for meta-analysis in medical and clinical research. The method is especially useful for providing an overall effect estimate and for characterizing the heterogeneity of effects across a series of studies. Here, we review the background that led to the original 1986 article, briefly describe the random-effects approach for meta-analysis, explore its use in various settings and trends over time and recommend a refinement to the method using a robust variance estimator for testing overall effect. We conclude with a discussion of repurposing the method for Big Data meta-analysis and Genome Wide Association Studies for studying the importance of genetic variants in complex diseases.
Keywords: random-effects model, meta-analysis, heterogeneity, clinical trials, Genome Wide Association Studies, Big Data
INTRODUCTION
Three decades ago in this Journal (formerly titled Controlled Clinical Trials), we proposed a simple non-iterative method to integrate the findings from a number of related clinical trials to evaluate the efficacy of a certain treatment for a specified medical condition [1]. Our approach, the random-effects model for meta-analysis, now commonly referred to as the “DerSimonian and Laird method”, has become extremely popular in medical research and other applications. According to the Web of Science Core Collection, there are more than twelve thousand citations attributed to the article with a substantial proportion of them occurring in the more recent years.
Following the introduction of the term meta-analysis in 1976 [2] and before the publication of our article, Meta-analysis in Clinical Trials, in 1986 [1], Web of Science lists 222 articles with the term meta-analysis in the title. Almost all of these were in social sciences with 50% in psychology, 32% in education research and 10% in business economics. In contrast, a large proportion of the more than 46000 articles since 1986 with the term meta-analysis in the title are related to medical or clinical research.
In this paper, we first review the background and the setting that led to Meta-Analysis in Clinical Trials [1] and the “DerSimonian and Laird method”, briefly describe the random-effects model for meta-analysis, assess its use in various settings and trends over time and explore the reasons for its popularity in medical and clinical research. We recommend a refinement to the method using an improved variance estimator for testing overall effect and conclude with a discussion of repurposing the method for genetic association studies and Big Data meta-analysis.
BACKGROUND
Eugene Glass first coined the phrase meta-analysis in 1976 to mean the statistical analysis of the findings of a collection of individual studies [2]. In the following decade, meta-analysis was primarily used in the social sciences to summarize the results of a large number of studies on many behavioral, educational and psychosocial studies and experiments. For instance, Rosenthal [3] analyzed accumulating data from studies done by others to assess if a teacher’s expectations can influence a student’s performance. Similarly, Glass [2] was interested in assessing if psychotherapy is effective while Mosteller [4–5] set out to determine the optimal class size for learning.
Early papers in the field were mostly descriptive and stressed the need to systematically report relevant details on study characteristics, not only about design of the studies, but characteristics of subjects, investigators, interventions, measures, study follow-up, etc. However, a formal statistical framework for creating summaries that incorporated heterogeneity was lacking.
An article exemplifying the approach in those early years addressed an important contemporaneous educational controversy to assess the effectiveness of coaching students for the Scholastic Aptitude Tests (SAT). In a meta-analysis of data from 23 studies evaluating the effect of coaching on SAT scores, Slack and Porter [6] concluded that coaching is effective on raising aptitude scores, contradicting the principle that the SATs measure “innate” ability or aptitude.
What was interesting about the data set analyzed by Slack and Porter was a striking relationship between the magnitude of the coaching effect and the degree of control for the coached group. Many studies evaluated only coached students and compared their before and after coaching scores with national norms provided by the Educational Testing Service (ETS) on the average gains achieved by repeat test takers. Other studies used convenience samples as comparison groups, and some studies employed either matching or randomization.
Using the same data set, we published a follow-up to Slack and Porter and introduced the random-effects approach for meta-analysis in this setting [7]. Our analysis geared towards explaining heterogeneity in the results and found gains in SAT scores depended highly on evaluation design. Studies without concurrent controls tended to show large gains for coaching, whereas in matched and randomized evaluations, the gain due to coaching was too small to be of practical use.
In contrast to that of Slack and Porter, our results were consistent with the principle advocated by ETS that the evidence did not support a positive effect of coaching on SAT scores. At the time, our paper attracted considerable media attention, with hundreds of US newspapers reporting on it, reflecting that the topic was of great interest to the general public. Although the number of citations related to this article in the scientific literature is comparatively modest, the ETS does continue to reference [8] our work in support of the notion that high scores simply reflect long-term rigorous academic training rather than some short-term coaching program.
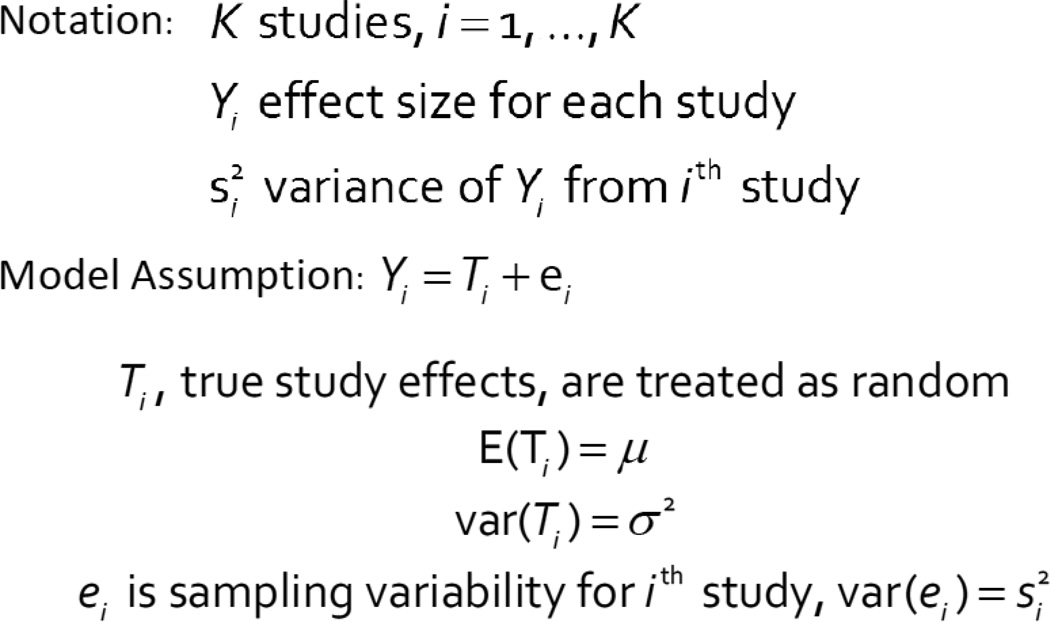
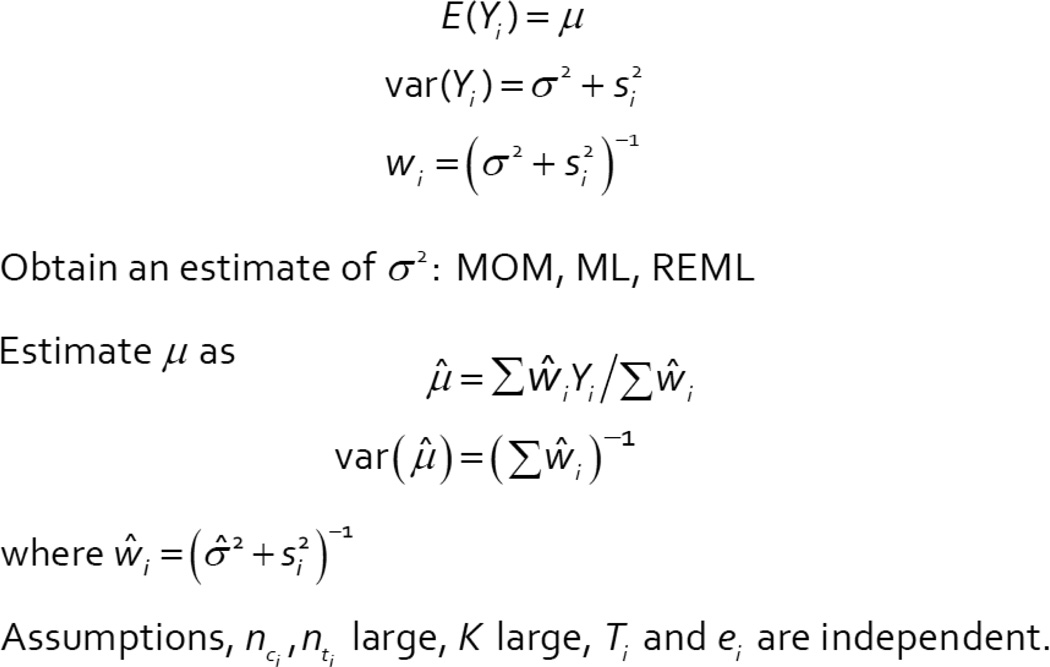
Our approach for meta-analysis of the studies to assess if coaching improves SAT scores followed that of Cochran [9] who wrote about combining the effects of different experiments with measured outcomes. Cochran introduced the idea that the observed effect of each study could be partitioned into the sum of a “true” but random effect plus a sampling (or within-study) error. Similarly, the variance of the observed effect can also be partitioned into the sum of a variation in true means, plus a within study variance. Following Cochran, we proposed a method for estimating the mean of the “true” effects of coaching, as well as the variation in “true” effects across studies. This random effects model for meta-analysis is shown in Figure 1, and our approach to the estimation is shown in Figure 2. We used a method of moments approach to estimate the variation in the true effects, but ML or REML are also possible. In the SAT application, we assumed that the observed effect for the i-th study, Yi, was the difference in two means between coached and un-coached students, and Ti was the true, but unobserved, effect. Allowing Ti to vary across studies permits different studies to have different coaching effects. We used an estimate of the within-study error assumed from each individual study, si2, to estimate the variation in the “true” effects, σ2. In this setting, the primary purpose is to provide an estimate of the overall coaching effect, μ, and characterize the variation, σ2, of the effects across studies.
Figure 1.
Random Effects Notation and Model
Figure 2.
Method of Analysis
META-ANALYSIS IN CLINICAL TRIALS
For Meta-Analysis in Clinical Trials [1], we adopted this same random-effects approach to integrate the findings from a number of related clinical trials to strengthen the evidence for the efficacy of a certain treatment for a specified medical condition. The basic idea of the approach is the same, but here we assumed the treatment effect for the i-th study, Yi, was the difference in Binomial cure rates between a treated and control group. Assuming the two groups are independent, the variance, si2, can be estimated using the Binomial model. Here again, the primary purpose is to make inferences about the overall treatment effect and provide a quantitative measure of how the treatment effects differ across the studies.
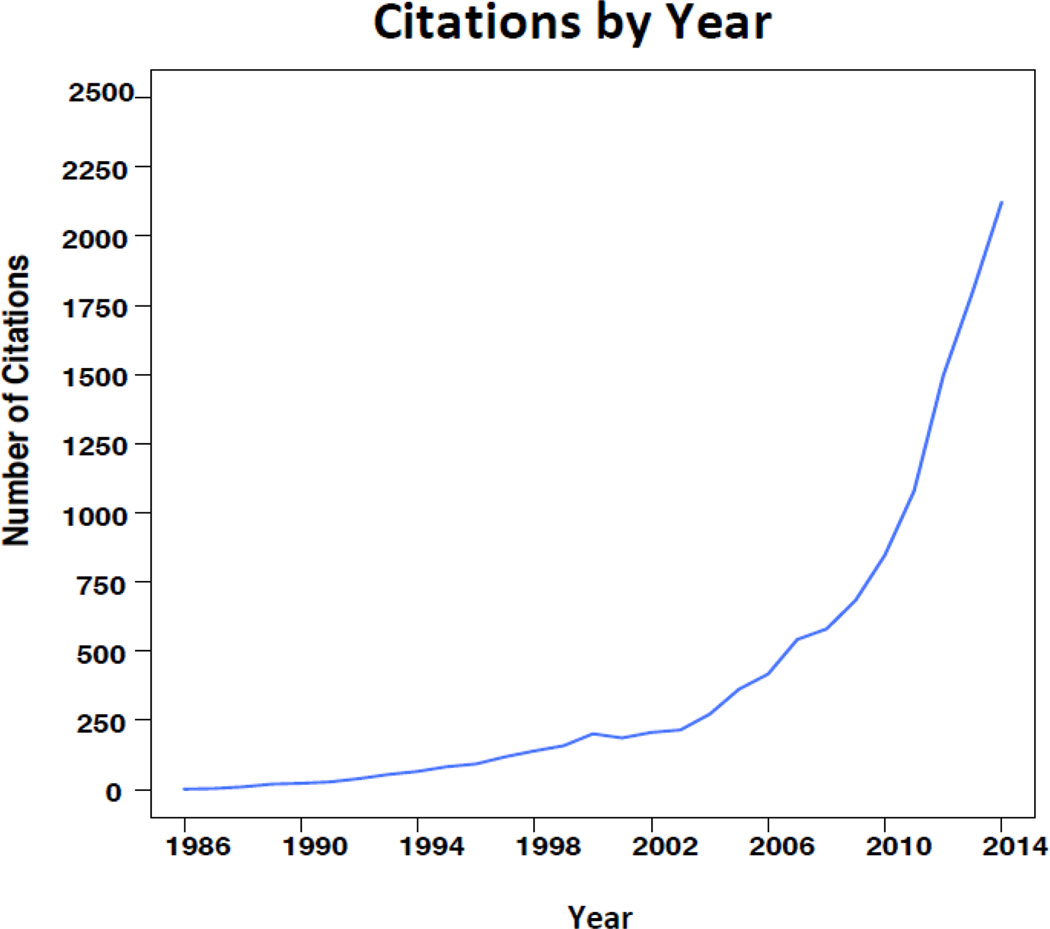
Our approach to integrate the findings across related clinical trials has become increasingly popular in medical research and has led to the moniker “DerSimonian & Laird method” when referring to the random-effects model for meta-analysis. According to Web of Science Core Collection, the paper has over twelve thousand citations to date. Moreover, the popularity does not seem to be subsiding in that more than 50% of those citations occur in the last few years with more than two thousand in the year 2014 alone (Figure 3).
Figure 3.
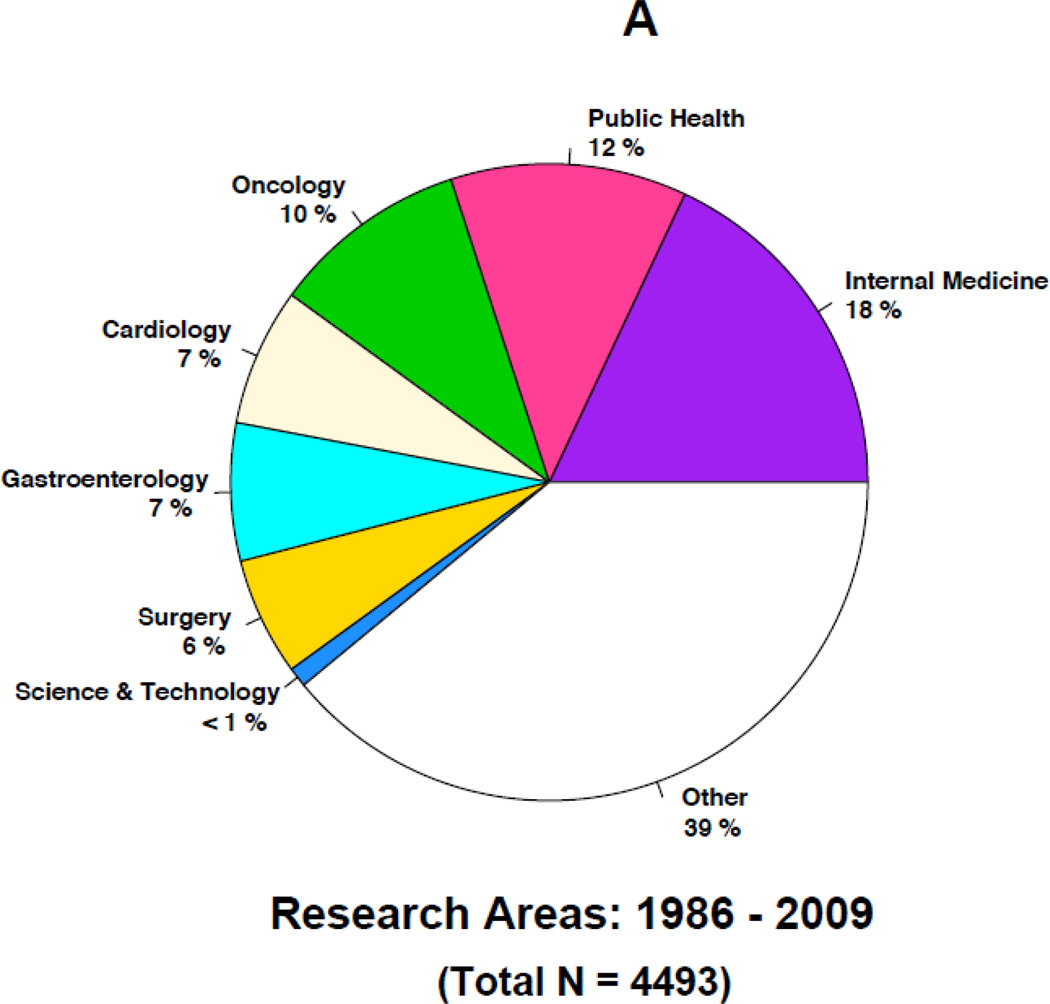
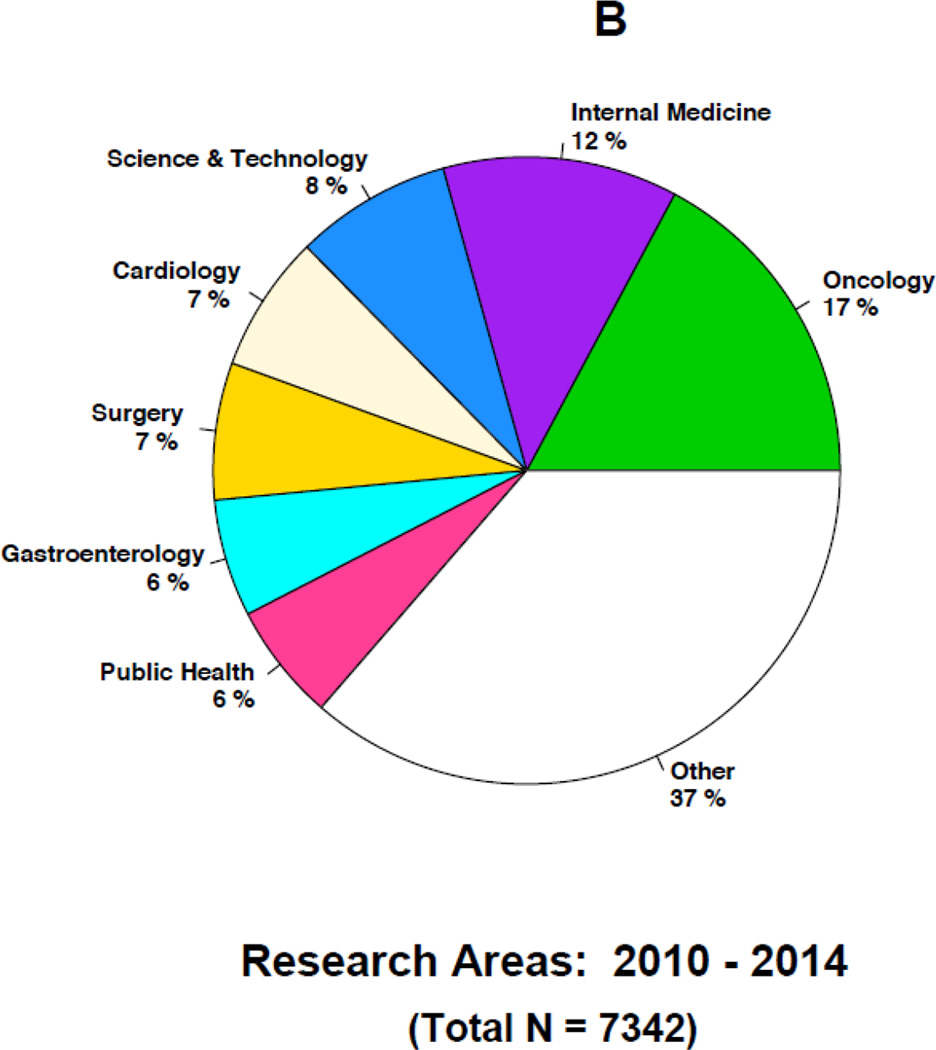
Figures 4A–4B and 5A–5B highlight some of the changes that have occurred over time in the research topics as well as the journals citing the 1986 article. For instance, the top five research areas constituting a little more than half of the total 4493 citations during 1986–2009 are in general internal medicine (18%), public health (12%), oncology (10%), cardiology (7%) and gastroenterology (7%) (Figure 4A). In contrast, the top five research topics constituting about half of the total 7342 citations during 2010–2014 are in oncology (17%), internal medicine (12%), science & technology (8%), cardiology (7%) and surgery (7%) (Figure 4B). In the later years, citations in general internal medicine and public health related topics are replaced by additional citations in oncology and science & technology research related topics. For instance, less than one percent of the articles in the earlier years were in science and technology compared to the 8% in the later years. Similarly, the proportion of articles in oncology increased from 10% to 17% in the later years. In contrast, a smaller proportion of the articles in the later years were in internal medicine and public health. Over time, internal medicine articles decreased from 18% to 12% and public health articles decreased from 12% to 6%. Overall, each time period includes more than 100 research areas with many of them being represented by only an article or two.
Figure 4.
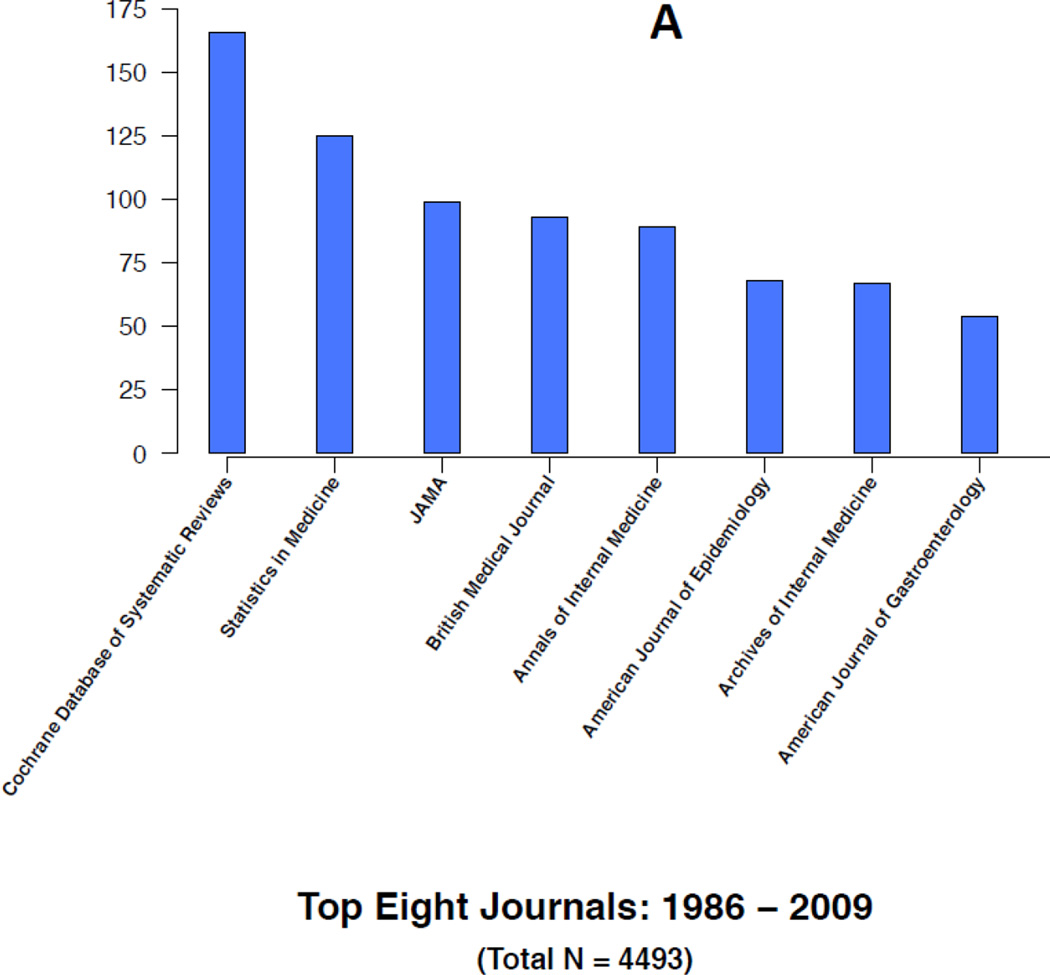
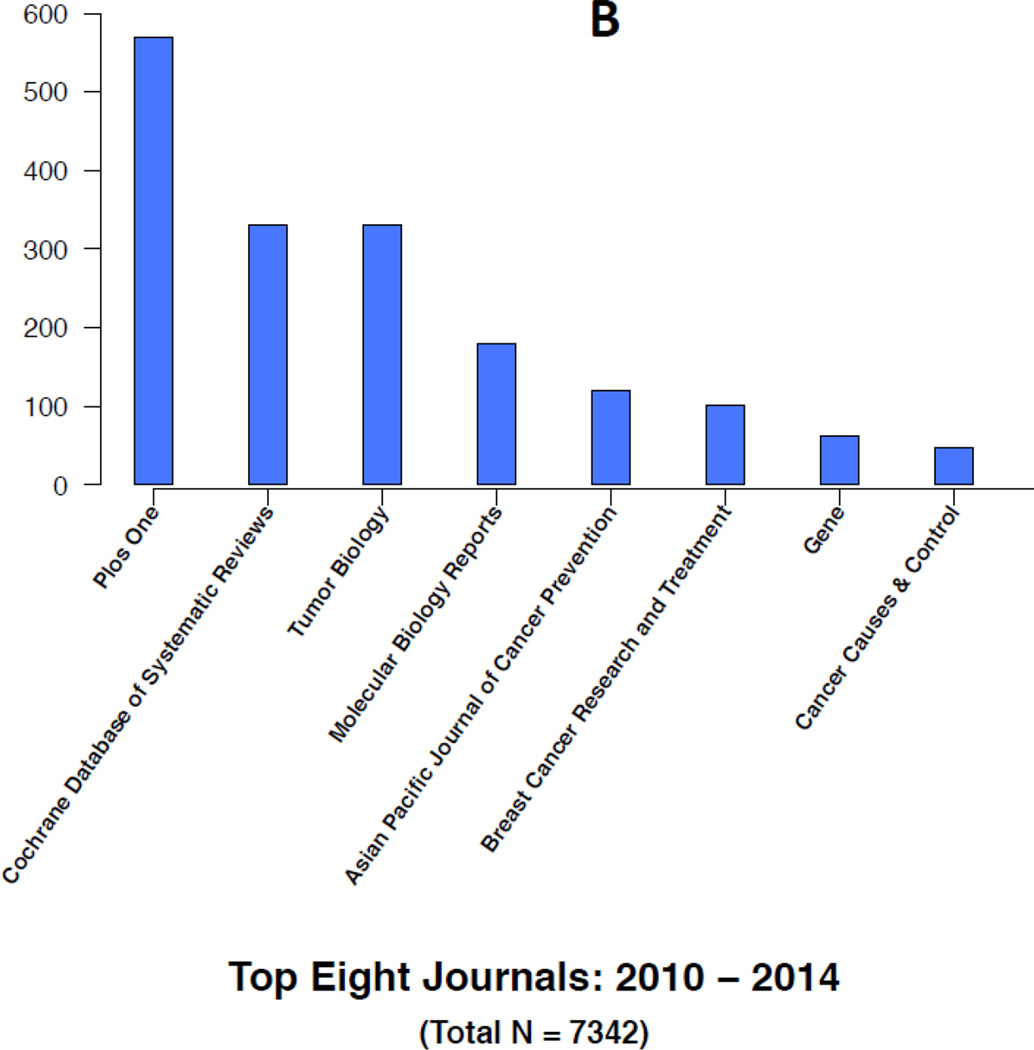
Figure 5.
Similar trends and changes occur in the journals citing the 1986 paper. For instance, top citing journals in the earlier years are Cochrane Database of Systematic Reviews, Statistics in Medicine and general medical journals, including Journal of the American Medical Association, British Medical Journals, Annals of Internal Medicine, and Archives of Internal Medicine (Figure 5A). In contrast, top citing journals in the later years are PLoS One, Cochrane Database of Systematic Reviews, Tumor Biology, Molecular Biology, Gene and several cancer related journals (Figure 5B). Figure 5B lists the top eight citing journals in 2010–2014 representing about 21% of the total citations (1532/7342) during this period. Overall, each time period includes more than 1000 journals with a large number of them being represented by a single article.
In summary, results from Figures 3–5 seem to imply that the surge in citations in the later years maybe due to the method’s use in new and emerging research areas, such as molecular and statistical genetics, in addition to the more traditional areas of medical and clinical research.
The “DerSimonian and Laird method” offers a number of advantages that explain its popularity and why it continues to be a commonly used method for fitting a random-effects model for meta-analysis. The method requires simple data summaries from each study that are generally readily available. The non-iterative method is simple and easy to implement, the approach is intuitively appealing and can be useful in identifying sources of heterogeneity.
Our original paper considered estimation of σ2 using ML, REML or MOM, as well as an unweighted method. We concluded that ML was biased downward, and that there was little difference between REML and MOM. The estimates from the unweighted method differed from the estimates of other three methods but without any consistent pattern. MOM was recommended because it is non-iterative. For estimating an overall treatment effect as well as treatment effect differences across studies, several simulation studies comparing the method with more sophisticated yet computer intensive methods [10–13] have concluded that the “DerSimonian and Laird method” remains adequate in most scenarios and there is little to gain from using more computationally intensive techniques. In an update to the original DerSimonian and Laird article, DerSimonian and Kacker [10] presented a unified framework for estimating σ2 and showed that the corresponding estimates for both iterative and non-iterative methods can be derived as special cases of a general method-of-moments estimate each reflecting a slightly different set of weights assigned to the individual studies. For instance, in the unweighted method, each study is assigned an equal weight while the weights in MOM are inversely proportional to the within-study sampling variances. Analogously, in ML and REML, the weights are inversely proportional to the total variances (within-study sampling variances as well as σ2) but the methods require iteration to estimate σ2.
Several extensions of the DerSimonian and Laird approach have been introduced for multivariate meta-analyses [14–16]. The applications include combining effect sizes for studies with multiple endpoints or for single endpoint studies with different subgroups.
There have been substantial developments on two related topics: confidence intervals for estimates of σ2 and testing for homogeneity (H0: σ2 = 0) [17–21]. Using an estimate of σ2 as a measure of heterogeneity is unsatisfactory as it depends heavily on the scale of measurement and has no absolute interpretation. A popular alternative is to use I2 [22] which can be interpreted as the percent of the overall variation in study results that is due to between study heterogeneity. Confidence intervals for I2 are also given in [22]. I2 can be substantial even when a test of homogeneity accepts.
Many investigators take the approach that studies should not be combined in the presence of heterogeneity. This attitude may stem from the fact that the power to detect overall effects will weaken as the between study heterogeneity increases. However, using tests of homogeneity to decide whether on not to combine studies may lead to biased inferences. The original DerSimonian and Laird paper espoused the point of view that the random effects approach can be used whether or not there is heterogeneity and offered limited discussion on testing for heterogeneity. It is important to bear in mind that tests of heterogeneity are often underpowered, and an acceptance of homogeneity is weak. In addition, a test of homogeneity does not shed light what the cause of heterogeneity might be. A valuable extension of random effects meta-analysis is meta-regression [14–15, 23–24], a meta-analysis that relates the size of the effect to one or more characteristics of the studies involved. Meta-regression can be useful for exploring sources of heterogeneity and for offering important insights as to the nature of interventions, of populations, or both.
When the focus is on testing rather than estimation, however, several other simulation studies [25–27] have highlighted limitations of the DerSimonian and Laird method and suggest alternative approaches that are just as simple and perform better, especially when the number of studies is small. In the next section, we discuss such refinements to the DerSimonian and Laird method for improved standard error estimation and testing for overall treatment effect.
An early criticism of the method is that the studies are not a random sample from a recognizable population. As discussed in Laird and Mosteller [28], absence of a sampling frame to draw a random sample is a ubiquitous problem in scientific research in most fields, and so should not be considered as a special problem unique to meta-analysis. For example, most investigators treat patients enrolled in a study as a random sample from some population of patients, or clinics in a study as a random sample from a population of clinics and they want to make inferences about the population and not the particular set of patients or clinics. This criticism does not detract from the utility of the random-effects method. If the results of different research programs all yield similar results, there would not be great interest in a meta-analysis. We view the primary purpose of meta-analysis as providing an overall summary of what has been learned, as well as a quantitative measure of how results differ, above and beyond sampling error.
Repurposing DerSimonian and Laird for Big Data
Modern technology has enabled the collection of enormous amounts of data on individual subjects, for example data from cell phones, social media web sites, administrative health care data bases, genomic and more generally ‘omics’ data. We now have readily accessible data sets that are orders of magnitude larger than conventional data sets. There are many types of Big Data, and the goals of each analysis can be quite different for different settings, but there are some common features. In addition to the magnitude of data collected on individual sampling units, the number of independent studies (K) available may be quite small. Third, the focus is often hypothesis testing rather than estimation. Finally, because of the magnitude of the data, it is natural to consider analyzing data summaries, rather than to consider pooling the data from different studies into one mega-sized database
Consider, for instance, Genome Wide Association Studies, which are currently popular in studying the importance of genetic variants in complex disease. In a typical study, around a million variants may be measured for each subject, and another million might be imputed for analysis. The ultimate goal is to locate variants which are causal for the disease, but even with two million variants available for each subject, one would be very lucky to have measured a causal one, since there are around 3 billion variants total in the human genome. Thus the practical objective is to find those variants that are associated with the disease; in the absence of confounding factors, we can presume these are in close physical proximity to a causal variant. As a result, testing for association with all measured variants is the main task, whereas estimation of association parameters is not. Because of the multiple testing problem, even studies with several thousand subjects may not be sufficiently powered to detect the small effects that are typical of GWAS associations. As a result, one major rationale for meta-analysis is to improve power. Often genetic studies analyze different ethnic or racial groups separately, and then use meta-analysis techniques to combine over groups. In this setting K can be quite small, on the order of 2 or 3. Using meta-analysis to improve power can be successful, but only if the degree of heterogeneity is small.
Hypothesis Testing versus Estimation
Hypothesis testing was not discussed in DerSimonian and Laird [1]. Rather, we considered estimation of the overall mean, μ, the extraneous variance in the treatment means across studies, σ2, and a variance for the estimated mean. It is straightforward to obtain a hypothesis test that H0: μ=0, by inverting the confidence interval for μ. This gives a test sometimes attributed to DerSimonian and Laird, although this may not be the best approach. In particular, this method is sometimes criticized as ‘anti-conservative’ [25] or as being ‘too-conservative’ [26]. A difficulty is that there is not a single obvious null hypothesis. Figure 6 lists several possible nulls for the random effect setting. The ‘so-called’ equal effects assumption is that σ2 is zero, and the null hypothesis tests μ=0. This is a popular null hypothesis because, if true, power gains can ordinarily be achieved by a fixed effects meta-analysis. Clearly the DerSimonian and Laird test will be conservative in this setting; it will tend to overestimate because it estimates σ2 assuming it is positive. A second assumption is that σ2 is positive, and the null hypothesis also tests that μ=0.
Figure 6.
Hypothesis Testing with the Random Effects Model
This null allows for the possibility that on average there is no effect, but that some studies may be non-zero and in opposite directions. Such a scenario may suggest interactions (see the INSIG2 example below) but otherwise may be difficult to interpret. The alternative of σ2 > 0 and μ ≠ 0 will often be appropriate. In this setting the DerSimonian and Laird approach can be anti-conservative for testing, especially if K is small and/or the sample sizes of each study are small, or highly unequal [25]. In these cases, is not well estimated by the DerSimonian and Laird approach. There is a simple fix however, as described in [25] and discussed below, which is attractive because it also uses data summaries and is a minor adjustment to the original analysis presented in Figure 2. The third null hypothesis one might want to consider tests that both μ=0 and σ2=0, as proposed by in [26]. A feature of the Han and Eskin approach is that the null hypothesis may be rejected if μ=0, but σ2 is not, a scenario which can happen if there are studies showing opposite effects. Such a scenario may be difficult to interpret, or may point to interactions with study level variables.
Alternative Estimates of
The DerSimonian and Laird approach assumes that the variance of a study effect size is the sum of two components: the within study sampling error (which we treat as fixed and known), and σ2; σ2 is estimated by a method of moments approach. μ is estimated by a weighted mean, where each weight is the inverse of the assumed variance (Figure 2). Since the true variances are unknown, both σ2 and the within study variance are replaced by their estimates in calculating the weight. Thus the weight is estimated, but in calculating , we assumed the weights are fixed and known and that the variance is correctly specified in order to get a simple expression for as the inverse of the sum of study weights. See Figure 2. This is the classical model based estimate, and should hold approximately in many cases as long as K and the within study sample sizes are large. In practice, the model based estimator may be too small because it ignores the variability in the weights, and using a test based on an inverted confidence interval will be anti-conservative. Several alternative approaches have been proposed, including a weighted least squares approach [29] and using the ‘robust’ variance estimator [27]. Both estimators give a test with improved coverage with the robust estimate doing somewhat better overall [25, 27]. The robust variance estimate is similar to the model based, except that instead of assuming var(Yi) = (wi)−1, Var(Yi) is replaced by the residual i.e,
Note that if replaces in the robust variance formula above, the estimate for reduces to the model based estimate, apart from a factor of K/(K-1). Using the robust variance estimate gives valid confidence intervals and tests under a wide range of assumptions.
Using Data Summaries for Meta-Analysis
In our experience, most meta-analysis approaches were designed to utilize summary information which is readily available from the literature, or the study investigators. Conversely, when the original individual-level data are available for analysis, they can be combined and treated as one large stratified data set. This is typically referred to as pooling. In the case of big data, each study data set is so large as to make pooling impractical, whereas using data summaries can be relatively easy. Thus in the literature of the GWAS, using meta-analysis has come to mean using data summaries in order to pool results. In fact, a recent article in Genetic Epidemiology points out that there is no efficiency gain in using individual level data over meta-analysis in the context of GWAS [30]. Fortunately, the approach outlined by DerSimonian and Laird is particularly well suited for this purpose, except that for testing, we recommend the robust variance estimate proposed by Siddik and Jonkman [27] for this setting be used. In addition, bigger advantage might be taken of meta-regression in this setting as using important study characteristics may uncover gene-environment interactions [31].
Example. One of the first GWAS studies was published in 2006 [32]. Using the family data from the Framingham Heart Study, the authors found that a genetic variant near the INSGIG2 gene, Rs7566605, was associated with obesity. In addition, the same variant was significantly associated with obesity in four out of five additional comparisons, which were preplanned by the authors. For a variety of reasons, the finding was controversial. Fortunately, this is a finding that is easy for almost any investigator to replicate because height and weight, which are used to assess obesity, are always available in any clinical study, and it is fairly simple for most investigators to assay just a few genetic variants. Many attempts at replication were made, some successful and some not. Because of the large number of conflicting results from different studies, the original investigators developed the hypothesis that the association might be due to factors correlated with the nature of the population studied.
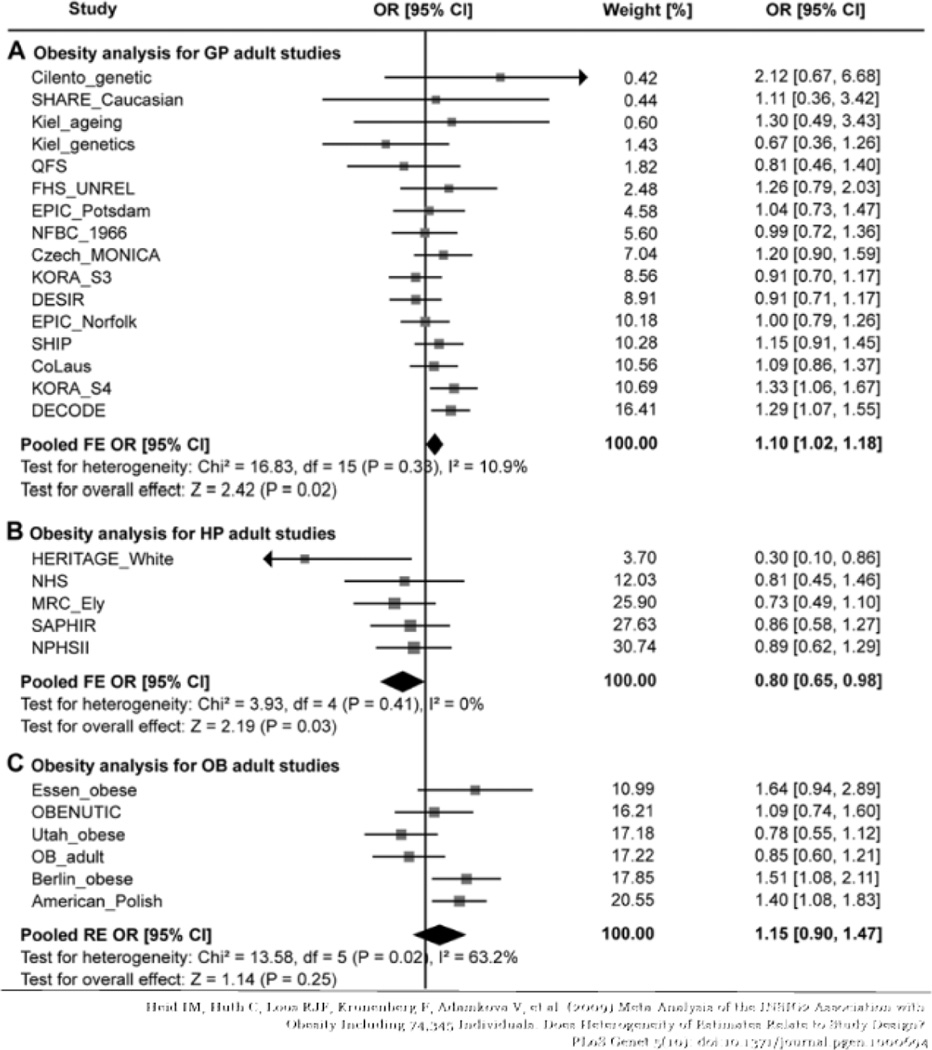
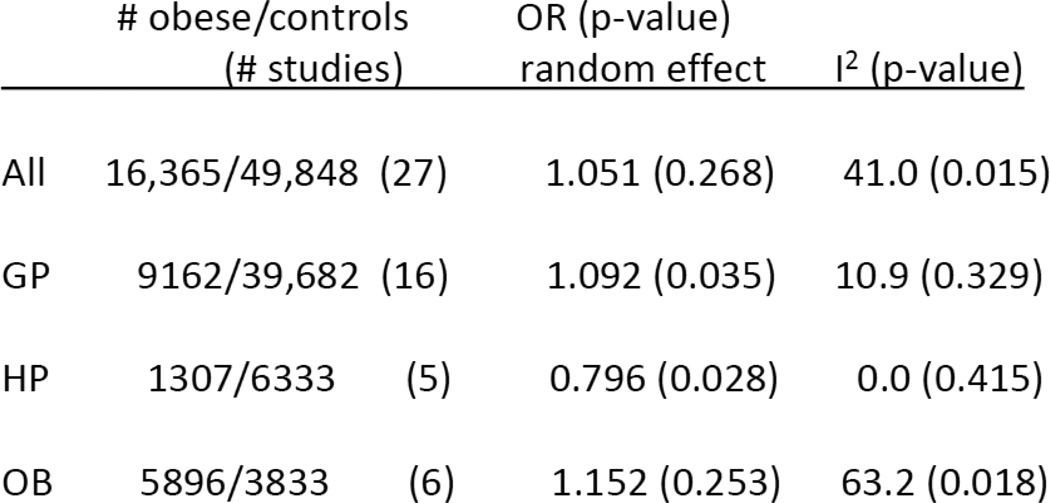
Some of the original investigators undertook a meta-analysis [31] to investigate several hypotheses, including the hypothesis that the results depended on the population studied. The studies were categorized as general population (GP) studies, healthy population (HP) studies or obesity studies (OB). The subjects in the GP studies were essentially random samples from a general population, with no exclusions based on health status. The HP studies largely used samples from employed or otherwise ‘healthy’ populations (nurses, physicians, etc.) whose health status is generally quite different from the general population. The OB studies selected obese subjects and controls. Excluding seven studies in the original Herbert paper, they found 27 studies of Caucasian adults, as reported in Figure 7. The summary results of the studies, overall and by category are given in Figure 8.
Figure 7.
INSIG2 Variant and Obesity
Figure 8.
INSIG2 Rs7566605 Association with Obesity Meta-Analysis Results for Adults
Here, the data summary from each study is an odds ratio, so the null hypothesis is H0: μ=1. From Figure 8, if we combine over all studies, ignoring the population type, the overall odds ratio is close to one, and the standard error is large because of the large amount of heterogeneity. Here we have used I2 to measure heterogeneity. I2 is the percent of total variance in the Yi’s that is explained by the extraneous variance, σ2. It is a better indicator of extraneous variance than σ2 because it is scale free [22]. If we analyze the studies stratifying on population type, the odds ratio for the GP studies is larger, whereas the odds ratio for the HP studies is in the opposite direction. Both are marginally significant and have much smaller indices of heterogeneity. The result is similar to findings from many meta-analyses that show the dependence of study results on study design factors, however it is quite different in the sense that the characteristic is the nature of the population that was sampled rather than the design. This suggests some environmental effects may alter the effect of the genetic variant.
This meta-analysis is not typical of a big data scenario since we have selected only one variant for investigation. In a more typical setting there may be millions of hypotheses to test. Nonetheless it does illustrate the potential utility of the approach, demonstrates the need to investigate extraneous variability, and that many analytical issues are similar in the many settings where meta-analysis is used.
Acknowledgements
We thank Jelena Follweiler for her technical assistance and Jing Wang for her help with the citation graphs.
Footnotes
Publisher's Disclaimer: This is a PDF file of an unedited manuscript that has been accepted for publication. As a service to our customers we are providing this early version of the manuscript. The manuscript will undergo copyediting, typesetting, and review of the resulting proof before it is published in its final citable form. Please note that during the production process errors may be discovered which could affect the content, and all legal disclaimers that apply to the journal pertain.
References
- 1.DerSimonian R, Laird NM. Meta-analysis in clinical trials. Controlled Clinical Trials. 1986;7:177–188. doi: 10.1016/0197-2456(86)90046-2. [DOI] [PubMed] [Google Scholar]
- 2.Glass GV. Primary, secondary, and meta-analysis of research. Educational Researcher. 1976;5:3–8. [Google Scholar]
- 3.Rosenthal R, Rubin DB. Interpersonal expectancy effects: The first 345 studies. Behavioral and Brain Sciences. 1978;1:377–386. [Google Scholar]
- 4.Mosteller F. The Tennessee Study of Class Size in the Early School Grades. The Future of Children. 1995;5(2):113–127. [PubMed] [Google Scholar]
- 5.Mosteller F, Light RJ, Sachs JA. Sustaining Inquiry in Education: Lessons from Skill Grouping and Class Size. Harvard Educational Review. 1996;66(4):797–842. [Google Scholar]
- 6.Slack W, Porter D. The scholastic aptitude test: A critical appraisal. Harvard Educational Review. 1980;66:1–27. [Google Scholar]
- 7.DerSimonian R, Laird NM. Evaluating the effect of coaching on SAT scores: A meta-analysis. Harvard Educational Review. 1983;53:1–15. [Google Scholar]
- 8.The College Board. Office of Research and Development RN-06. 1999. Research Notes: Coaching and the SAT® I. [Google Scholar]
- 9.Cochran WG. The combination of estimates from different experiments. Biometrics. 1954;10:101–129. [Google Scholar]
- 10.DerSimonian R, Kacker R. Random-effects model for meta-analysis of clinical trials: an update. Contemporary Clinical Trials. 2007;28:105–114. doi: 10.1016/j.cct.2006.04.004. [DOI] [PubMed] [Google Scholar]
- 11.Jackson D, Boden J, Baker R. How does the DerSimonian and Laird procedure for random effects meta-analysis compare with its more efficient by harder to compute counterparts? Journal of Statistical Planning and Inference. 2010;140:961–970. [Google Scholar]
- 12.Kontopantelis E, Reeves D. Performance of statistical methods for meta-analysis when true study effects are non-normally distributed: A simulation study. Statistical Methods in Medical Research. 2012;21(4):409–426. doi: 10.1177/0962280210392008. [DOI] [PubMed] [Google Scholar]
- 13.Kontopantelis E, Reeves D. Performance of statistical methods for meta-analysis when true study effects are non-normally distributed: A comparison between DerSimonian-Laird and restricted maximum likelihood. Statistical Methods in Medical Research. 2012;21(6):657–659. doi: 10.1177/0962280211413451. [DOI] [PubMed] [Google Scholar]
- 14.Jackson D, White IR, Thompson SG. Extending DerSimonian and Laird’s methodology to perform multivariate random-effects meta-analyses. Statistics in Medicine. 2010;29:1282–1297. doi: 10.1002/sim.3602. [DOI] [PubMed] [Google Scholar]
- 15.Jackson D, White IR, Riley RD. A matrix-based method of moments for fitting the multivariate random effects model for meta-analysis and meta-regression. Biometrical Journal. 2013;55(2):231–245. doi: 10.1002/bimj.201200152. [DOI] [PMC free article] [PubMed] [Google Scholar]
- 16.Chen H, Manning AK, Dupuis J. A method of moments estimator for random effect multivariate meta-analysis. Biometrics. 2012;68:1278–1284. doi: 10.1111/j.1541-0420.2012.01761.x. [DOI] [PMC free article] [PubMed] [Google Scholar]
- 17.Biggerstaff BJ, Jackson D. The exact distribution of Cochran’s heterogeneity statistic in one-way random effects meta-analysis. Statistics in Medicine. 2008;27:6093–6110. doi: 10.1002/sim.3428. [DOI] [PubMed] [Google Scholar]
- 18.Kulinskaya E, Dollinger MB, Bjorkestol K. On the moments of Cochran’s Q statistic under the null hypothesis, with application to the meta-analysis of risk difference. Research Synthesis Methods. 2011;2:254–270. doi: 10.1002/jrsm.54. [DOI] [PubMed] [Google Scholar]
- 19.Kulinskaya E, Dollinger MB, Bjorkestol K. Testing for homogeneity in meta-analysis I. The one-parameter case: standardized mean difference. Biometrics. 2011;67:203–212. doi: 10.1111/j.1541-0420.2010.01442.x. [DOI] [PubMed] [Google Scholar]
- 20.Jackson D, Turner R, Rhodes K, Viechtbauer W. Methods for calculating confidence and credible intervals for the residual between-study variance in random effects meta-regression models. BMC Medical Research Methodology. 2014;14:103. doi: 10.1186/1471-2288-14-103. [DOI] [PMC free article] [PubMed] [Google Scholar]
- 21.Jackson D. Confidence intervals for the between-study variance in random effects meta-analysis using generalized Cochran heterogeneity statistics. Research Synthesis Methods. 2013;4:220–229. doi: 10.1002/jrsm.1081. [DOI] [PubMed] [Google Scholar]
- 22.Higgins JPT, Thompson SG. Quantifying heterogeneity in a meta-analysis. Statististics in Medicine. 2002;21:1539–1558. doi: 10.1002/sim.1186. [DOI] [PubMed] [Google Scholar]
- 23.Berkey CS, Hoaglin DC, Mosteller F, Colditz GA. A random-effects regression model for meta-analysis. Statistics in Medicine. 1995;14:395–411. doi: 10.1002/sim.4780140406. [DOI] [PubMed] [Google Scholar]
- 24.Thompson SG, Higgins JPT. How should meta-regression analyses be undertaken and interpreted? Statistics in Medicine. 2002;21:1559–1573. doi: 10.1002/sim.1187. [DOI] [PubMed] [Google Scholar]
- 25.IntHout NM, Ioannidis JPA, Borm GF. The Hartung-Knapp-Sidik-Jonkman method for random effects meta-analysis is straightforward and considerably outperforms the standard DerSimonian-Laird method. BMC Medical Research Methodology. 2014;14:25. doi: 10.1186/1471-2288-14-25. [DOI] [PMC free article] [PubMed] [Google Scholar]
- 26.Han B, Eskin E. Random-Effects Model Aimed at Discovering Associations in Meta-Analysis of Genome-wide Association Studies. The American Journal of Human Genetics. 2011;88:586–598. doi: 10.1016/j.ajhg.2011.04.014. [DOI] [PMC free article] [PubMed] [Google Scholar]
- 27.Sidik K, Jonkman JN. A Note on Variance Estimation on Random Effects Meta-Regression. Journal of Biopharmaceutical Statistics. 2005;15:823–838. doi: 10.1081/BIP-200067915. [DOI] [PubMed] [Google Scholar]
- 28.Laird NM, Mosteller F. Some statistical methods for combining experimental results. International Journal of Technological Assessment of Health Care. 1990;6:5–30. doi: 10.1017/s0266462300008916. [DOI] [PubMed] [Google Scholar]
- 29.Hartung J, Knapp G. A refined method for the meta-analysis of controlled clinical trials with binary outcome. Statistics in Medicine. 2001;20:3875–3889. doi: 10.1002/sim.1009. [DOI] [PubMed] [Google Scholar]
- 30.Lin D, Zeng D. Meta-analysis of genome-wide association studies: No efficiency gain in using individual participant data. Genetic Epidemiology. 2010;34:60–66. doi: 10.1002/gepi.20435. [DOI] [PMC free article] [PubMed] [Google Scholar]
- 31.Heid IM, Huth C, Loos RJF, Kronenberg F, Adamkova V, et al. Meta- Analysis of the INSIG2 Association with Obesity Including 74,345 Individuals: Does Heterogeneity of Estimates Relate to Study Design? PLoS Genet. 2009;5(10) doi: 10.1371/journal.pgen.1000694. [DOI] [PMC free article] [PubMed] [Google Scholar]
- 32.Herbert A, Gerry NP, McQueen MB, Heid IM, Pfeufer A, et al. A common genetic variant is associated with adult and childhood obesity. Science. 2006;312:279–283. doi: 10.1126/science.1124779. [DOI] [PubMed] [Google Scholar]


