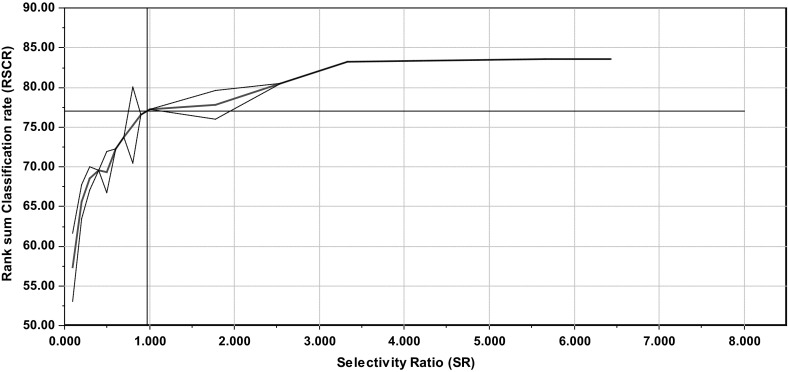
Fig. 2.

Discriminating variable (DIVA) plot obtained for gender differences in lipoprotein pattern. The plot shows rank sum classification rate (RSCR) as a function of increasing abs(SR). For SR = ±1 the DIVA plot shows that the RSCR is 77 %. The dashed lines around the red line showing the RSCR represent the standard deviation in intervals with more than one SR value. The RSCR is plotted in the middle of each SR interval (Color figure online)
