Abstract
The beneficial effect of dipeptidyl peptidase-4 inhibition on diet-induced extra-pancreatic effects, especially on liver tissue remains poorly understood. Thus, we made the experimental designs as follows; five-week-old male ob/ob mice, which develop type 2 diabetic mellitus and nonalcoholic fatty liver disease by taking a high-carbohydrate diet (HCD), were divided into a group in which a HCD was given for 8 weeks as control, and another in which a HCD added with 0.0018% sitagliptin was given for 8 weeks. Hepatic steatosis was seen in all mice, but the mean grade of steatosis in the sitagliptin-administrated mice was significantly decreased. The acetyl-CoA concentrations were lower in sitagliptin-administrated mice, although the differences were not significant. However, the malonyl-CoA concentrations were significantly lower in sitagliptin-administrated mice. The expression of acetyl-CoA carboxylase 1 was inhibited in sitagliptin-administrated mice, irrespective of expressions of carbohydrate responsive element-binding protein (ChREBP) or sterol regulatory element-binding protein (SREBP)-1c. In conclusion, sitagliptin may affect the development of nonalcoholic fatty liver disease by inhibiting the production of malonyl-CoA and thus synthesis of fatty acids in the liver.
Keywords: sitagliptin, steatosis, high-fructose, GLP-1, ACC1
Introduction
Nonalcoholic fatty liver disease (NAFLD) is reported in some Western countries to be the most common liver disease, surpassing the prevalence of chronic hepatitis C virus or alcoholic liver disease.(1) Histological changes due to NAFLD range over a wide spectrum, extending from simple steatosis to non-alcoholic steatohepatitis (NASH), liver cirrhosis and liver failure, and sometimes, even hepatocellular carcinoma.(2) NAFLD is considered as a hepatic manifestation of metabolic syndrome and is particularly associated with insulin resistance, obesity, hypertension and abnormalities of glucose and lipid metabolism.(3) NAFLD is characterized by the accumulation of triglycerides (TGs) in the liver. We previously reported that lipopolysaccharides could be associated with the development of hepatic steatosis.(4) However, the mechanism of hepatic fat accumulation in NAFLD is incompletely understood. Potential contributors include increased delivery of fatty acids to the liver, excessive de novo lipogenesis, decreased TGs export, and decreased oxidation of fatty acids. Hepatic fat accumulation resulting from increased de novo fatty acid synthesis leads to hepatic steatosis and hepatic insulin resistance. The accumulation of excessive TGs in animal tissues, including the liver, is strongly associated with insulin resistance, a major component of metabolic syndrome.(5,6)
A dipeptidyl peptidase-4 (DPP-4) inhibitor, sitagliptin phosphate monohydrate, acts by inhibiting the breakdown of regulatory peptides, including incretins such as glucagon-like peptide-1 (GLP-1) or glucose-dependent insulinotropic polypeptide (GIP), and increasing insulin release.(7) DPP-4 inhibitors enhance levels of these gut-derived active incretin hormones that are released into the circulation after ingestion of a meal,(8,9) thereby decreasing the post meal rise in glucose concentrations and reducing fasting glucose concentrations in a glucose-dependent manner.(10,11) They have a modest efficacy for lowering glycosylated hemoglobin (HbA1c) compared to other anti-hyperglycemic agents and a low potential for hypoglycemia and weight change.(12)
Recently, sitagliptin has also been shown to prevent the development of hepatic steatosis induced by a fructose-rich diet in a rat model.(13) However, the beneficial effect of DPP-4 inhibition on diet-induced extrapancreatic effects, especially on liver tissue anti-inflammation, anti-fibrosis and anti-oxidative except for hepatic steatosis, remains poorly understood.
In this study, we analyzed the effect of sitagliptin, an orally active, potent, and highly selective DPP-4 inhibitor,(8) on liver function using ob/ob mice, an obese rodent model of type 2 diabetes mellitus (T2DM) that exhibits hyperglycemia, glucose intolerance, hyperinsulinemia, and hyperglucagonemia.(14)
Materials and Methods
Chemicals
The sitagliptin phosphate monohydrate used in this study was purchased from Carbosynth Ltd. (Compton, Berkshire, TG20 6NE, UK). Sitagliptin phosphate monohydrate was administrated orally by premixing with the high carbohydrate diet to a concentration of 0.0018%. This concentration of sitagliptin phosphate monohydrate has been used to treat patients with T2DM.
Animals
Obese male (ob/ob) 5-week-old mice were obtained from Oriental Bio Service (Kyoto, Japan). These mice have been extensively used as a naturally occurring model of hepatic steatosis. These mice are leptin deficient because a mutation in the ob gene encoding leptin transcription prevents its biosynthesis.(14)
Experimental designs
After weaning, mice were divided into two groups. One group [high carbohydrate diet (control group), n = 6] was fed a high carbohydrate diet (Oriental Bio Service, Kyoto, Japan) containing 9% of calories from fat, 22% from protein, and 69% (60% fructose) from complex carbohydrate. The experimental group (high carbohydrate diet with 0.0018% sitagliptin phosphate monohydrate (Sitagliptin group, n = 6) was fed an experimental diet. Mice were allowed free access to food until 17 weeks of age, with a 12-h light/12-h dark cycle under conditions of controlled temperature (22 ± 1°C) and humidity (50 ± 10%). Food intakes were measured daily, while individual body weight was recorded once a week. Mice were fasted overnight prior to euthanasia. All mice were sacrificed after completing their respective dietary regimens, and the livers of the individual animals were weighed. Liver were removed, samples placed in formalin and the remainder snap frozen and stored at –80°C. All surgical and experimental procedures were performed according to the guidelines for the care and use of animals approved by the Osaka Medical College.
Assay for plasma hepatic and metabolic parameters
Blood samples were obtained by cardiac puncture and separated by centrifugation (12,000 rpm, 15 min) as plasma. The levels of blood biochemical parameters, including aspartate aminotransferase (AST), alanine aminotransferase (ALT), glico albumin (GA), total-cholesterol (T-CHO), triglyceride (TG), free fatty acids (FFA), glucose, insulin, acetyl-coenzyme A (CoA) and malonyl-CoA were assayed by a local laboratory that does clinical analysis (ORIENTAL YEAST Co. Ltd., Kyoto, Japan).
Assay for hepatic lipid content
Hepatic tissues were homogenized with a Janke & Kunkel Polytron homogenizer (ULTRA-TURRAX TP18/1051; IKA-Labortechnik, Staufeni, Germany) in buffer (pH 7.4) containing 20 mM Tris HCl, 1.0 mM EGTA, 2.0 mM EDTA, and treated with protease inhibitor (2.0 µg/ml, leupeptin cocktail). Hepatic tissue TG levels were measured by a local laboratory that does clinical analysis (SRL Co. Ltd., Tokyo, Japan).
Histological analysis of hepatic tissue
The liver tissue from each mouse was fixed in 10% buffered formaldehyde, and then embedded in paraffin. A 4 mm thick section cut from a paraffin embedded tissue was stained with Hematoxylin & Eosin (H&E). These sections were evaluated for fat content by the absence of staining. For hepatic steatosis: grade 0 = no fat, grade 1 = steatosis occupying less than 33% of hepatic parenchyma, grade 2 = steatosis occupying 33–66% of the hepatic parenchyma, grade 3 = steatosis occupying more than 66% of the hepatic parenchyma. For inflammatory cell infiltration: grade 0 = none, grade 1 = 1–2 foci/field, grade 2 = 3–4 foci/field, grade 3 = more than 4 foci/field. For ballooning degeneration of the hepatocytes: grade 0 = absent, grade 1 = very mild inflammation, grade 2 = mild-to-moderate portal inflammation, grade 3 = intraacinar inflammation and moderate portal inflammation. For hepatic fibrosis: stage 0 = none, stage 1 = mild perisinusoidal, stage 2 = moderate perisinusoidal fibrosis, stage 3 = periportal fibrosis, stage 4 = bridging fibrosis.(15)
Real-time PCR
Tissue specimens were preserved in RNAlater reagent (QIAGEN, Hiden, Germany) until the isolation of the total RNA. Total RNA was isolated from the liver tissue using a QIA shredder and an RNeasy kit (QIAGEN). cDNA was prepared using the Taqman reverse transcriptase kit (QIAGEN). Real-time PCR was performed on total RNA using the StrataScript First Strand cDNA Synthesis Kit and FullVelocity SYBR Green QPCR Master Mix (Stratagene, La Jolla, CA) according to the manufacturer’s protocol. Primers for real-time PCR were designed using BEACON DESIGNER software ver. 2.12, according to the parameters outlined in the BioRad iCycler Manual, using reference mRNA sequences accessed through Gene Bank and as shown in Table 1. All probes used in the Taqman Gene Expression Assays were purchased from Applied Biosystems. PCR reactions were carried out in the I-cycler Thermal Cycler (Bio-Rad Laboratories Hercules, CA). PCR products were detected using the I-Cycler IQ Real-Time PCR Detection System (Bio-Rad). The relative amount of mRNA was calculated by comparative cycle time determination with ribosomal protein RPL32 as the invariant control. Gene expression values were calculated based on the ddCt method. The results are expressed as fold increase in expression relative to the control group.
Table 1.
Primer sequences used for the real-time polymerase chain reaction
| Gene | Primer Sequences (Sense) | Primer Sequences (Antisense) |
|---|---|---|
| TNF-α | 5'-ACCTTGTTGCCTCCTCTT-3' | 5'-GTTCAGTGATGTAGCGACAG-3' |
| IFN-γ | 5'-CGGCACAGTCATTGAAAGCCTA-3' | 5'-GTTGCTGATGGCCTGATTGTC-3' |
| IL-1β | 5'-TCCAGGATGAGGACATGAGCAC-3' | 5'-GAACGTCACACACCAGCAGGTTA-3' |
| IL--6 | 5'-TTCCTCACTGTGGTCAGA-3' | 5'-CATTCATATTGTCAGTTCTTCGTA-3' |
| SREBP-1c | 5'-GGTACCTGCGGGACAGCTTA-3' | 5'-CCGTGAGCTACCTGGACTGAA-3' |
| FAS | 5'-TACAGATGGCAGCAAGGA-3' | 5'-TGATACAGAGAGCAGATGAGT-3' |
| ChREBP | 5'-TCGTGTAGACAACAAC-3' | 5'-ATATTGAACCGCCTCT-3' |
| PPARα | 5'-ATGGCAGCAATATCAGAG-3' | 5'-AGCAGTAAAGTATCATATCAAAG-3' |
| PPARγ | 5'-GAAGACAGAGACAGACAT-3' | 5'-GCAATCAATAGAAGGAACA-3' |
| SCD-1 | 5'-CTGGCTGGAGAGTCATCA-3' | 5'-TAACGAGGACGACAATACAATC-3' |
| ACL | 5'-ACCCAGACATGCGAGTGCAG-3' | 5'-CCGTCCACATTCAGGATAAGATTTG-3' |
| ACC1 | 5'-ATCATAACTCGTATAACATCCA-3' | 5'-CAGGTTAAGGCTCAGACT-3' |
| ACC2 | 5'-CCTCAGCCGAGTAAATGG-3' | 5'-TAAGTGTCTAATAAGCCTCATCA-3' |
| CPT-1A | 5'-GACTACTTGCTAACCTCTGT-3' | 5'-GACACTGGAGACCTGAGA-3' |
| CPT-1B | 5'-CGGAGGAACCTGTCTTCA-3' | 5'-GGCTAAGGACCAATCATTGT-3' |
| IRS-1 | 5'-GCCTTCCATATAGTTA-3' | 5'-GAACCATCATCATCTC-3' |
| IRS-2 | 5'-CCATCCTTTGCCCACA-3' | 5'-GTACTGCTGCCTTCAC-3' |
| PI3K | 5'-GCAGTTAAGAAGCACA-3' | 5'-GTATGAAGCAGGAGAG-3' |
| AMPK | 5'-AAGCCGACCCAATGACATCA-3' | 5'-CTTCCTTCGTACACGCAAAT-3' |
| Acyl-CoA synthetase | 5'-ATGATAATGCGGTGAT-3' | 5'-TACTTGTTACTGTCCA-3' |
| MCAD | 5'-CGGAGGAACCTGTCTTCA-3' | 5'-GGCTAAGGACCAATCATTGT-3' |
| LCAD | 5'-GACATCTGCCTACATCCT-3' | 5'-TCTCTCCCTGTGTTAATCTT-3' |
| ECH | 5'-AGTCTATTCAAGTCACAAGT-3' | 5'-ATGGCATTCCTCTTCTCT-3' |
| HADH | 5'-ATCTTAACCATCACTGTC-3' | 5'-TAGTAGAGTCAATTCATAGG-3' |
| 3-KAT | 5'-AGGTTGTCACGCTACTCA-3' | 5'-ATCCCAGTCCCGATACAC-3' |
Assay for plasma GLP-1 concentration
Total plasma GLP-1 concentrations were measured by using a GLP-1, Active from assay kit-IBL according manufacture’s protocol (Immuno-Biological Laboratories Co., Ltd., Gunma, Japan).
Western blotting
Proteins were extracted from liver and resolved by electrophoresis on a 10% SDS-polyacrylamide gel and transferred to nitrocellulose membranes. Specific rabbit polyclonal antibodies against mouse acetyl-CoA carboxylase 1 (ACC1; ab72046; Abcam, UK), fatty acid synthase (FAS; ab68338; Abcam), carbohydrate responsive element-binding protein (ChREBP; ab81958; Abcam) and specific mouse monoclonal antibodies against sterol regulatory element-binding protein-1c (SREBP-1c; ab3259; Abcam) were used. The membranes were washed and incubated with goat anti-rabbit IgG-horseradish peroxidase conjugated secondary antibody (anti-mouse IgG-HRP #SC-2005, anti-rabbit IgG-hrp #SC-2030; Santa Cruz Biotechnology, Dallas, TX). The proteins were detected using a chemiluminescence kit (Mini-PROTEAN TGX Gels; Bio-Rad), and quantitated using the Imaging System (LAS3000; Fuji Film, Japan).
Statistics and data analyses
Data are presented as a mean ± SEM. Statistical analyses were performed using Student’s t test. P values of less than 0.05 were considered statistically significant.
Results
Effect of treatment with diets on body weight and liver/body weight ratio
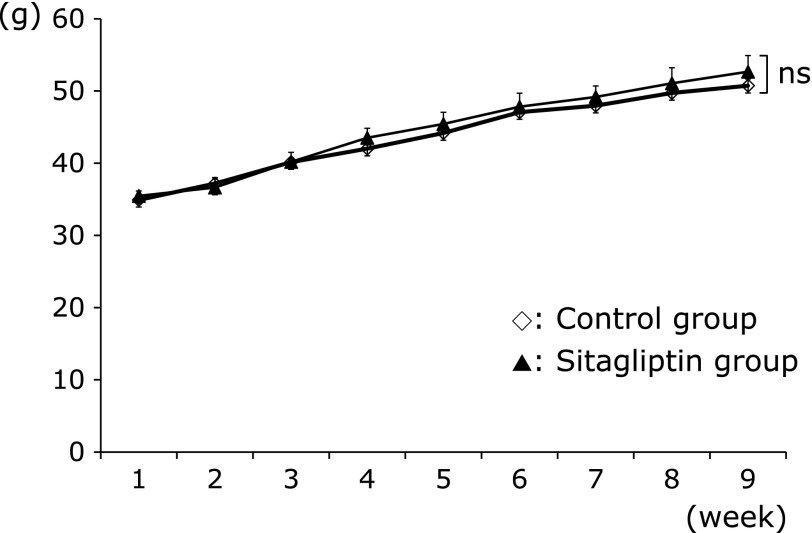
As shown in Fig. 1, at the end of the experimental period, there was no significant difference in the weight of mice in the two groups; Control group 48.72 ± 1.17 g and Sitagliptin group 50.04 ± 1.28 g (p<0.05). As shown Table 2, the ratio of liver weight to body weight was not significantly different between the two groups of mice; Control group 7.20 ± 0.55 and Sitagliptin group 7.52 ± 0.41% (p<0.05).
Fig. 1.
Effects of treatments with sitagliptin on body weight. Data are shown as the mean ± SD. ns, not significant.
Table 2.
Outcome of liver/body weight ratio and biochemical parameters in two groups mice
| Parameters | Control group (n = 6) | Sitagliptin group (n = 6) |
|---|---|---|
| Liver/Body weight ratio (%) | 7.20 ± 0.55 | 7.52 ± 0.41 |
| AST (IU/ml) | 1749.83 ± 366.03 | 817.67 ± 208.54* |
| ALT (IU/ml) | 1556.67 ± 368.39 | 748.33 ± 199.64* |
| T-CHO (mg/dl) | 225.67 ± 24.70 | 201.0 ± 15.43* |
| TG (mg/dl) | 34.83 ± 12.70 | 19.80 ± 4.21* |
| Glucose (mg/dl) | 313.83 ± 46.73 | 240.33 ± 49.94* |
| GA (%) | 2.97 ± 0.52 | 2.30 ± 0.32* |
| Insulin (ng/ml) | 1.32 ± 0.15 | 3.27 ± 2.08* |
| Hepatic TG (mg/dl) | 37.99 ± 3.49 | 29.97 ± 1.72* |
Plasma and hepatic biochemical parameters
To examine whether the two diets affected liver damage and steatosis, we quantified plasma levels of AST, ALT, T-CHO, TG and hepatic levels of TG. For the Control group and the Sitagliptin group the plasma AST levels were 1,749.83 ± 366.03 vs 817.67 ± 208.54 IU/L (p<0.05), and the ALT levels were 1,556.67 ± 368.39 vs 748.33 ± 199.64 IU/L (p<0.05), both show a significant difference between groups (Table 2). Mice fed the diet containing sitagliptin had lower plasma levels of T-CHO, 225.67 ± 24.70 vs 201.0 ± 15.43 mg/dl (p<0.05) and TG 34.83 ± 12.70 vs 19.80 ± 4.21 mg/dl (p<0.05), and hepatic TG content 37.99 ± 3.49 vs 29.97 ± 1.72 mg/dl (p<0.05) (Table 2).
Plasma glucose, insulin and GA
Mice fed the diet containing sitagliptin had lower fasting blood glucose than the Control group (240.33 ± 49.94 mg/dl vs 313.83 ± 46.73 mg/dl, p<0.05), higher fasting plasma insulin (3.27 ± 2.08 ng/dl vs 1.32 ± 0.15 ng/dl, p<0.05), and lower levels of GA (2.30 ± 0.32% vs 2.97 ± 0.52%, p<0.05) (Table 2).
Histological analysis
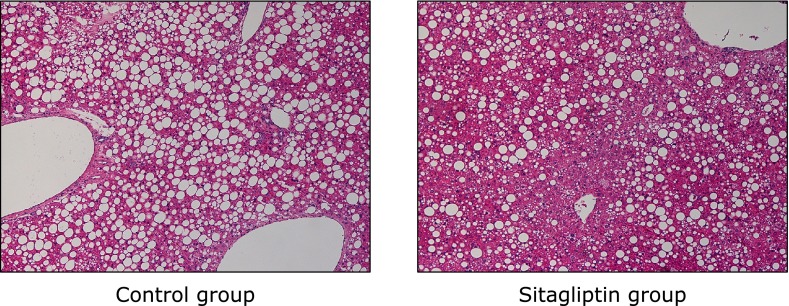
Hepatic steatosis was seen in all mice in both the Control group and Sitagliptin group, but the mean grade of steatosis in the Sitagliptin group was significantly lower than in the Control group (Table 3). In the Sitagliptin group, there were five mice with grade-1 and one with grade-2 steatosis, whereas in the Control group five mice had grade-2 steatosis and there was one mouse with grade-3 steatosis (Table 3). Hepatic lobular necroinflammation was not observed in the periportal field of the hepatic parenchyma in either group (Table 3 and Fig. 2). Ballooning degeneration and fibrosis were not observed in any of the mice (Table 3 and Fig. 2).
Table 3.
Histological findings of the liver in two groups mice
| Control group (n = 6) | Sitagliptin group (n = 6) | |
|---|---|---|
| Hepatic steatosis | 6/6 (100) | 6/6 (100) |
| Grade 1 | 0 (0) | 5 (83.3) |
| Grade 2 | 5 (83.3) | 1 (16.7) |
| Grade 3 | 1 ((16.7) | 0 (0) |
| Necroinflammation | 0/6 (0) | 0/6 (0) |
| Grade 1 | 0 (0) | 0 (0) |
| Grade 2 | 0 (0) | 0 (0) |
| Grade 3 | 0 (0) | 0 (0) |
| Ballooning degeneration | 0/6 (0) | 0/6 (0) |
| Fibrosis | 0/6 (0) | 0/6 (0) |
The numbers are expressed as number of subjects and percentage.
Fig. 2.
Effects of a diet containing sitagliptin of a diet on the livers of ob/ob mice. Hematoxylin and Eosin staining (original magnification ×150).
Hepatic pro-inflammatory mRNA expressions
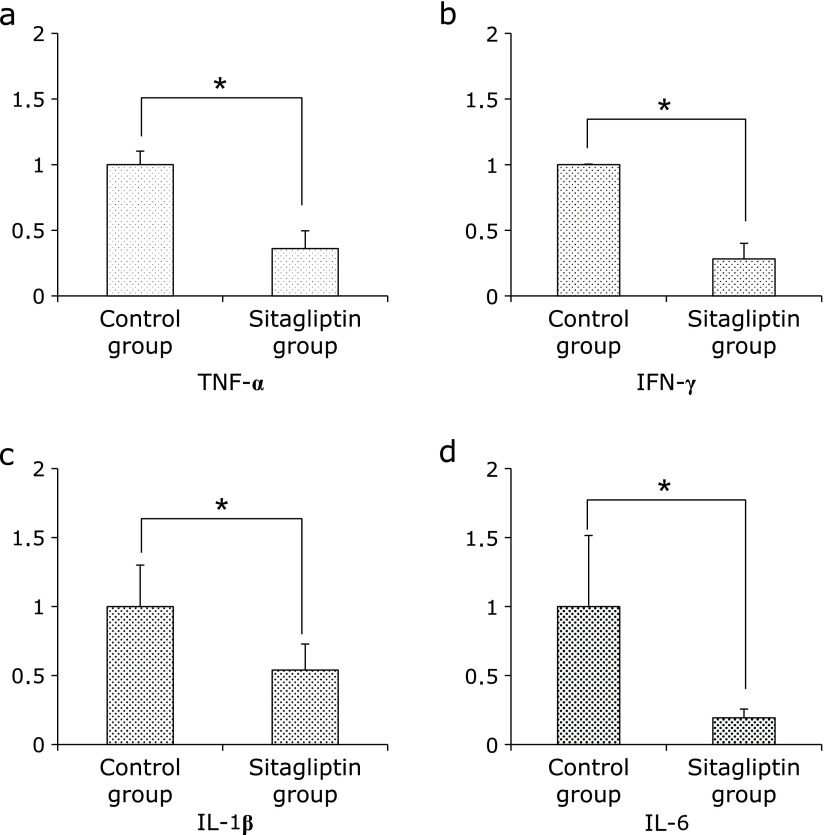
Since the biochemical parameters, such as levels of AST and ALT, were significantly decreased in the Sitagliptin group, we examined the expression of hepatic proinflammatory cytokines. The mRNA levels of tumor necrosis factor (TNF)-α, interferon (IFN)-γ, interleukins (IL)-1β and IL-6 were significantly decreased in the Sitagliptin group (p<0.05, Fig. 3).
Fig. 3.
Expression of proinflammatory mRNA in specimens of hepatic tissue evaluated by quantitative RT-PCR. (a) TNF-α (b) IFN-γ (c) IL-1β and (d) IL-6. The results shown represent mean ± SD of relative levels of target mRNA of six mice per group. *p<0.05 vs Sitagliptin group.
Hepatic lipogenic-related mRNA expressions
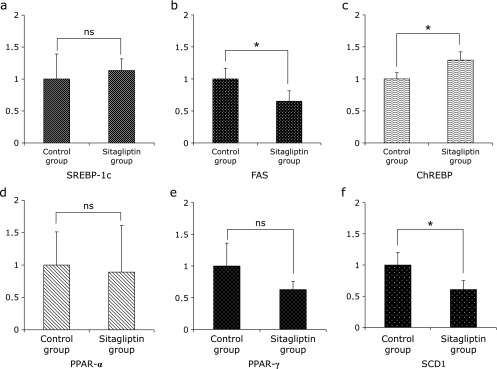
The observed histological findings and hepatic TG content suggest that the expression of cytokines is involved in the development of NAFLD. In the present study, the hepatic TG content in the Sitagliptin group was reduced (Table 2). However, the mRNA expression level of sterol regulatory element-binding protein (SREBP)-1c was not significantly different between the two groups, and the mRNA expression level of carbohydrate responsive element-binding protein (ChREBP) was increased in the Sitagliptin group (Fig. 4). In addition, the mRNA expression levels of fatty acid synthase (FAS) and stearoyl-CoA desaturase (SCD)-1 were significantly decreased in the Sitagliptin group (Fig. 4). And, the expression of peroxisome proliferator-activated receptor (PPAR)α, a key element in β-oxidation of free fatty acids was not significantly different between the Control and Sitagliptin groups (Fig. 4). The expression of PPARγ was also not significantly different between the two groups (Fig. 4).
Fig. 4.
Expression of lipogenic-related mRNA in specimens of hepatic tissue evaluated by quantitative RT-PCR. (a) SREBP-1c (b) FAS (c) ChREBP (d) PPAR-α (e) PPAR-γ and (f) SCD1. The results shown represent mean ± SD of relative levels of target mRNA for six mice per group. *p<0.05 vs Sitagliptin group.
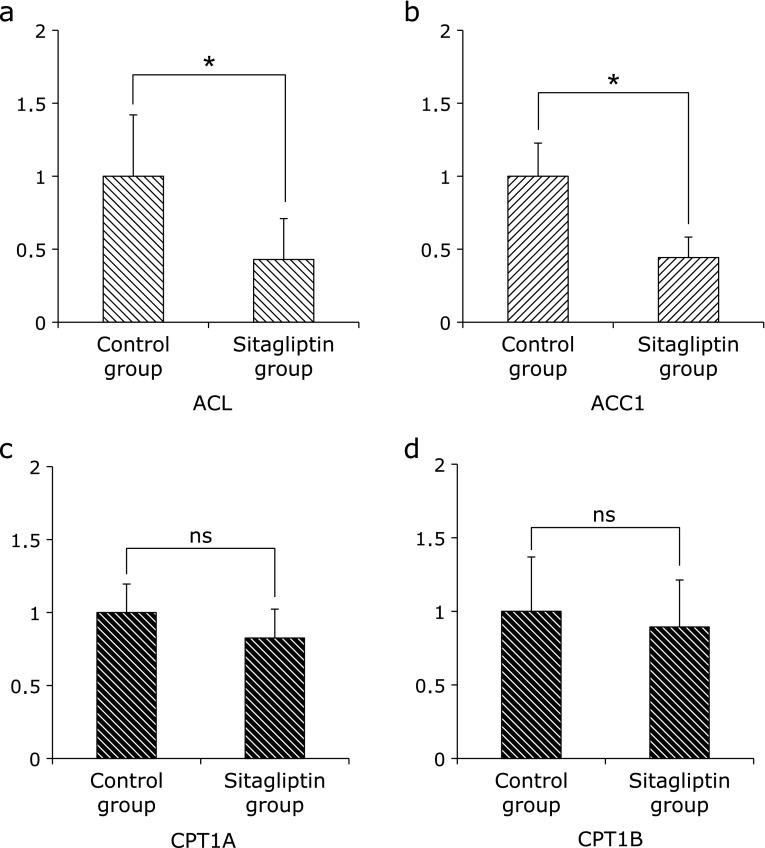
Furthermore, we examined the expression of these hepatic lipogenic-related enzymes. The expression of ATP-citrate lyase (ACL) and Acetyl-CoA carboxylase (ACC)1 were significantly decreased in the Sitagliptin group (Fig. 5). However the expression of carnitine palmitoyltransferase (CPT)1A and CPT1B were not significantly different between the Control group and Sitagliptin group (Fig. 5).
Fig. 5.
Expression of fatty acid β-oxidation-related mRNA in specimens of hepatic tissue evaluated by quantitative RT-PCR. (a) ACL (b) ACC1 (c) CPT1A and (d) CPT1B. The results shown represent mean ± SD of relative levels of target mRNA for six mice per group. *p<0.05 vs Sitagliptin group.
Insulin signaling-related mRNA expressions
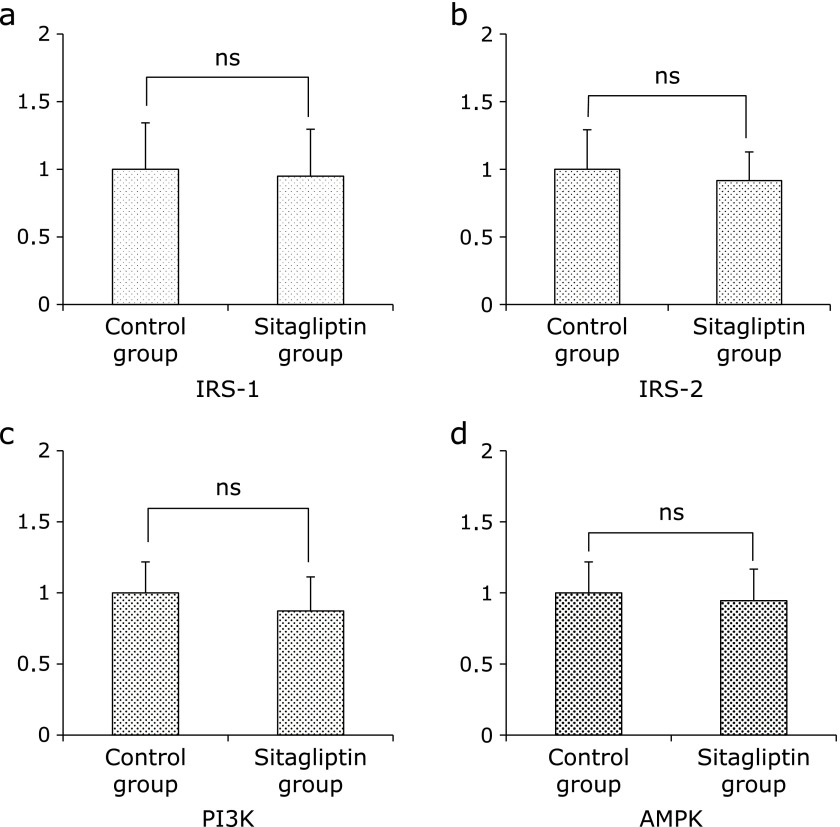
Since the insulin resistance is associated with the development of NAFLD, we examined the hepatic insulin signaling-related genes. The expression of insulin receptor substrates (IRS)-1, IRS-2, phosphoinositide 3-kinase (PI3K) and AMP-activated kinase (AMPK) were not significantly different between the Control group and Sitagliptin group (Fig. 6).
Fig. 6.
Expression of insulin signaling-related mRNA in specimans of hepatic tissue evaluated by quantitative RT-PCR. (a) IRS-1 (b)IRS-2 (c) PI3K and (d) AMPK. The results shown represent mean ± SD of relative levels of target mRNA for six mice per group. *p<0.05 vs Sitagliptin group.
Mitochondrial oxidation of free fatty acid-related mRNA expressions
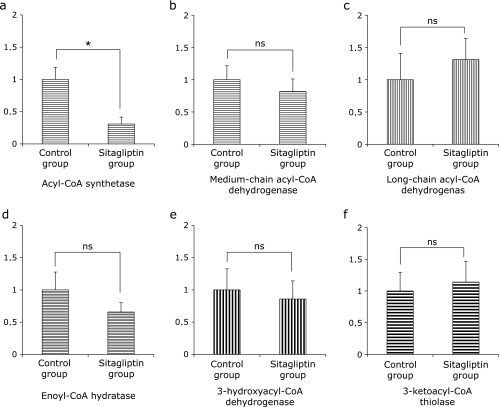
Once the fatty acid is inside the mitochondrial matrix, β-oxidation can begin. It has four steps.(16) We examined the expression of mitochondrial oxidation of fatty acid-related genes, such as acyl-CoA synthtase, medium-chain acyl-CoA dehydrogenase (MCAD), long-chain acyl-CoA dehydrogenase (LCAD), enoyl-CoA hydratase (ECH), 3-hydroxyacyl-CoA dehydrogenase (HAD), and 3-ketoacyl-CoA thiolase (3-KAT). The expression of acyl-CoA synthetase was significantly decreased in the Sitagliptin group (Fig. 7). However, the expressions of other genes were not significantly different between the two groups (Fig. 7).
Fig. 7.
Expression of mitochondrial β-oxidation-related mRNA in specimens of hepatic tissue evaluated by quantitative RT-PCR. (a) acyl-CoA synthetase (b) MCAD (c) LCAD (d) ECH (e) HAD and (f) 3-KAT. The results shown represent mean ± SD of relative levels of target mRNA from six mice per group. *p<0.05 vs Sitagliptin group.
Assay for plasma GLP-1
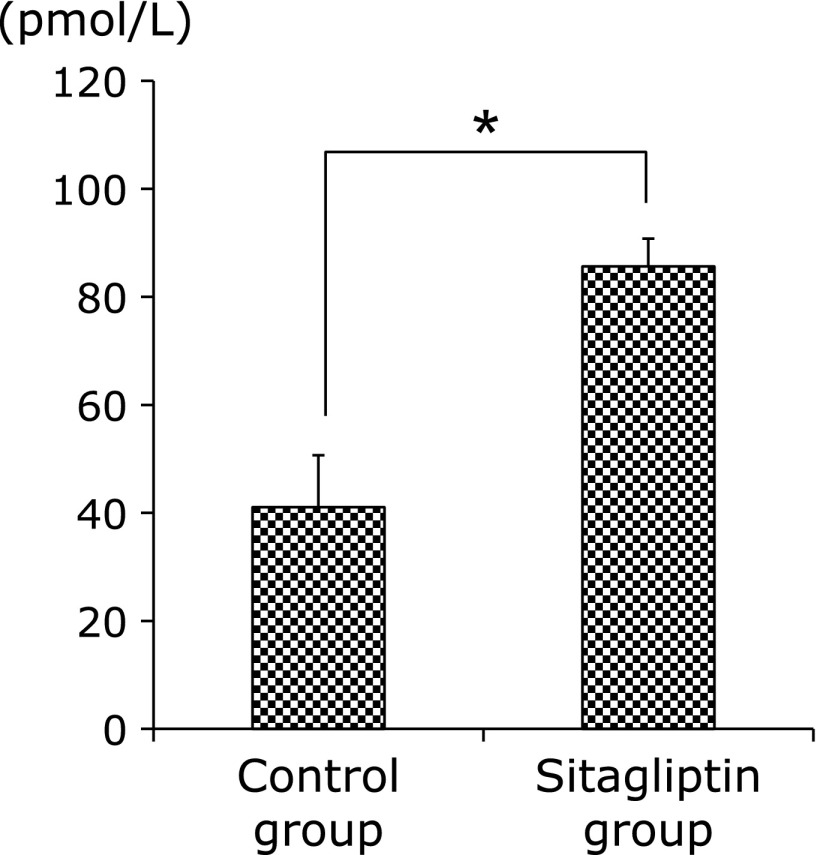
Since GLP-1 prevents the development of metabolic syndrome such as NAFLD,(17) therefor we examined this concentration. As expected, plasma concentration of GLP-1 was higher in Sitagliptin group (Fig. 8).
Fig. 8.
Levels of plasma GLP-1 concentration between both groups. Data are shown as the mean ± SD (*p<0.05).
Change in levels of lipogenic-related protein
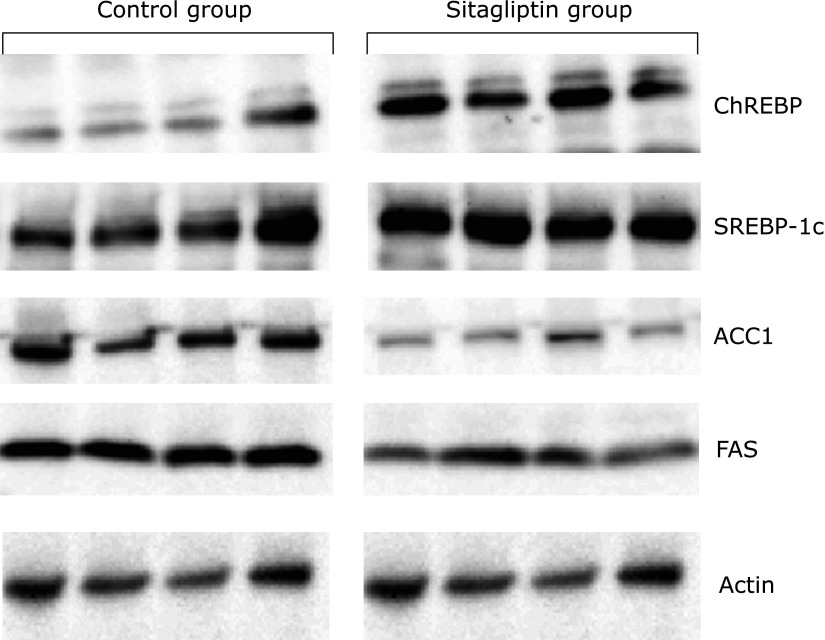
The prevention of hepatic steatosis in the Sitagliptin group was considered to be due to lipogenic enzymes. Therefore, we examined the effects of sitagliptin on the hepatic protein levels and enzymatic activities of representative ChREBP- and SREBP-1c-responsive lipogenic enzymes, including ACC1 and FAS. Biochemical analysis showed that ChREBP and SREBP-1c protein levels were increased in the liver extract of Sitagliptin group (Fig. 9), while FAS and ACC1 protein levels were decreased in the liver extract of the Sitagliptin group (Fig. 9).
Fig. 9.
Western blotting analysis of liver content of ChREBP, SREBP-1c, ACC1 and FAS in both groups.
Assay for plasma acetyl-CoA and malonyl-CoA
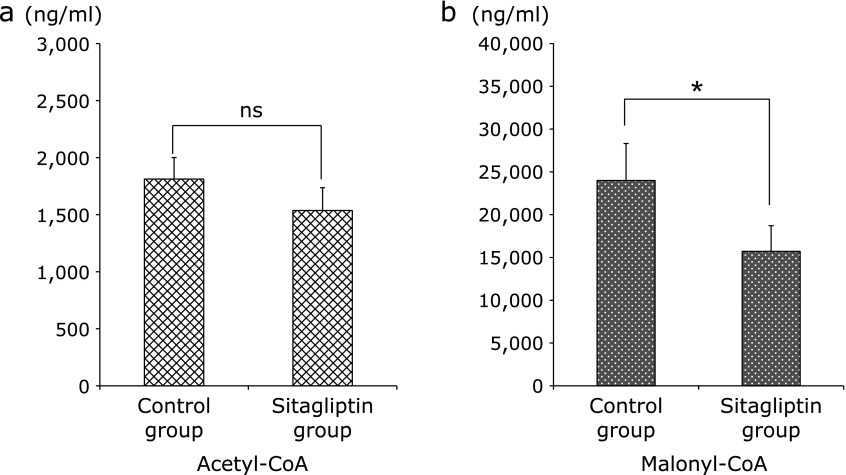
The synthesis of malonyl-CoA is the committed step toward the synthesis of fatty acids;(18) therefore we examined these concentrations. The concentration of acetyl-CoA was lower in Sitagliptin group, although the differences were not significant; however the concentration of malonyl-CoA was significantly lower in the Sitagliptin group (Fig. 10).
Fig. 10.
Levels of plasma acetyl-CoA and malonyl-CoA between the two groups. (a) Levels of plasma acetyl-CoA were measured in both groups. (b) Levels of plasma malonyl-CoA were measured in both groups. Data are shown as the mean ± SD (*p<0.05).
Discussion
NAFLD is associated with T2DM and obesity in many patients. In this study, we assessed the effects of the anti-diabetic drug sitagliptin on NAFLD induced in an animal model of these diseases (ob/ob mouse) by feeding a fructose-based high-carbohydrate diet.
During the present study, we compared mice fed HCD containing sitagliptin and those fed HCD alone, and found no significant difference in weight gain between the two groups. However, histological examination of their livers revealed that the livers of mice fed HCD containing sitagliptin showed less hepatic steatosis than livers of the mice fed HCD alone. To determine the mechanism contributing to these histological differences, we examined plasma parameters associated with liver dysfunction and plasma lipid levels, as well as hepatic TG concentrations; parameters we hypothesized may be different between the two groups. We found that plasma AST and ALT levels (parameters of liver dysfunction) were significantly lower in mice fed HCD containing sitagliptin. These mice also showed lower plasma and hepatic TG concentrations (hepatic TG concentration is a hallmark of hepatic steatosis). In these mice, the plasma glucose levels were lower, but the plasma insulin levels were not. In addition, whereas IRS-1 and IRS-2 signaling is associated with hepatic insulin resistance,(19) the mRNA expressions of hepatic IRS-1, IRS-2, PI3K and AMPK were not significantly different between the two groups. These findings failed to show that sitagliptin might improve insulin-resistance, which was a result that we had expected to find.
The most interesting finding from the present study was that the histological examination indicated the possibility of sitagliptin (a drug used for the treatment of T2DM) preventing the expression of hepatic steatosis of the liver induced by intake of a fructose-based diet. On the other hand, a previous report showed GLP-1 was effective for the development of hepatic steatosis.(17) And our results showed plasma level of GLP-1 significantly increased in Sitagliptin group. GLP-1 had an effect to decrease body weight, however there was no significant difference in body weights between the two groups. Therefore we examined whether some factors except GLP-1 were associated with these histological changes. To determine the mechanism, we investigated hepatic expression of genes known to be associated with the progression of NAFLD, as well as various lipid-related genes, including factors associated with mitochondrial β-oxidation. Comparison of the relative expression of the inflammatory cytokines TNF-α, IL-6, IL-1β, and IFN-γ in the liver revealed lower expression in mice fed HCD containing sitagliptin. Hepatic steatosis is caused by abnormally enhanced de novo lipid synthesis and fat delivery. ChREBP has recently emerged as a major mediator of glucose action in the control of glycolysis and lipogenesis in the liver. Induction of lipogenic genes such as ACC1 and FAS is under the concerted action of ChREBP and of the transcription factor SREBP-1c in response to glucose and insulin, respectively.(20,21) In the nucleus, SREBP-1c transcriptionally activates all genes required for lipogenesis.(22) The expression of the representative lipid synthesis-related genes SREBP-1c and ChREBP were not lower in mice fed HCD containing sitagliptin, which was not consistent with the histological findings. However, the expressions of FAS were lower in mice fed HCD containing sitagliptin. In addition to FAS, stearoyl-CoA desaturase-1 (SCD-1) may be critical to the elimination of triglyceride accumulation in hepatocytes.(23) The expression of SCD1, which accelerates degradation of fatty acids, was lower in mice fed HCD containing sitagliptin.
To explain the inconsistency between the histological findings and expression of lipid-related genes noted between the two groups, we further studied genes associated with oxidation of fatty acids and mitochondrial β-oxidation. Once the fatty acid is inside the mitochondrial matrix, β-oxidation can begin according to four steps(16). The expression of acyl-CoA synthetase, which is associated with mitochondrial β-oxidation, was lower in mice fed a diet containing sitagliptin, whereas no significant differences were detected between the two groups with respect to the factors associated with the other steps of β-oxidation. Therefore, it was unlikely that sitagliptin was involved in mitochondrial β-oxidation.
ACL is an important lipogenic enzyme that regulates the flow of glucose carbons to cytosolic acetyl-CoA(24). In eukaryotes, ACC is a biotinylated enzyme that catalyzes the ATP-dependent carboxylation of acetyl-CoA to produce malonyl-CoA. In animals there are two ACC genes: ACC1 and ACC2. ACC1 is a protein that is mainly expressed in liver and adipose tissue.(25) Subsequently, we investigated factors that are associated with the production of acetyl-CoA and malonyl-CoA, which are largely responsible for fat accumulation in the liver. Significant difference was found in the expressions of ACL between the two groups. Furthermore, the expression of ACC1 was lower in mice fed HCD containing sitagliptin. ACL, ACC1 and FAS are key genes involved in fat accumulation in the liver caused by intake of fructose, and the expression of these genes are regulated by ChREBP and SREBP-1c.(26) However, during our present study, the expression of ACL, ACC1 and FAS were inhibited in mice fed a diet containing sitagliptin, irrespective of the expression of ChREBP or SREBP-1c and without being affected by the expression of CPT1A. ACL is a rate-limiting enzyme necessary for production of acetyl-CoA from citrate, and ACC1 is a rate-limiting enzyme necessary for production of malonyl-CoA from acetyl-CoA. During our study, the acetyl-CoA concentrations were lower in mice fed HCD containing sitagliptin, although the differences were not significant. In addition, the malonyl-CoA concentrations were significantly lower in mice eating a HCD containing sitagliptin. This seems to partly explain the histological differences noted between the two groups. In addition, this findings support the published report that the malonyl-CoA produced by ACC1 is involved in the noble synthesis of fatty acids in ACC1-knockout mice.(27)
In summary, it was suggested that a decrease in production of the malonyl-CoA by inhibiting expression of ACC1 greatly influenced the fat accumulation to liver. This would inhibit part of the process of hepatic steatosis, without mediating the expression of ChREBP or SREBP-1c.
Of course, sitagliptin increased the concentration of GLP-1 that improves the development of hepatic steatosis, however the drug seems to prevent the development of NAFLD by inhibiting the expression of various inflammatory cytokines in the liver and by inhibiting the expression of genes related to lipid synthesis. The findings that sitagliptin inhibited hepatic steatosis of obese mice suggests that this diabetes mellitus drug can prevent NAFLD in patients with T2DM and obesity.
Acknowledgments
The authors would like to thank Yukio Nakahira and Eiko Koubayashi, at the Osaka Medical College, for providing them with technical support.
Abbreviations
- ACC
acetyl-CoA carboxylase
- ACL
ATP-citrate lyase
- ALT
alanine aminotransferase
- AST
aspartate aminotransferase
- ChREBP
carbohydrate responsive element-binding protein
- CoA
coenzyme A
- CPT
carnitine palmitoyltransferase
- DPP-4
dipeptidyl peptidase-4
- ECH
enoyl-CoA hydratase
- FAS
fatty acid synthase
- FFA
free fatty acids
- GA
glico albumin
- GIP
glucose-dependent insulinotropic polypeptide
- GLP-1
glucagon-like peptide-1
- H&E
Hematoxylin & Eosin
- HbA1c
glycosylated hemoglobin
- HCD
high-carbohydrate diet
- IFN
interferon
- IL
interleukins
- LCAD
long-chain acyl-CoA dehydrogenase
- MCAD
medium-chain acyl-CoA dehydrogenase
- MMP-13
matrix metallopeptidase-13
- NAFLD
nonalcoholic fatty liver disease
- NASH
non-alcoholic steatohepatitis
- PPAR
peroxisome proliferator-activated receptor
- SCD-1
stearoyl-CoA desaturase-1
- SREBP-1c
sterol regulatory element-binding protein-1c
- T-CHO
total-cholesterol
- TG
triglyceride
- TGF
transforming growth factor
- TIMP-1
tissue inhibitor of metalloproteinase-1
- TNF
tumor necrosis factor
- T2DM
type 2 diabetic mellitus
- 3-KAT
3-ketoacyl-CoA thiolase
Conflict of interest
No potential conflicts of interest were disclosed.
References
- 1.Clark JM, Brancati FL, Diehl AM. The prevalence and etiology of elevated aminotransferase levels in the United States. Am J Gastroenterol. 2003;98:960–967. doi: 10.1111/j.1572-0241.2003.07486.x. [DOI] [PubMed] [Google Scholar]
- 2.Ludwig J, Viggiano TR, McGill DB, Oh BJ. Non-alcoholic steatohepatitis: Mayo Clinic experiences with a hitherto unnamed disease. Mayo Clin Proc. 1985;55:434–438. [PubMed] [Google Scholar]
- 3.Chitturi S, Abeygunasekera S, Farrell GC, et al. NASH and insulin resistance: insulin hypersecretion and specific association with the insulin resistance syndrome. Hepatology. 2002;35:373–379. doi: 10.1053/jhep.2002.30692. [DOI] [PubMed] [Google Scholar]
- 4.Fukunishi S, Sujishi T, Takeshita A, et al. Lipopolysaccharides accelerate hepatic steatosis in the development of nonalcoholic fatty liver disease in Zucker rats. J Clin Biochem Nutr. 2014;54:39–44. doi: 10.3164/jcbn.13-49. [DOI] [PMC free article] [PubMed] [Google Scholar]
- 5.Browning JD, Horton JD. Molecular mediators of hepatic steatosis and liver injury. J Clin Invest. 2004;114:147–152. doi: 10.1172/JCI22422. [DOI] [PMC free article] [PubMed] [Google Scholar]
- 6.Cheung O, Sanyal AJ. Recent advances in nonalcoholic fatty liver disease. Curr Opin Gastroenterol. 2010;26:202–208. doi: 10.1097/MOG.0b013e328337b0c4. [DOI] [PubMed] [Google Scholar]
- 7.Kim D, Wang L, Beconi M, et al. (2R)-4-oxo-4-[3-(trifluoromethyl)-5,6-dihydro[1,2,4]triazolo[4,3-a]pyrazin-7(8H)-yl]-1-(2,4,5-trifluorophenyl)butan-2-amine: a potent, orally active dipeptidyl peptidase IV inhibitor for the treatment of type 2 diabetes. J Med Chem. 2005;48:141–151. doi: 10.1021/jm0493156. [DOI] [PubMed] [Google Scholar]
- 8.Peters A. Incretin-based therapies: review of current clinical trial data. Am J Med. 2010;123 (3 Suppl):S28–S37. doi: 10.1016/j.amjmed.2009.12.007. [DOI] [PubMed] [Google Scholar]
- 9.Fujiwara K, Inoue T, Yorifuji N, et al. Combined treatment with dipeptidyl peptidase 4 (DPP4) inhibitor sitagliptin and elemental diets reduced indomethacin-induced intestinal injury in rats via the increase of mucosal glucagon-like peptide-2 concentration. J Clin Biochem Nutr. 2015;56:155–162. doi: 10.3164/jcbn.14-111. [DOI] [PMC free article] [PubMed] [Google Scholar]
- 10.Ahrén B, Landin-Olsson M, Jansson PA, Svensson M, Holmes D, Schweizer A. Inhibition of dipeptidyl peptidase-4 reduces glycemia, sustains insulin levels, and reduces glucagon levels in type 2 diabetes. J Clin Endocrinol Metab. 2004;89:2078–2084. doi: 10.1210/jc.2003-031907. [DOI] [PubMed] [Google Scholar]
- 11.Kendall DM, Cuddihy RM, Bergenstal RM. Clinical application of incretin-based therapy: therapeutic potential, patient selection and clinical use. Am J Med. 2009;122 (6 Suppl):S37–S50. doi: 10.1016/j.amjmed.2009.03.015. [DOI] [PubMed] [Google Scholar]
- 12.Neumiller JJ. Differential chemistry (structure), mechanism of action, and pharmacology of GLP-1 receptor agonists and DPP-4 inhibitors. J Am Pharm Assoc (2003) 2009;49:S16–S29. doi: 10.1331/JAPhA.2009.09078. [DOI] [PubMed] [Google Scholar]
- 13.Maiztegui B, Borelli MI, Madrid VG, et al. Sitagliptin prevents the development of metabolic and hormonal disturbances, increased β-cell apoptosis and liver steatosis induced by a fructose-rich diet in normal rats. Clin Sci (Lond) 2011;120:73–80. doi: 10.1042/CS20100372. [DOI] [PubMed] [Google Scholar]
- 14.Friedman JM, Leibel RL, Siegerl DS, Walsh J, Bahary N. Molecular mapping of the mouse ob mutation. Genomics. 1991;11:1054–1062. doi: 10.1016/0888-7543(91)90032-a. [DOI] [PubMed] [Google Scholar]
- 15.Brunt EM, Janney CG, Di Bisceglie AM, Neuschwander-Teri BA, Bacon BR. Nonalcoholic steatohepatitis: a proposal for grading and staging the histological lesions. Am J Gastroenterol. 1999;94:2467–2474. doi: 10.1111/j.1572-0241.1999.01377.x. [DOI] [PubMed] [Google Scholar]
- 16.Bartlett K, Eaton S. Mitochondrial beta-oxidation. Eur J Biochem. 2004;271:462–469. doi: 10.1046/j.1432-1033.2003.03947.x. [DOI] [PubMed] [Google Scholar]
- 17.Tomas E, Wood JA, Stanojevic V, Habener JF. Glucagon-like peptide-1 (9-36) amide metabolite inhibits weight gain and attenuates diabetes and hepatic steatosis in diet-induced obese mice. Diabetes Obes Metab. 2011;13:26–33. doi: 10.1111/j.1463-1326.2010.01316.x. [DOI] [PubMed] [Google Scholar]
- 18.Girard J, Ferré P, Foufelle F. Mechanisms by which carbohydrates regulate expression of genes for glycolytic and lipogenic enzymes. Ann Rev Nutr. 1997;17:325–352. doi: 10.1146/annurev.nutr.17.1.325. [DOI] [PubMed] [Google Scholar]
- 19.Dong X, Park S, Lin X, Copps K, Yi X, White MF. Irs1 and Irs2 signalimg is essential for hepatic glucose homeostasis and systemic growth. J Clin Invest. 2006;116:101–114. doi: 10.1172/JCI25735. [DOI] [PMC free article] [PubMed] [Google Scholar]
- 20.Foufelle F, Ferré P. New perspectives in the regulation of hepatic glycolytic and lipogenic genes by insulin and glucose: a role for the transcription factor sterol regulatory element binding protein-1c. Biochem J. 2002;366 (Pt 2):377–391. doi: 10.1042/BJ20020430. [DOI] [PMC free article] [PubMed] [Google Scholar]
- 21.Dentin R, Girard J, Postic C. Carbohydrate responsive element binding protein (ChREBP) and sterol regulatory element binding protein-1c (SREBP-1c): two key regulators of glucose metabolism and lipid synthesis in liver. Biochimie. 2005;87:81–86. doi: 10.1016/j.biochi.2004.11.008. [DOI] [PubMed] [Google Scholar]
- 22.Horton JD, Shah NA, Warrington JA, et al. Combined analysis of oligonucleotide microarray data from transgenic and knockout mice identifies direct SREBP target genes. Proc Natl Acad Sci U S A. 2003;100:12027–12032. doi: 10.1073/pnas.1534923100. [DOI] [PMC free article] [PubMed] [Google Scholar]
- 23.Cohen P, Friedman M. Leptin and the control of metabolism: role for stearoyl-CoA desaturase-1 (SCD-1) J Nutr. 2004;134:2455S–2463S. doi: 10.1093/jn/134.9.2455S. [DOI] [PubMed] [Google Scholar]
- 24.Srere PA. The citrate cleavage enzyme. I. Distribution and purification. J Biol Chem. 1959;234:2544–2547. [PubMed] [Google Scholar]
- 25.Abu-Elheiga L, Jayakumar A, Baldini A, Chirala SS, Wakil SJ. Human acetyl-CoA carboxylase: characterization, molecular cloning, and evidence for two isoforms. Proc Natl Acad Sci U S A. 1995;92:4011–4015. doi: 10.1073/pnas.92.9.4011. [DOI] [PMC free article] [PubMed] [Google Scholar]
- 26.Lim JS, Mieyus-Snyder M, Valente A, Schwarz JM, Lusting RH. The role of fructose in the pathogenesis of NAFLD and the metabolic syndrome. Nat Rev Gastroenterol Hepatol. 2010;7:251–264. doi: 10.1038/nrgastro.2010.41. [DOI] [PubMed] [Google Scholar]
- 27.Mao J, DeMayo FJ, Li H, et al. Liver-specific deletion of acetyl-CoA carboxylase 1 reduces hepatic triglyceride accumulation without glucose homeostasis. Proc Natl Acad Sci U S A. 2006;30:8552–8557. doi: 10.1073/pnas.0603115103. [DOI] [PMC free article] [PubMed] [Google Scholar]


