

Abstract
CDH13 gene variants with lower adiponectin levels are paradoxically associated with a more favorable metabolic profile. We investigated the statistical association between CDH13 locus variants and adiponectin levels by examining 12 circulating inflammation marker levels and adiposity status in 530 Han Chinese people in Taiwan. After adjustments for clinical covariates, adiponectin levels were positively associated with soluble vascular cell adhesion molecule-1 (sVCAM1) levels and negatively associated with adiposity status and levels of C-reactive protein (CRP), soluble E-selectin (sE-selectin), and soluble intercellular adhesion molecule-1 (sICAM1). In addition, minor alleles of the CDH13 rs12051272 polymorphism were found to have lower adiponectin levels and higher CRP, sE-selectin, sICAM1, and sVCAM1 levels as well as higher body mass indices and waist circumferences in participants (all P < 0.05). In a subgroup analysis stratified by sex, significant associations between CDH13 genotypes and sE-selectin levels occurred only in men (P = 3.9 × 10⁻⁴ and interaction P = 0.005). CDH13 locus variants and adiponectin levels are associated with circulating levels of cellular adhesion molecules and adiposity status in a differential manner that interacts with sex. These results provide further evidence for the crucial role of adiponectin levels and CDH13 gene variants in immune-mediated and inflammatory diseases.
1. Introduction
Adiponectin, a multimeric protein and one of the most abundant gene products expressed in adipose tissue [1], is well known to play a critical role in metabolic regulation, affecting obesity, insulin sensitivity, and atherosclerosis [2]. Several studies have shown that adiponectin is involved in numerous biological effects, including antidiabetic, antioxidant, and antiatherosclerotic actions [3]. Circulating levels of adiponectin are reduced in patients with obesity and associated comorbidities [4], and inflammation is crucial in downregulating adiponectin production [5]. By contrast, elevated systemic and local levels of adiponectin are present in patients with immune-mediated and inflammatory diseases [6]. Whereas previous studies have demonstrated differential associations between circulating adiponectin and inflammatory marker levels [7–12], conflicting data have been reported regarding the proinflammatory and anti-inflammatory effects of adiponectin in in vitro and in vivo studies [13]. These results suggested a multifaceted influence of adiponectin in inflammation, occurring through various mechanisms involved in modifying circulating adiponectin levels and in regulating downstream adiponectin-related signal pathways [13].
T-cadherin, of the cadherin superfamily of the transmembrane proteins that mediate calcium-dependent intercellular adhesion, is the receptor for hexameric and high-molecular weight adiponectin expressed in the vasculature [14] and cardiac myocytes [15]. The CDH13 gene, which encodes T-cadherin, is localized at chromosome 16q23.3, spans 1.2 Mb, and contains 14 exons. Binding a low-density lipoprotein or adiponectin to T-cadherin can activate an NFκB signaling pathway, which plays a central role in inflammation and links obesity and vascular disease [16]. Genome-wide association studies (GWAS) have shown associations between CDH13 genotypes and haplotypes with adiponectin levels [17–19]. A meta-analysis reported the CDH13 gene region to be the most crucial locus associated with adiponectin levels [20]. Paradoxically, genotypes with lower adiponectin levels have more favorable metabolic phenotypes. After mediation analysis, our data showed the CDH13 rs12051272 polymorphism to be the most significant CDH13 variant associated with metabolic phenotypes and metabolic syndrome in Han Chinese people in Taiwan [21]. Although T-cadherin has been associated with immune-mediated diseases [22], the role of CDH13 variants in inflammatory marker levels has not been previously investigated. The current study elucidates the role of CDH13 genotypes and adiponectin levels in inflammatory marker levels, which affect various stages of atherosclerosis progression. The interactive effects of sex and obesity on the genotype-phenotype associations were also analyzed.
2. Subjects and Methods
2.1. Study Population
This study was approved by the institutional review board of Taipei Tzu Chi Hospital, Buddhist Tzu Chi Medical Foundation (IRB number: 02-XD56-120). The study population was previously reported [23]. The exclusion criteria included cancer, current renal or liver disease, and a history of myocardial infarction, stroke, or transient ischemic attacks. In brief, 617 Han Chinese subjects were recruited during routine health examinations between October 2003 and September 2005 at Chang Gung Memorial Hospital. All participants provided written, informed consent. Participants answered a questionnaire on their medical history and lifestyle characteristics and underwent a physical examination that involved measurements of height, weight, waist circumference, and blood pressure (BP) in a sitting position after 15 min of rest. Fasting blood samples were obtained from each participant. Obesity was defined as body mass index (BMI) ≥ 25 kg/m2 according to the Asian criteria [24]. Current smokers were defined as those who smoked cigarettes regularly at the time of survey. Participants aged < 18 years or with a history of regular use of medications for diabetes mellitus, hypertension, and/or lipid-lowering drugs were excluded from the analysis. Participants with hypertension, defined as a systolic BP ≥ 140 mm Hg, a diastolic BP ≥ 90 mm Hg, or both, and not taking antihypertensive drugs and those with diabetes mellitus, defined as blood sugar levels before a meal of ≥7.0 mmol/L, and not taking medications for diabetes mellitus were included for analysis. In all, 530 study participants were enrolled for analysis (mean ± SD): 270 men, age = 43.9 ± 9.3 years, and 260 women, age = 45.9 ± 9.3 years. Table 1 summarizes the clinical and biometric features of the study group.
Table 1.
Baseline characteristics of the health of study participants.
| Total | Men | Women | P value | |
|---|---|---|---|---|
| Number | 530 | 270 | 260 | |
| Age (years) | 44.9 ± 9.4 | 43.9 ± 9.3 | 45.9 ± 9.3 | 0.013 |
| Body mass index (kg/m2) | 24.2 ± 3.5 | 24.8 ± 3.2 | 23.5 ± 3.7 | 2.2 × 10⁻⁵ |
| Waist circumference (cm) | 84.6 ± 9.7 | 87.4 ± 7.8 | 81.61 ± 10.5 | 1.6 × 10⁻¹² |
| Hypertension | 9.6% | 8.9% | 10.4% | 0.331 |
| Diabetes mellitus | 2.5% | 2.6% | 2.3% | 0.528 |
| Obesity | 36.6% | 44.1% | 28.8% | 1.9 × 10⁻⁴ |
| Adiponectin (mg/L) | 7.25 ± 4.90 | 5.45 ± 3.44 | 9.13 ± 5.45 | 7.8 × 10⁻²¹ |
| CRP (mg/L) | 1.04 ± 1.35 | 1.09 ± 1.40 | 0.99 ± 1.31 | 0.060 |
| Fibrinogen (mg/dL) | 262.6 ± 68.9 | 260.3 ± 70.9 | 265.0 ± 66.9 | 0.432 |
| sE-selectin (ng/mL) | 52.7 ± 25.6 | 60.0 ± 26.8 | 45.0 ± 21.8 | 4.1 × 10⁻¹⁴ |
| sP-selectin (ng/mL) | 136.9 ± 115.0 | 149.8 ± 128.9 | 123.6 ± 97.0 | 0.004 |
| sVCAM1 (ng/mL) | 488.1 ± 132.7 | 491.4 ± 153.0 | 484.86 ± 108.0 | 0.724 |
| sICAM1 (ng/mL) | 241.0 ± 112.8 | 245.6 ± 109.7 | 236.1 ± 116.0 | 0.215 |
| sTNFR2 (pg/mL) | 3240.4 ± 922.4 | 3308.8 ± 969.1 | 3169.5 ± 867.7 | 0.082 |
| MCP1 (pg/mL) | 73.5 ± 60.6 | 80.0 ± 70.7 | 66.8 ± 47.1 | 0.011 |
| IL6 (pg/L) | 4.1 ± 7.6 | 4.4 ± 9.0 | 3.9 ± 5.8 | 0.569 |
| MMP1 (pg/mL) | 483.8 ± 1201.4 | 351.9 ± 585.6 | 620.2 ± 1597.2 | 0.850 |
| MMP2 (ng/mL) | 126.0 ± 40.9 | 122.4 ± 41.8 | 129.8 ± 39.6 | 0.038 |
| MMP9 (ng/mL) | 143.7 ± 112.5 | 156.7 ± 114.4 | 130.3 ± 109.2 | 0.008 |
| SAA (mg/L) | 5.90 ± 15.42 | 6.68 ± 19.64 | 5.10 ± 9.32 | 0.374 |
CRP: C-reactive protein; sE-selectin: soluble E-selectin; sP-selectin: soluble P-selectin; sVCAM1: soluble vascular cell adhesion molecule-1; sICAM1: soluble intercellular adhesion molecule-1; TNFR2: tumor necrosis factor-alpha receptor 2; MCP1: monocyte chemotactic protein-1; IL6: interleukin-6; MMP1: matrix metalloproteinase-1; MMP2: matrix metalloproteinase-2; MMP9: matrix metalloproteinase-9; SAA: serum amyloid A. Continuous variables are presented as mean ± SD.
CRP: patients with CRP levels >10 mg/L excluded.
2.2. Genomic DNA Extraction and Genotyping
Genomic DNA was extracted as reported previously [25]. The CDH13 rs12051272 polymorphism that was previously reported to be strongly associated with adiponectin levels and metabolic syndrome [21] was chosen in this study. Genotyping was performed using TaqMan SNP Genotyping Assays from Applied Biosystems (ABI, Foster City, CA, USA).
2.3. Laboratory Examinations and Assays
Before starting the study, all participants underwent an initial screening assessment that included a medical history and novel risk factors. A total of 15 mL of venous blood was collected in the morning after an overnight (8–12 h) fast. Venous blood samples including serum and plasma were collected from an antecubital vein and centrifuged at 3000 ×g for 15 min at 4°C. Immediately thereafter, serum and plasma samples were frozen and stored at −80°C prior to analysis. Plasma fibrinogen levels were measured in a central laboratory as previously reported [23]. Most markers, including serum adiponectin, C-reactive protein (CRP), serum amyloid A (SAA), soluble intercellular adhesion molecule-1 (sICAM1), soluble vascular cell adhesion molecule-1 (sVCAM1), soluble E-selectin (sE-selectin), matrix metalloproteinase-9 (MMP9), and plasma monocyte chemotactic protein-1 (MCP1), were measured using an enzyme-linked immunosorbent assay (ELISA) developed in-house. Measurement of sICAM1 was performed using the R&D System ICAM1 assay monoclonal antibody. All in-house kits exhibited strong correlation compared with commercially available ELISA kits [23]. Circulating serum matrix metalloproteinase-2 (MMP2) and plasma matrix metalloproteinase-1 (MMP1), soluble P-selectin (sP-selectin), soluble tumor necrosis factor receptor 2 (sTNFRII), and interleukin-6 (IL6) were measured using commercially available ELISA kits from R&D (Minneapolis, MN, USA).
2.4. Statistical Analysis
The chi-square test was used for testing to compare categorical variables of diabetes mellitus and smoking. The clinical characteristics that were continuous variables are expressed as means ± SDs and were tested using a two-sided t-test or analysis of variance (ANOVA). Pearson correlation coefficients (r) were calculated to determine the association between adiponectin levels and clinical and biochemical factors with the adjustment of age and sex. Furthermore, a general linear model was applied to capture the major effect of each polymorphism on clinical and biochemical variables, with BMI, age, gender, and smoking status as confounding covariates. We also used dominant models for numeric association test after recoding our SNPs from categorical variables to continuous variables, such as 0, 1 of a particular allele. A value of P < 0.05 using two-sided tests was considered statistically significant. All the above calculations were performed with standard statistical SPSS 12 software (SPSS, Chicago, IL, USA). All of the biomarker levels, besides MMP9, were logarithmically transformed before statistical analysis to adhere to a normality assumption. In addition, stepwise linear regression analysis was used to analyze independent predictors of adiponectin levels. We further analyzed the influence of interaction between CDH13 rs12051272 genotypes with obesity and gender on inflammatory marker levels.
3. Results
3.1. Associations between Circulating Adiponectin and Inflammatory Marker Levels
Table 1 summarizes the demographic features, clinical profiles, and biomarker levels of the study participants. The associations between adiponectin and inflammatory marker levels are shown in Table 2. Elevated adiponectin levels were found with increasing age. After adjustments for clinical covariates, a significant positive correlation was observed between adiponectin and sVCAM1 levels, and significant negative correlations were observed between adiponectin levels and circulating levels of various inflammatory biomarkers, including CRP, sE-selectin, and sICAM1, and with adiposity status, including body mass index (BMI) and waist circumference (Table 2).
Table 2.
Associations between adiponectin levels and adiposity status and inflammatory marker levels in Han Chinese patients in Taiwan.
| Clinical and biochemical parameters | Unadjusted |
Adjusted for age, sex, BMI, and smoking status | |||
|---|---|---|---|---|---|
| r | P value | r | P value | ||
| Anthropology | Age (years) | 0.164 | 1.50 × 10⁻⁴ | ||
| Body mass index (kg/m2) | −0.356 | 2.97 × 10⁻¹⁷ | −0.321 | 4.18 × 10⁻¹⁴∗ | |
| Waist circumference (cm) | −0.365 | 3.84 × 10⁻¹⁸ | −0.297 | 3.25 × 10⁻¹²∗ | |
|
| |||||
| Inflammation markers | CRP (mg/L) | −0.272 | 2.87 × 10⁻¹⁰ | −0.186 | 2.22 × 10⁻⁵ |
| Fibrinogen (mg/dL) | −0.057 | 0.189 | −0.055 | 0.210 | |
| sE-selectin (ng/mL) | −0.318 | 9.77 × 10⁻¹⁴ | −0.150 | 0.001 | |
| sP-selectin (ng/mL) | −0.119 | 0.006 | −0.073 | 0.096 | |
| sVCAM1 (ng/mL) | 0.163 | 1.72 × 10⁻⁴ | 0.142 | 0.001 | |
| sICAM1 (ng/mL) | −0.134 | 0.002 | −0.114 | 0.009 | |
| sTNFR2 (pg/mL) | −0.045 | 0.298 | −0.004 | 0.923 | |
| MCP1 (pg/mL) | −0.050 | 0.252 | −0.003 | 0.948 | |
| IL6 (pg/L) | −0.065 | 0.143 | −0.033 | 0.463 | |
| MMP1 (pg/mL) | −0.007 | 0.878 | −0.016 | 0.719 | |
| MMP2 (ng/mL) | 0.119 | 0.006 | 0.062 | 0.159 | |
| MMP9 (ng/mL) | −0.113 | 0.010 | −0.043 | 0.330 | |
| SAA (mg/L) | −0.009 | 0.839 | 0.041 | 0.352 | |
Abbreviations as in Table 1.
CRP: patients with CRP levels >10 mg/L excluded.
∗Adjusted for age, sex, and smoking status only.
3.2. Multivariate Analysis
Stepwise linear regression analysis in a model including age, sex, BMI, waist circumference, smoking status, and various inflammatory marker levels revealed that being female (P = 7.9 × 10⁻¹³), sVCAM1 (P = 7.49 × 10⁻⁷), and age (per year; P = 0.001) were positively associated with adiponectin levels, whereas BMI (P = 1.71 × 10⁻⁶) and circulating levels of sE-selectin (P = 0.003), sICAM1 (P = 0.003), and CRP (P = 0.002) were negatively associated with lower adiponectin levels (Table 3). When CDH13 rs12051272 genotypes were further enrolled in multivariate analysis, all associations remained significant (data not shown).
Table 3.
Adiponectin levels: stepwise linear regression analysis.
| Variable | R 2 a | Beta | P value |
|---|---|---|---|
| Sex | 0.152 | 0.163 | 7.9 × 10⁻¹³ |
| Body mass index (kg/m2) | 0.232 | −0.016 | 1.71 × 10⁻⁶ |
| sVCAM1 (ng/mL) | 0.253 | 0.566 | 7.49 × 10⁻⁷ |
| sE-selectin (ng/mL) | 0.282 | −0.180 | 0.003 |
| sICAM1 (ng/mL) | 0.295 | −0.189 | 0.003 |
| Age (per year) | 0.307 | 0.004 | 0.001 |
| CRP (mg/L) | 0.319 | −0.066 | 0.002 |
aCumulative R 2. Multiple linear regression, adjusted for age, gender, and smoking status.
3.3. Associations between CDH13 Gene Variant rs12051272 and Inflammatory Marker Levels
Table 4 shows the associations of CDH13 rs12051272 genotypes with adiponectin, inflammatory marker levels, and adiposity status. The T-allele of rs5491 was demonstrated to alter a critical binding site of ICAM1, interfering with the monoclonal antibody used in the R&D System ICAM1 assay for binding the protein [26]. To study the associations of sICAM1 levels, we enrolled only subjects with the ICAM1 rs5491 AA genotype for analysis. After adjustments for age and sex, the CDH13 genotypes were found to be positively associated with CRP, sE-selectin, sICAM1, and sVCAM1 levels and with BMI and waist circumference. With an additional adjustment for BMI, the association remained in circulating levels of sE-selectin, sICAM1, and sVCAM1 (P = 0.039, P = 0.037, and P = 0.010, resp.), whereas a trend of higher sP-selectin level (P = 0.064) was also noted. After further adjustment for adiponectin levels, the association between CDH13 rs12051272 genotypes and sVCAM1 levels became more significant (P = 0.001).
Table 4.
Association between CDH13 rs12051272 genotypes and adiposity status and adiponectin levels and inflammatory marker levels.
| Genotype | GG (N = 235) | GT (N = 229) | TT (N = 57) | P1 | P2 | P3 | Β (95% CI)∗ | P1∗ | P2∗ | P3∗ | |
|---|---|---|---|---|---|---|---|---|---|---|---|
| Anthropology | Age (years) | 44.6 ± 8.2 | 45.3 ± 10.5 | 44.8 ± 9.3 | |||||||
| Body mass index (kg/m2) | 23.7 ± 3.0 | 24.4 ± 3.8 | 25.0 ± 3.8 | 0.012 | 1.07 (0.12–2.02) | 0.027 | |||||
| Waist circumference (cm) | 83.5 ± 8.8 | 84.8 ± 10.0 | 88.3 ± 11.0 | 1.31 × 10⁻⁴ | 0.004 | 0.011 | 4.68 (2.17–7.19) | 2.71 × 10⁻⁴ | 0.003 | 0.008 | |
| Adiponectin (mg/L) | 8.58 ± 5.44 | 6.40 ± 3.98 | 5.15 ± 4.38 | 2.7 × 10⁻¹⁰ | 7.45 × 10⁻⁹ | −0.20 (−0.27 to −0.13) | 2.57 × 10⁻⁸ | 3.52 × 10⁻⁷ | |||
|
| |||||||||||
| Inflammation marker |
CRP (mg/L) | 1.10 ± 1.51 | 0.88 ± 1.06 | 1.44 ± 1.60 | 0.018 | 0.163 | 0.702 | 0.18 (0.04–0.31) | 0.010 | 0.084 | 0.395 |
| Fibrinogen (mg/dL) | 261.7 ± 71.6 | 261.4 ± 62.8 | 273.2 ± 79.7 | 0.241 | 0.463 | 0.646 | 11.59 (−7.19–30.38) | 0.226 | 0.412 | 0.563 | |
| sE-selectin (ng/mL) | 52.8 ± 21.7 | 49.76 ± 20.70 | 65.08 ± 47.16 | 0.018 | 0.083 | 0.327 | 0.07 (0.02–0.12) | 0.009 | 0.039 | 0.160 | |
| sP-selectin (ng/mL) | 137.6 ± 104.8 | 132.4 ± 119.7 | 165.0 ± 137.7 | 0.093 | 0.116 | 0.230 | 0.08 (−0.0004–0.16) | 0.051 | 0.064 | 0.126 | |
| sVCAM1 (ng/mL) | 485.9 ± 107.4 | 479.2 ± 105.5 | 537.6 ± 263.7 | 0.027 | 0.014 | 0.001 | 0.03 (0.01–0.06) | 0.019 | 0.010 | 0.001 | |
| sICAM1 (ng/mL) | 236.8 ± 95.2 | 235.3 ± 89.8 | 286.1 ± 16.00 | 0.024 | 0.058 | 0.171 | 0.06 (0.01–0.11) | 0.016 | 0.037 | 0.103 | |
| sTNFR2 (pg/mL) | 3222.1 ± 900.7 | 3230.7 ± 939.5 | 3411.4 ± 964.8 | 0.125 | 0.194 | 0.193 | 0.03 (−0.01–0.06) | 0.121 | 0.180 | 0.180 | |
| MCP1 (pg/mL) | 70.8 ± 61.6 | 79.1 ± 65.1 | 65.0 ± 33.2 | 0.914 | 0.845 | 0.844 | −0.02 (−0.10–0.06) | 0.618 | 0.564 | 0.558 | |
| IL6 (pg/L) | 4.7 ± 10.0 | 3.4 ± 4.7 | 4.8 ± 5.9 | 0.065 | 0.129 | 0.165 | 0.12 (0.002–0.0.24) | 0.046 | 0.221 | 0.107 | |
| MMP1 (pg/mL) | 518.1 ± 1341.1 | 472.0 ± 1174.5 | 446.2 ± 675.8 | 0.221 | 0.232 | 0.240 | 0.09 (−0.04–0.22) | 0.186 | 0.197 | 0.204 | |
| MMP2 (ng/mL) | 124.4 ± 35.4 | 127.6 ± 44.7 | 123.8 ± 46.0 | 0.749 | 0.863 | 0.877 | −0.02 (−0.05–0.02) | 0.356 | 0.437 | 0.748 | |
| MMP9 (ng/mL) | 145.9 ± 122.3 | 139.2 ± 97.6 | 156.5 ± 131.0 | 0.359 | 0.504 | 0.685 | 16.37 (−15.44–48.19) | 0.313 | 0.429 | 0.574 | |
| SAA (mg/L) | 6.32 ± 13.92 | 5.35 ± 17.77 | 6.35 ± 11.80 | 0.618 | 0.865 | 0.597 | 0.05 (−0.09–0.19) | 0.462 | 0.653 | 0.439 | |
Abbreviations as in Table 1.
N = number; CRP: excluded subjects with CRP levels >10 mg/L; P1 value adjusted for age and sex; P2 value adjusted for age, sex, BMI, and smoking status; P3 value further adjusted for adiponectin levels; sICAM1: only subjects with ICAM1 rs5491 AA genotype selected; ∗data was analyzed in recessive model (GG + GTversus TT).
3.4. Subgroup and Interaction Analyses by Gender
As presented in Figure 1, after adjustments for clinical covariates, subgroup and interaction analyses revealed an association of CDH13 rs12051272 genotypes with sE-selectin levels only in men (P = 3.9 × 10⁻⁴, interaction P = 0.005). There was no evidence of interaction by obesity or sex in the association between rs12051272 genotypes and other inflammatory biomarker levels.
Figure 1.
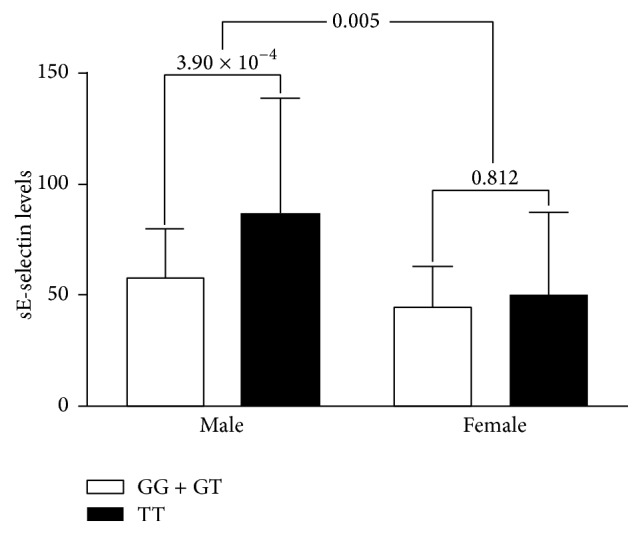
Comparison of levels of soluble E-selectin according to CDH13 rs12051272 genotypes in the recessive model between Han Chinese men and women in Taiwan. After adjustments for clinical covariates, minor alleles of CDH13 rs12051272 genotypes were found to be associated with higher sE-selectin levels, predominantly in men (P = 3.90 × 10⁻⁴). Interaction analysis revealed an interaction of sex with the CDH13 rs12051272 genotypes (interaction P = 0.005).
4. Discussion
This study analyzed the association of CDH13 locus variant rs12051272 and adiponectin levels with inflammation marker levels and adiposity status in Han Chinese subjects in Taiwan. Our data revealed that circulating cellular adhesion molecule levels were associated with adiponectin levels and CDH13 gene variants in a differential manner. Subgroup analysis demonstrated different genetic backgrounds by gender in the association between CDH13 variants and sE-selectin levels. These results provide further evidence that T-cadherin is the target adiponectin receptor for inflammation and that adiponectin levels and CDH13 gene variants are crucial in immune-mediated and inflammatory diseases.
4.1. Association between Circulating Adiponectin and Inflammatory Marker Levels
Ouchi et al. first demonstrated that physiological concentrations of adiponectin exert significant inhibitory effects on TNFα-induced monocyte adhesion and adhesion molecule expression in a dose-dependent manner. Adiponectin specifically suppressed TNFα-induced IκB-NFκB activation through a cAMP-dependent pathway in human arterial endothelial cells [8]. Similar to our results, consistent negative correlations have been reported between adiponectin levels and circulating CRP and sE-selectin levels in healthy and diseased populations [9, 12, 27–30]. Our data indicate a negative association between adiponectin levels and sICAM1 levels that had not been previously reported. Another interesting finding consistent with the literature is that sVCAM1 is the only inflammatory marker level positively associated with adiponectin levels in our study and in published articles [10, 11]. Although the exact mechanism of this association has not been fully elucidated, Vaverkova et al. hypothesized that adiponectin may be involved in the shedding of the ectodomain of VCAM1 from the endothelial surface, thereby increasing the serum level of VCAM1 [10].
4.2. Association of CDH13 Variants with Inflammatory Marker Levels
This study is the first to demonstrate that CDH13 genotypes are associated with inflammatory marker levels. The association occurred predominantly in circulating levels of cellular adhesion molecules, which may be dependent on or independent of adiponectin levels. Three adiponectin binding receptors have been cloned: adiponectin R1, adiponectin R2, and T-cadherin. Previous studies have suggested that nearly all of the metabolic effects of adiponectin are conferred by the adiponectin R1 and R2 receptors [16]. By contrast, the binding of adiponectin to T-cadherin can activate the NFκB signaling pathway, which plays an essential role in inflammation and serves as a link between obesity and vascular disease [8]. T-cadherin was discovered to be a unique “truncated” cadherin that is associated with the plasma membrane but lacks cytoplasmic sequences and is not a classical receptor, which requires both ligand binding and intracellular signal capabilities [31]. T-cadherin sequesters adiponectin to the endothelium and heart and serves as an adiponectin repository; thus, in mice with T-cadherin deficiency, this adiponectin is accumulated in the circulation with elevated adiponectin levels [14, 15, 22]. However, in T-cadherin-deficient mice, some of adiponectin actions are not mediated because of lack of T-cadherin. Danzel et al. reported that adiponectin was unable to associate with cardiac tissue in T-cadherin-deficient mice, while physical association of adiponectin with T-cadherin was necessary for adiponectin-dependent AMP-activated protein kinase phosphorylation and adiponectin's physiological activity in the heart [15]. These data are consistent with a model in which T-cadherin serves the adiponectin binding, while yet-unknown transmembrane proteins, possibly including adiponectin R1 or R2, are required for transmitting the binding signal to intracellular signal pathways. Further, external application of adiponectin upregulates posttranscriptional expression of T-cadherin to enable docking of adiponectin to cardiomyocytes and endothelial cells and regulate tissue T-cadherin levels through a positive feedback loop that operates by suppressing phospholipase-mediated T-cadherin release from the cell surface [15, 32]. Thus, T-cadherin not only regulates circulating and tissue-bound adiponectin levels but also competes with the adiponectin R1 and R2 receptors for adiponectin binding and interferes with the coupling of both receptors to their downstream intracellular targets [32, 33]. The intracellular signaling events following the activation of adiponectin R1 and adiponectin R2 involve binding to the adaptor protein APPL1 (i.e., the adaptor protein containing pleckstrin homology domain) and then activating AMP-activated protein kinase, which may block the NFκB pathways and downstream inflammation events [34]. Bag and Anbarasu analyzed functional gene interactions of the adiponectin gene and revealed that, in contrast to adiponectin and adiponectin R2 (which are involved mostly in glucose and lipid metabolic processes), the CDH13 gene participates in the cell adhesion process with adiponectin and adiponectin R2 [35]. The above findings of complex interaction between adiponectin and T-cadherin may provide the base of our results showing that CDH13 variants with lower T-cadherin expression may increase the adiponectin level and decrease cellular adhesive molecule levels. These findings further indicate that adiponectin acts through its receptors as an endogenous modulator of endothelial cell function via metabolic and inflammatory effects, which may be involved in endothelial dysfunction in earlier atherosclerotic processes [36].
4.3. Adiponectin Levels, CDH13 Variants, and Adiposity Status
Obesity downregulates adiponectin levels through metabolic derangement and the dysregulation of inflammation [4]. Several studies have shown the association of CDH13 variants with obesity or the syndrome of obesity [19, 37–39]. In a GWAS, Lee et al. identified the influence of gene-gene interaction between variants in CDH13 and SLC10A7 genes on the association with obesity [37]. Our data further demonstrated the association of the CDH13 variant with BMI and waist circumference in Han Chinese subjects in Taiwan. The cause-effect relationship is currently unclear, and further study is required to determine its future clinical implications.
4.4. Effect of Sex on the Association between CDH13 Variants and sE-Selectin Levels
The interplay between genetic and environmental factors is critical in the phenotype development of complex traits. We found that the association between CDH13 genotypes and sE-selectin levels was predominant in men. Previous studies have shown gene-gene (epistatic effect) and gene-gender interactions between CDH13 genotypes and metabolic syndrome and between CDH13 genotypes and obesity, respectively [37, 40]. Estradiol and progesterone have been shown to be involved in the transcriptional and posttranscriptional regulation of T-cadherin in human osteosarcoma cells [41]. The role of sex hormones in the phenotypic effect of CDH13 polymorphisms required further research.
Limitations. The main limitation of our study was its modest sample size, which was not analyzed in any functional manner and showed only an arguable relationship with the phenotypes. The replication of our results using a second cohort, particularly by one with a larger sample size and a different ethnic population, would strengthen the validity of our analysis. In addition, the cross-sectional nature of the present study limits our ability to infer a causal relation between CDH13 variants, inflammatory marker levels, and various immune-mediated and inflammatory disorders.
5. Conclusion
Our data suggested multiple mechanisms involved in the association between adiponectin and inflammatory marker levels, in which T-cadherin plays a crucial role in circulating adhesion molecule levels. CDH13 genotypes with low adiponectin levels were found to be associated with a more favorable metabolic profile but a higher risk profile regarding inflammatory marker levels. These results, when combined with previous studies, may provide a fuller explanation of the diverse effects of adiponectin.
Acknowledgments
This study was supported by grants from the National Science Council, Taiwan (NSC101-2314-B-303-023-MY3), Taipei Tzu Chi Hospital, Buddhist Tzu Chi Medical Foundation (TCRD-TPE-NSC-102-01, TCRD-TPE-103-RT-2), Tzu Chi University (TCIRP102001-02Y1, TCIRP99001-04Y1) to Y.-L. Ko, and Taipei Tzu Chi Hospital, Buddhist Tzu Chi Medical Foundation (TCRD-TPE-102-3, TCRD-TPE-103-22, TCRD-TPE-104-18), to M.-S. Teng. The authors greatly appreciate the technical support of Taipei Tzu Chi Hospital and Buddhist Tzu Chi Medical Foundation Core Laboratory.
Abbreviations
- GWAS:
Genome-wide association studies
- BP:
Blood pressure
- BMI:
Body mass index
- ELISA:
Enzyme-linked immunosorbent assay
- CRP:
C-reactive protein
- SAA:
Serum amyloid A
- sICAM1:
Soluble intercellular adhesion molecule-1
- sVCAM1:
Soluble vascular cell adhesion molecule-1
- sE-selectin:
Soluble E-selectin
- MMP9:
Matrix metalloproteinase-9
- MCP1:
Monocyte chemotactic protein-1
- IL6:
Interleukin-6
- MMP2:
Matrix metalloproteinase-2
- MMP1:
Matrix metalloproteinase-1
- sP-selectin:
Soluble P-selectin
- sTNFRII:
Soluble tumor necrosis factor receptor 2.
Conflict of Interests
The authors declare that there is no conflict of interests regarding the publication of this paper.
References
- 1.Maeda K., Okubo K., Shimomura I., Funahashi T., Matsuzawa Y., Matsubara K. cDNA cloning and expression of a novel adipose specific collagen-like factor, apM1 (AdiPose Most abundant Gene transcript 1) Biochemical and Biophysical Research Communications. 1996;221(2):286–289. doi: 10.1006/bbrc.1996.0587. [DOI] [PubMed] [Google Scholar]
- 2.Yamauchi T., Kamon J., Waki H., et al. The fat-derived hormone adiponectin reverses insulin resistance associated with both lipoatrophy and obesity. Nature Medicine. 2001;7(8):941–946. doi: 10.1038/90984. [DOI] [PubMed] [Google Scholar]
- 3.Matsuzawa Y., Funahashi T., Kihara S., Shimomura I. Adiponectin and metabolic syndrome. Arteriosclerosis, Thrombosis, and Vascular Biology. 2004;24(1):29–33. doi: 10.1161/01.atv.0000099786.99623.ef. [DOI] [PubMed] [Google Scholar]
- 4.Yoo H. J., Choi K. M. Adipokines as a novel link between obesity and atherosclerosis. World Journal of Diabetes. 2014;5(3):357–363. doi: 10.4239/wjd.v5.i3.357. [DOI] [PMC free article] [PubMed] [Google Scholar]
- 5.Hino K., Nagata H. Vitamins & Hormones. chapter 5. Vol. 90. Elsevier; 2012. Screening for adiponectin secretion regulators; pp. 125–141. [DOI] [PubMed] [Google Scholar]
- 6.Kwon H., Pessin J. E. Adipokines mediate inflammation and insulin resistance. Frontiers in Endocrinology. 2013;4, article 71 doi: 10.3389/fendo.2013.00071. [DOI] [PMC free article] [PubMed] [Google Scholar]
- 7.Ouchi N., Kihara S., Arita Y., et al. Novel modulator for endothelial adhesion molecules: adipocyte-derived plasma protein adiponectin. Circulation. 1999;100(25):2473–2476. doi: 10.1161/01.cir.100.25.2473. [DOI] [PubMed] [Google Scholar]
- 8.Ouchi N., Kihara S., Arita Y., et al. Adiponectin, an adipocyte-derived plasma protein, inhibits endothelial NF-κB signaling through a cAMP-dependent pathway. Circulation. 2000;102(11):1296–1301. doi: 10.1161/01.cir.102.11.1296. [DOI] [PubMed] [Google Scholar]
- 9.Ouchi N., Kihara S., Funahashi T., et al. Reciprocal association of C-reactive protein with adiponectin in blood stream and adipose tissue. Circulation. 2003;107(5):671–674. doi: 10.1161/01.CIR.0000055188.83694.B3. [DOI] [PubMed] [Google Scholar]
- 10.Vaverkova H., Karasek D., Novotny D., et al. Positive association of adiponectin with soluble vascular cell adhesion molecule sVCAM-1 levels in patients with vascular disease or dyslipidemia. Atherosclerosis. 2008;197(2):725–731. doi: 10.1016/j.atherosclerosis.2007.07.005. [DOI] [PubMed] [Google Scholar]
- 11.Vaverkova H., Karasek D., Novotny D., et al. Positive association of adiponectin with soluble thrombomodulin, von Willebrand factor and soluble VCAM-1 in dyslipidemic subjects. Clinical Biochemistry. 2013;46(9):766–771. doi: 10.1016/j.clinbiochem.2013.02.014. [DOI] [PubMed] [Google Scholar]
- 12.El-Mesallamy H. O., Hamdy N. M., Salman T. M., Ibrahim S. M. Adiponectin and sE-selectin concentrations in relation to inflammation in obese type 2 diabetic patients with coronary heart disease. Angiology. 2012;63(2):96–102. doi: 10.1177/0003319711408587. [DOI] [PubMed] [Google Scholar]
- 13.Fantuzzi G. Adiponectin in inflammatory and immune-mediated diseases. Cytokine. 2013;64(1):1–10. doi: 10.1016/j.cyto.2013.06.317. [DOI] [PMC free article] [PubMed] [Google Scholar]
- 14.Hebbard L. W., Garlatti M., Young L. J. T., Cardiff R. D., Oshima R. G., Ranscht B. T-cadherin supports angiogenesis and adiponectin association with the vasculature in a mouse mammary tumor model. Cancer Research. 2008;68(5):1407–1416. doi: 10.1158/0008-5472.can-07-2953. [DOI] [PMC free article] [PubMed] [Google Scholar]
- 15.Denzel M. S., Scimia M.-C., Zumstein P. M., Walsh K., Ruiz-Lozano P., Ranscht B. T-cadherin is critical for adiponectin-mediated cardioprotection in mice. The Journal of Clinical Investigation. 2010;120(12):4342–4352. doi: 10.1172/jci43464. [DOI] [PMC free article] [PubMed] [Google Scholar]
- 16.Yamauchi T., Nio Y., Maki T., et al. Targeted disruption of AdipoR1 and AdipoR2 causes abrogation of adiponectin binding and metabolic actions. Nature Medicine. 2007;13(3):332–339. doi: 10.1038/nm1557. [DOI] [PubMed] [Google Scholar]
- 17.Jee S. H., Sull J. W., Lee J.-E., et al. Adiponectin concentrations: a genome-wide association study. The American Journal of Human Genetics. 2010;87(4):545–552. doi: 10.1016/j.ajhg.2010.09.004. [DOI] [PMC free article] [PubMed] [Google Scholar]
- 18.Chung C.-M., Lin T.-H., Chen J.-W., et al. A genome-wide association study reveals a quantitative trait locus of adiponectin on CDH13 that predicts cardiometabolic outcomes. Diabetes. 2011;60(9):2417–2423. doi: 10.2337/db10-1321. [DOI] [PMC free article] [PubMed] [Google Scholar]
- 19.Gao H., Kim Y.-M., Chen P., et al. Genetic variation in CDH13 is associated with lower plasma adiponectin levels but greater adiponectin sensitivity in east Asian populations. Diabetes. 2013;62(12):4277–4283. doi: 10.2337/db13-0129. [DOI] [PMC free article] [PubMed] [Google Scholar]
- 20.Wu Y., Gao H., Li H., et al. A meta-analysis of genome-wide association studies for adiponectin levels in East Asians identifies a novel locus near WDR11-FGFR2. Human Molecular Genetics. 2014;23(4):1108–1119. doi: 10.1093/hmg/ddt488. [DOI] [PMC free article] [PubMed] [Google Scholar]
- 21.Teng M. S., Hsu L. A., Wu S., et al. Association of CDH13 genotypes/haplotypes with circulating adiponectin levels, metabolic syndrome, and related metabolic phenotypes: the role of the suppression effect. PLoS ONE. 2015;10(4) doi: 10.1371/journal.pone.0122664.e0122664 [DOI] [PMC free article] [PubMed] [Google Scholar]
- 22.Williams A. S., Kasahara D. I., Verbout N. G., et al. Role of the adiponectin binding protein, T-cadherin (Cdh13), in allergic airways responses in mice. PLoS ONE. 2012;7(7) doi: 10.1371/journal.pone.0041088.e41088 [DOI] [PMC free article] [PubMed] [Google Scholar]
- 23.Teng M.-S., Hsu L.-A., Wu S., et al. Mediation analysis reveals a sex-dependent association between ABO gene variants and TG/HDL-C ratio that is suppressed by sE-selectin level. Atherosclerosis. 2013;228(2):406–412. doi: 10.1016/j.atherosclerosis.2013.03.032. [DOI] [PubMed] [Google Scholar]
- 24.WHO Expert Consultation. Appropriate body-mass index for Asian populations and its implications for policy and intervention strategies. The Lancet. 2004;363(9403):157–163. doi: 10.1016/S0140-6736(03)15268-3. [DOI] [PubMed] [Google Scholar]
- 25.Ko Y.-L., Hsu L.-A., Hsu K.-H., Ko Y.-H., Lee Y.-S. The interactive effects of hepatic lipase gene promoter polymorphisms with sex and obesity on high-density-lipoprotein cholesterol levels in Taiwanese-Chinese. Atherosclerosis. 2004;172(1):135–142. doi: 10.1016/j.atherosclerosis.2003.09.013. [DOI] [PubMed] [Google Scholar]
- 26.Register T. C., Burdon K. P., Lenchik L., et al. Variability of serum soluble intercellular adhesion molecule-1 measurements attributable to a common polymorphism. Clinical Chemistry. 2004;50(11):2185–2187. doi: 10.1373/clinchem.2004.036806. [DOI] [PubMed] [Google Scholar]
- 27.Rothenbacher D., Brenner H., März W., Koenig W. Adiponectin, risk of coronary heart disease and correlations with cardiovascular risk markers. European Heart Journal. 2005;26(16):1640–1646. doi: 10.1093/eurheartj/ehi340. [DOI] [PubMed] [Google Scholar]
- 28.Wannamethee S. G., Sattar N., Rumley A., Whincup P. H., Lennon L., Gordon D. O. Tissue plasminogen activator, von Willebrand factor, and risk of type 2 diabetes in older men. Diabetes Care. 2008;31(5):995–1000. doi: 10.2337/dc07-1569. [DOI] [PubMed] [Google Scholar]
- 29.Fargnoli J. L., Sun Q., Olenczuk D., et al. Resistin is associated with biomarkers of inflammation while total and high-molecular weight adiponectin are associated with biomarkers of inflammation, insulin resistance, and endothelial function. European Journal of Endocrinology. 2010;162(2):281–288. doi: 10.1530/EJE-09-0555. [DOI] [PMC free article] [PubMed] [Google Scholar]
- 30.Chou H.-H., Hsu L.-A., Wu S., Teng M.-S., Sun Y.-C., Ko Y.-L. Leptin-to-adiponectin ratio is related to low grade inflammation and insulin resistance independent of obesity in non-diabetic Taiwanese: a cross-sectional cohort study. Acta Cardiologica Sinica. 2014;30(3):204–214. [PMC free article] [PubMed] [Google Scholar]
- 31.Hebbard L., Ranscht B. Multifaceted roles of Adiponectin in cancer. Best Practice & Research: Clinical Endocrinology & Metabolism. 2014;28(1):59–69. doi: 10.1016/j.beem.2013.11.005. [DOI] [PMC free article] [PubMed] [Google Scholar]
- 32.Matsuda K., Fujishima Y., Maeda N., et al. Positive feedback regulation between adiponectin and T-cadherin impacts adiponectin levels in tissue and plasma of male mice. Endocrinology. 2015;156(3):934–946. doi: 10.1210/en.2014-1618. [DOI] [PMC free article] [PubMed] [Google Scholar]
- 33.Lee M.-H., Klein R. L., El-Shewy H. M., Luttrell D. K., Luttrell L. M. The adiponectin receptors AdipoR1 and AdipoR2 activate ERK1/2 through a Src/Ras-dependent pathway and stimulate cell growth. Biochemistry. 2008;47(44):11682–11692. doi: 10.1021/bi801451f. [DOI] [PMC free article] [PubMed] [Google Scholar]
- 34.Deepa S. S., Dong L. Q. Appl1: role in adiponectin signaling and beyond. American Journal of Physiology—Endocrinology and Metabolism. 2009;296(1):E22–E36. doi: 10.1152/ajpendo.90731.2008. [DOI] [PMC free article] [PubMed] [Google Scholar]
- 35.Bag S., Anbarasu A. Revealing the strong functional association of adipor2 and cdh13 with adipoq: a gene network study. Cell Biochemistry and Biophysics. 2015;71(3):1445–1456. doi: 10.1007/s12013-014-0367-9. [DOI] [PubMed] [Google Scholar]
- 36.Philippova M., Suter Y., Toggweiler S., et al. T-cadherin is present on endothelial microparticles and is elevated in plasma in early atherosclerosis. European Heart Journal. 2011;32(6):760–771. doi: 10.1093/eurheartj/ehq206. [DOI] [PubMed] [Google Scholar]
- 37.Lee S., Kwon M., Park T. Network graph analysis of gene-gene interactions in genome-wide association study data. Genomics & Informatics. 2012;10(4):256–262. doi: 10.5808/gi.2012.10.4.256. [DOI] [PMC free article] [PubMed] [Google Scholar]
- 38.Lee J. H., Shin D.-J., Park S., Kang S.-M., Jang Y., Lee S.-H. Association between CDH13 variants and cardiometabolic and vascular phenotypes in a Korean population. Yonsei Medical Journal. 2013;54(6):1305–1312. doi: 10.3349/ymj.2013.54.6.1305. [DOI] [PMC free article] [PubMed] [Google Scholar]
- 39.Vuillaume M.-L., Naudion S., Banneau G., et al. New candidate loci identified by array-CGH in a cohort of 100 children presenting with syndromic obesity. American Journal of Medical Genetics Part A. 2014;164(8):1965–1975. doi: 10.1002/ajmg.a.36587. [DOI] [PubMed] [Google Scholar]
- 40.Fava C., Danese E., Montagnana M., et al. A variant upstream of the CDH13 adiponectin receptor gene and metabolic syndrome in Swedes. The American Journal of Cardiology. 2011;108(10):1432–1437. doi: 10.1016/j.amjcard.2011.06.068. [DOI] [PubMed] [Google Scholar]
- 41.Bromhead C., Miller J. H., McDonald F. J. Regulation of T-cadherin by hormones, glucocorticoid and EGF. Gene. 2006;374(1-2):58–67. doi: 10.1016/j.gene.2006.01.013. [DOI] [PubMed] [Google Scholar]