

Abstract
In biomedical research, we are often interested in quantifying the relationship between an exposure and an outcome. “Odds” and “Risk” are the most common terms which are used as measures of association between variables. In this article, which is the fourth in the series of common pitfalls in statistical analysis, we explain the meaning of risk and odds and the difference between the two.
Keywords: Biostatistics, odds ratio, risk
INTRODUCTION
Researchers are often interested in evaluating the association between an exposure and an outcome. In other words, they are interested in knowing whether the presence of a risk factor or performing an intervention alters the risk of an outcome as compared to the absence of the risk factor or of the intervention (the “control” situation).
RISK AND ODDS: DEFINITIONS
“Risk” refers to the probability of occurrence of an event or outcome. Statistically, risk = chance of the outcome of interest/all possible outcomes. The term “odds” is often used instead of risk. “Odds” refers to the probability of occurrence of an event/probability of the event not occurring. At first glance, though these two concepts seem similar and interchangeable, there are important differences that dictate where the use of either of these is appropriate.
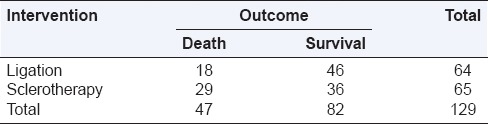
Let us look at the hypothetical example of a randomized trial comparing endoscopic sclerotherapy (n = 65) versus band ligation (n = 64) for the treatment of bleeding esophageal varices [Table 1]. The overall risk of death = 47/129 ([number of deaths]/[all outcomes i.e., all deaths + survivors]) =0.36. The overall odds of death = 47/82 ([number of deaths]/[number of nondeaths, i.e., survivors]) =0.57. The risk of death in the ligation group was 18/64 (28% or 0.28), and the risk of death in the sclerotherapy group was 29/65 (44% or 0.44). By contrast, the odds of death in the two groups was 18/46 (0.39) and 29/36 (0.81), respectively.
Table 1.
A randomized trial of sclerotherapy versus ligation for esophageal varices (hypothetical data)
RELATIONSHIP OF RISK AND ODDS
In the example above, for the same data set, the chances of death appear markedly different when expressed as risks and odds.
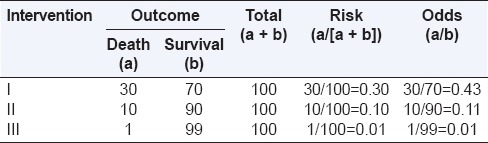
Table 2 shows the risk and odds for different event rates. As “a” decreases with respect to “b” (probability of outcome becomes less), the odds and risk are similar. For rare events (i.e., if “a” is small and “a + b” approaches “b”), a/(a + b) ≈ a/b and risk approximates odds. Therefore, though “odds” does not represent true risk, its value is close to risk when the event rates are low (typically <10%).[1]
Table 2.
Risk and odds for different event rates
RELATIVE RISK AND ODDS RATIO
The relative risk (also known as risk ratio [RR]) is the ratio of risk of an event in one group (e.g., exposed group) versus the risk of the event in the other group (e.g., nonexposed group). The odds ratio (OR) is the ratio of odds of an event in one group versus the odds of the event in the other group.
An RR (or OR) of 1.0 indicates that there is no difference in risk (or odds) between the groups being compared. An RR (or OR) more than 1.0 indicates an increase in risk (or odds) among the exposed compared to the unexposed, whereas a RR (or OR) <1.0 indicates a decrease in risk (or odds) in the exposed group. As for other summary statistics, confidence intervals can be calculated for RR and OR.
In the same example, the RR of death in ligation group versus sclerotherapy group = 0.28/0.44 = 0.63. This means that the risk of death after ligation is 63% of the risk of death after sclerotherapy. This implies that ligation decreases the risk of death by 37% (calculated as 100 minus 63%) as compared with sclerotherapy. The OR for death in ligation group versus sclerotherapy group = 39/81 = 0.48. This means that the odds of death after ligation is 48% of the odds of death after sclerotherapy, or that ligation decreases the odds of death by 52% as compared with sclerotherapy.
RELATIONSHIP OF RISK RATIO AND ODDS RATIO
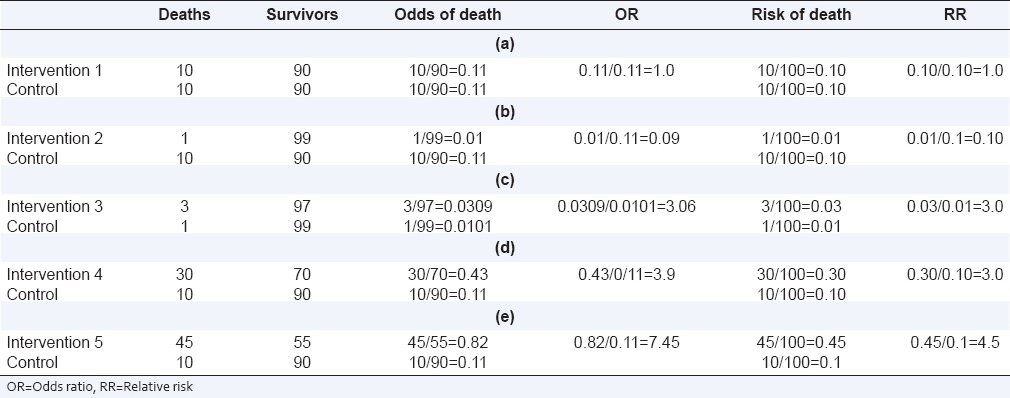
Though OR also indicates the nature of association between exposure and outcome, it is not identical to RR. The relationship of OR and RR is complex. Table 3 shows RR and OR for different event rates. When there is no association between exposure and outcome, both OR and RR are identical and equal to 1.0 [Table 3a]. When there is an association between an exposure and an outcome, OR exaggerates the estimate of their relationship (is farther from 1.0 than RR). Thus, when RR <1, OR is lower than RR [Table 3b]; by contrast, when RR is more than 1.0, OR is higher than the RR [Tables 3c–e]. When the outcome is rare (typically <10%), the value of OR is not too different from that of RR, and the two can be used interchangeably irrespective of whether the risk is lower [Table 3b] or higher [Table 3c] in the exposed group as compared to the unexposed.[1] As event rates increase [Tables 3d or e], the two ratios diverge and can no longer be used interchangeably.
Table 3.
RR and OR for different event rates
WHEN SHOULD ONE USE RISK RATIO AND ODDS RATIO?
Calculation of risk requires the use of “people at risk” as the denominator. In retrospective (case-control) studies, where the total number of exposed people is not available, RR cannot be calculated and OR is used as a measure of the strength of association between exposure and outcome. By contrast, in prospective studies (cohort studies), where the number at risk (number exposed) is available, either RR or OR can be calculated.
Multiple logistic regression, a frequently used multivariate technique, calculates adjusted ORs and not RRs.
Financial support and sponsorship
Nil.
Conflicts of interest
There are no conflicts of interest.
REFERENCE
- 1.Sedgwick P. Relative risks versus odds ratios. BMJ. 2014;348:g1407. [Google Scholar]