ABSTRACT
Objective
Practical quality-of-life (QOL) screening methods are needed to help focus clinical decision-making on what matters to individuals with disabilities.
Design
A secondary analysis of a database from a large study of adults aging with impairments focused on four diagnostic groups: cerebral palsy (n = 134), polio (n = 321), rheumatoid arthritis (n = 99), and stroke (n = 82). Approximately 20% of cases were repeated measures of the same individuals 3–5 yrs later. Functional levels, depression, and social interactions were assessed. The single-item, subjective, seven-point Kemp Quality of Life Scale measured QOL. For each diagnostic group, Kemp Quality of Life Scale responses were divided into low, average, and high QOL subgroups. Analysis of variance and Tukey honestly significant difference tests compared clinical characteristics among these subgroups.
Results
Duration of disability varied among the four groups. Within each group, QOL subgroups were similar in age, sex, and duration of disability. Low mean QOL was associated with lower functional level, higher depression scores, and lower social interaction (P < 0.001) in all four groups. In contrast, high mean QOL was associated with higher social interaction (P < 0.001).
Conclusion
The Kemp Quality of Life Scale relates significantly to clinically relevant variables in adults with impairments. The scale’s utility in direct clinical care merits further examination.
Key Words: Quality-of-Life, Rehabilitation, Depression, Disability
Physicians and health care providers understand that a range of health intervention outcomes are important to patients. Among these can be improved daily functioning, restored social interactions and participation, and improved quality-of-life (QOL) along with disease and symptom management. Education and training of medical students, medical residents, and fellows are evolving to address these broader functional and QOL issues.1,2 More specifically, QOL is especially important. Clinicians need to have a solid understanding of how patients rate their overall QOL. The effect of medical interventions on personal QOL, whether improved or harmed, is how most people determine, first, whether those interventions have been helpful and, second, whether they are worth the costs and effort. As described by Andrews and Withey, most people readily provide a response when asked for a global evaluation of their QOL (see Ref. 3, pp. 64–65). They do it promptly and with ease. More recently, Dijkers observed, “Most people do have tabs on their quality of life in a more-or-less quantitative calculus, and can translate their current score into the numbers offered by an investigator.”4 Use of QOL measures in clinical care therefore has the potential to help clinicians focus better on what matters to patients themselves as well as on medical management of patients’ conditions.5
However, measurement of QOL includes many considerations.6–8 The World Health Organization defined QOL as “an individual’s perception of their position in life in the context of the culture and value systems in which they live, in relation to their goals, expectations, standards, and concerns.”9 This definition has been operationalized differently by researchers with emphases on specific elements including measuring expectations vs. experience, considerations of time points in the trajectory of an individual’s life, and dependency on type of population surveyed.10–13 Discrepancies and similarities can occur among different raters, including clinicians, family, and individuals themselves.4,14–18 Items or elements measured in multi-item scales depend on the perspectives used, whether more of researchers’ or patients’.19
Of special interest is the finding of a “disability paradox” in 1999. Albrecht and Devlieger20 highlighted the importance of self-rated QOL. They reported that more than half of individuals with moderate to severe disability and limited resources nonetheless rated their QOL as good to excellent, rather than fair to poor. These findings may seem counterintuitive for those unfamiliar with the lives of people with disabilities. Other studies have shown similar “paradoxical” results in individuals with serious medical conditions who nonetheless rate their QOL as good.5,11 These findings have contributed to specific research on measurement of QOL in populations with different diagnoses. They emphasize the importance of having QOL measured by asking individuals themselves.21,22 Another consideration in multi-item measures is the mix of more objective and the more subjective items in the same scale. This approach is exemplified by tools like the Short Form-36 and the World Health Organization Quality of Life (WHOQOL)-100 and WHOQOL-BREF.9,23–25 Many of these scales target specific concepts like health-related QOL, functionally related QOL, and socially related QOL.
Several challenges exist currently in relation to using these scales in daily clinical care. First, measures may not be designed for rapid use in the flow of clinical care. This may be attributed to (1) multiple items in the scale, (2) requirements for computerized scoring, and/or (3) difficult interpretation of results for practical clinical decision-making. Second, some items in the scales do not apply to certain populations. Functionally oriented measures, unless specifically designed and tested, are not applicable to people with disabilities that are otherwise healthy.26,27 Third, some items, such as asking about sexuality, may be seen as intrusive.28 Fourth, the practicality and clinical utility of many QOL measures have not been evaluated. These aspects require systematic planning, training, and measurement.5
In clinical encounters, measures that reflect patients’ or individuals’ points of view, as distinct from clinicians’ views, regarding their own QOL are especially needed. One possibility is to use a single-item, self-defined global QOL measure to address a patient’s subjective, self-rated QOL as a screening tool in busy clinical care. This type of a global measure would have “all domains of life taken together” and “evaluated in one single judgment.”4 An example is a measure “How do you feel about your life as a whole?” with response choices referred to as the Delighted-Terrible Scale (see Ref. 3, pp. 18–20). Specific words anchor seven response choices: Delighted, Pleased, Mostly Satisfied, Mixed (about equally satisfied and dissatisfied), Mostly dissatisfied, Unhappy, and Terrible. This measure is designed as a population survey tool. Two considerations for clinical use of this scale are the use of the term feel in the question and the choice of anchoring terms. The process of rating one’s QOL includes more than feelings. The assessment depends on thoughts, or cognitive assessments, as well. Second, the anchors may not represent, necessarily, an equal linear progression as indicated in the numbers of the scale. They do not necessarily represent “evenly spaced” judgments. However, according to the researchers, the labels were used to decrease the possible ambiguity of meaning of the numeric scores.
These two considerations are addressed in another single-item, self-defined subjective QOL measure, the Kemp Quality of Life Scale (KQOL) (Fig. 1). In this measure, QOL is considered a single entity that has two extremes: one positive and one negative.29–32 As with other global scales, a person’s QOL can range from low (and negative) to high (and positive). There is also a midpoint where QOL is neither positive nor negative and the person is just “getting by.” This midpoint conveys that the absence of a negative QOL does not imply the presence of a positive QOL.
FIGURE 1.
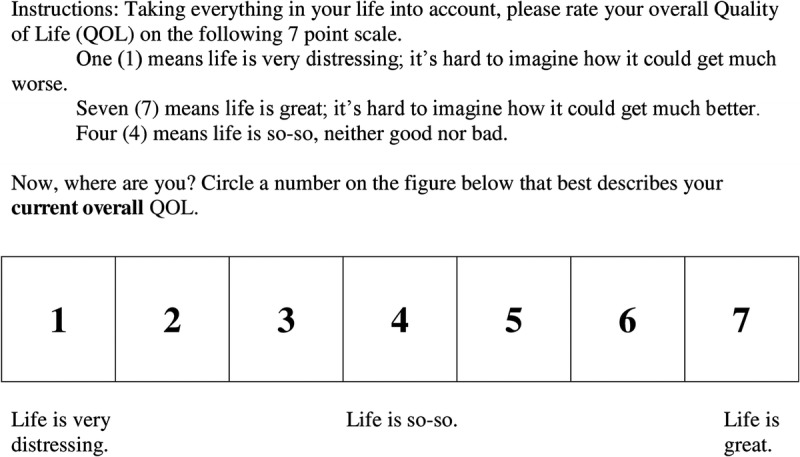
Likert scale with anchors for response to KQOL.
A large study of aging in individuals with physical impairments used the KQOL measure to assess participants’ QOL.33 Examination of these data could add evidence toward the possible clinical utility of the measure. Therefore, the current report evaluates the KQOL in four groups of individuals with different types of impairments. The objectives were (1) to examine how KQOL scores would be distributed across individuals with cerebral palsy, polio, rheumatoid arthritis, and stroke and (2) to examine differences on key psychosocial and functional variables among those with low, average, and high KQOL scores within each impairment group.
METHODS
This is a secondary analysis of a database collected as part of a large study, “The Natural Course of Aging among People with a Physical Impairment.”33 Adult volunteers were recruited through letters and advertisements placed around the hospital campus and university campus and in newspapers. Data were collected through in-person clinical interviews at a large rehabilitation center and university in Southern California. The study was approved by the institutional review boards at each site and written informed consents were obtained.
General demographic data were collected, including sex, age, ethnicity, and years of education. Disability-related information included age of onset and impairment or disability duration. The measure of functional level was the number of 14 functional activities done without help using the Older Adults Resource and Services Program Multidimensional Functional Assessment Questionnaire, Activities of Daily Living.34 A depression screen was the Older Adult Health and Mood Questionnaire with the following scoring norms: 0–5, normal; 6–10, minor to moderate depression; greater than 11, possible major depression.35,36 This 22-item questionnaire places less emphasis on somatic symptoms of depression that may be present because of physical impairments or disability rather than depressed mood. Social interactions, activities, and/or participation were assessed using the Kahan Social Interaction Inventory. The inventory included the total frequency during 1 wk of doing any of 16 activities.36,37 These included social, interpersonal, leisure, romantic, pleasurable, and group activities. Examples include talking to a neighbor or planning an evening out. Study participants completed paper versions of the functional level, depression, and social interaction measures. Interviewers administered the KQOL to measure QOL.29,33 Patients were asked, “Taking everything in your life into account, please rate your overall Quality of Life on the following seven-point scale.” The anchoring terms “very distressing,” “so-so,” and “great” are explained as described in Figure 1. Participants circled their response on a paper version of Figure 1 that only included the scale and anchoring terms.
All demographic, questionnaire, and KQOL data were entered by research assistants into an electronic database for analysis. Checks for quality of data entry were conducted. No variable had more than 3% missing data across impairment groups. A fully deidentified database was created. Approximately 20% of responses include individuals’ data from a substudy on follow-up 3–5 yrs after initial assessment. These could not be removed from the database because no variables were kept to identify these repeated-measures entries. However, the exact same survey information was collected in the follow-up project from individuals in all four impairment groups.
To create three QOL subgroups, QOL scores for each impairment type were divided into low, average, and high score subgroups. First, the mean QOL score and standard deviation were calculated for the entire sample of all four groups. The “low QOL” subgroup consisted of participants with a QOL score that was 1 SD or more below the mean. The “average QOL” subgroup included those participants scoring approximately at the mean. Participants in the “high QOL” subgroup had QOL scores 1 SD or more above the mean.
Statistical Analyses
Descriptive analyses include frequencies of categorical variables and mean and standard deviation for continuous variables for each impairment group.
Unadjusted analyses of variance were used to compare QOL subgroups of each impairment group on the clinical characteristics of interest. Separate analyses were performed for each impairment type. Tukey honestly significant difference post hoc multiple comparison tests identify which QOL subgroup pairs differed significantly.
RESULTS
Demographics for each impairment group, including mean age, sex, ethnicity, level of education, age of disability onset, and mean disability duration are included in Table 1. Mean (SD) age of participants was youngest (51.1 [11.9] yrs) for cerebral palsy and oldest for the polio (66.9 [11.8] yrs) and stroke (67.1 [9.9] yrs) groups. Sex varied. Ethnic diversity varied in all groups from 11% to 50% non-white. Education levels were similar around a mean of 14 yrs in all groups. Age of disability onset varied from birth for cerebral palsy, childhood to adolescence for polio, young to later adulthood for rheumatoid arthritis, and later middle age for stroke. Mean duration of disability was greater than 50 yrs for the cerebral palsy and polio groups and 27 and 11 yrs for the rheumatoid arthritis and stroke groups, respectively.
TABLE 1.
Characteristics and subjective QOL scores for different groups
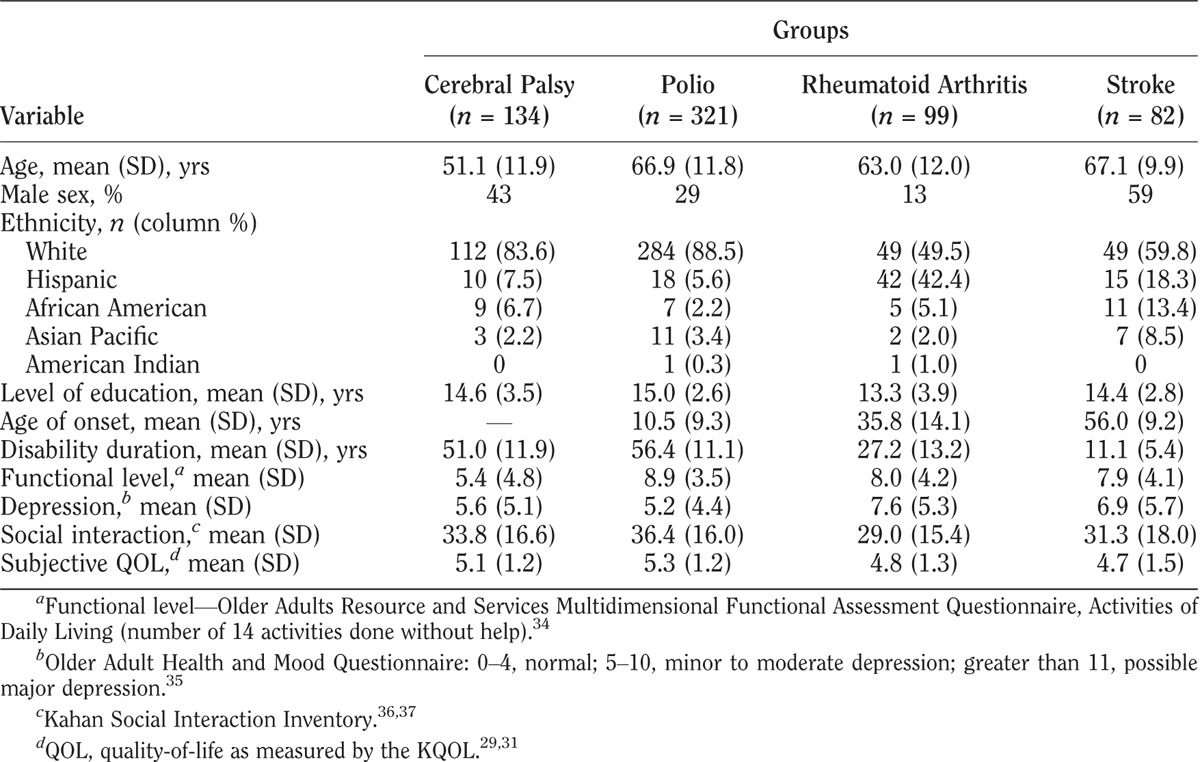
Mean (SD) functional levels were least for the cerebral palsy (5.4 [4.8]) group and higher (around 8–9) for the other three groups. Mean depression screening scores varied from lowest (5.2) to highest (7.6) in the polio and rheumatoid arthritis groups, respectively. Mean social interaction results ranged from 29.0 to 36.4 in the rheumatoid arthritis and polio groups, respectively.
The KQOL mean (SD) for the entire study sample was 5.1 (1.3). Based on this result, participants were assigned to the low, average, and high QOL subgroups. The low group included scores 1–4, the average group reflected a score of 5, and the high group included scores of 6 and 7. Of note, only two participants lacked responses to the KQOL measure and were excluded from subsequent analyses.
Mean KQOL scores were somewhat different among the four groups: cerebral palsy, 5.1; polio, 5.3; rheumatoid arthritis, 4.8; and stroke, 4.7. The distribution of individual KQOL scores is shown in Table 2.
TABLE 2.
KQOL scores by impairment group

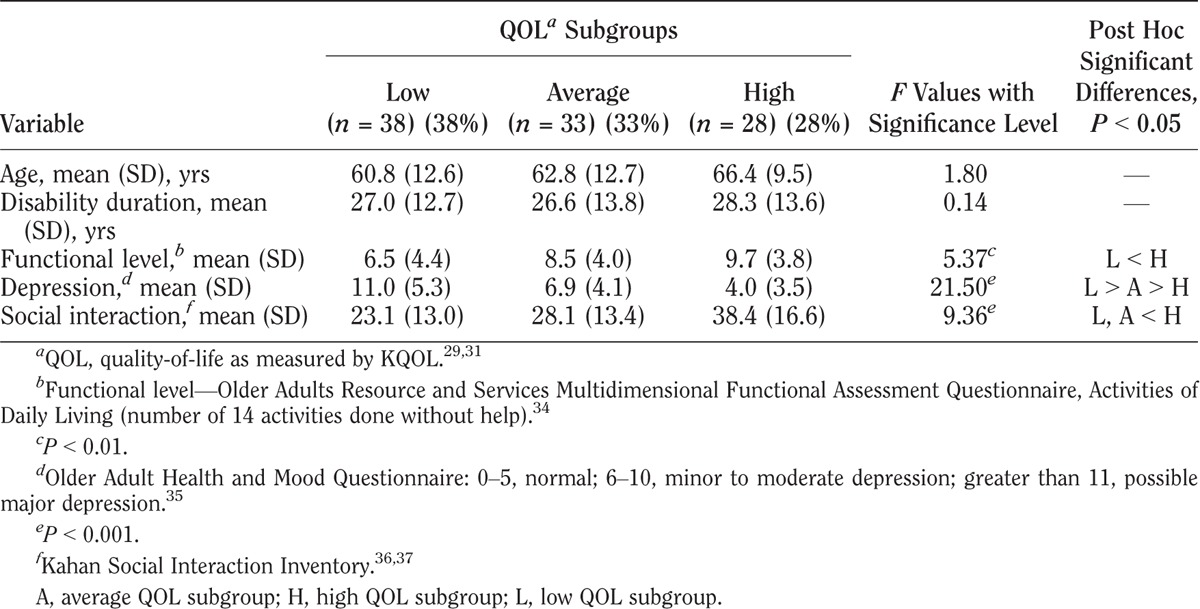
KQOL scores varied among the three QOL subgroups in all four impairment groups as shown in Tables 3–6. Within each impairment group, there were no differences in either sex or disability duration among the three QOL levels. Ages differed only among stroke participants. The QOL subgroups differed in functional levels. Higher functional level was associated with higher QOL in all but the cerebral palsy group. High depression screening scores (greater depression) were associated with the low QOL subgroups compared with the average and high QOL subgroups. Social interaction levels were least in the low QOL compared with the average and high QOL subgroups in the cerebral palsy and stroke groups. In the polio group, all three groups differed significantly, with least social interaction also in the low QOL group. In the rheumatoid arthritis group, both the low and average QOL subgroups had lower social interaction than the high QOL subgroup.
TABLE 3.
Characteristics of QOL subgroups for cerebral palsy
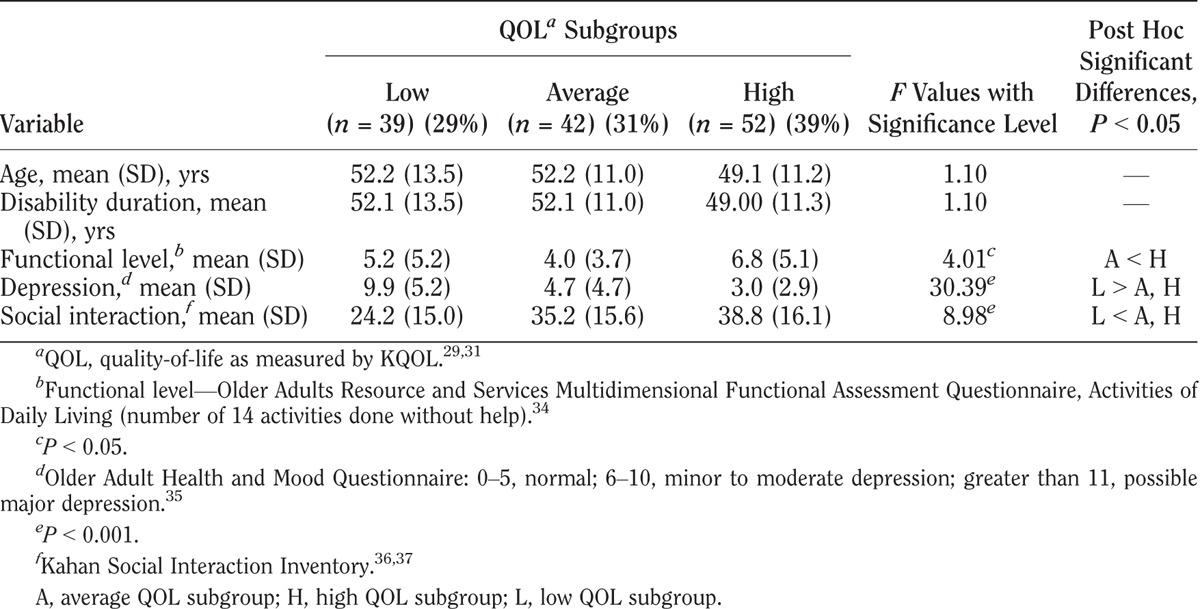
TABLE 6.
Characteristics of QOL subgroups with stroke
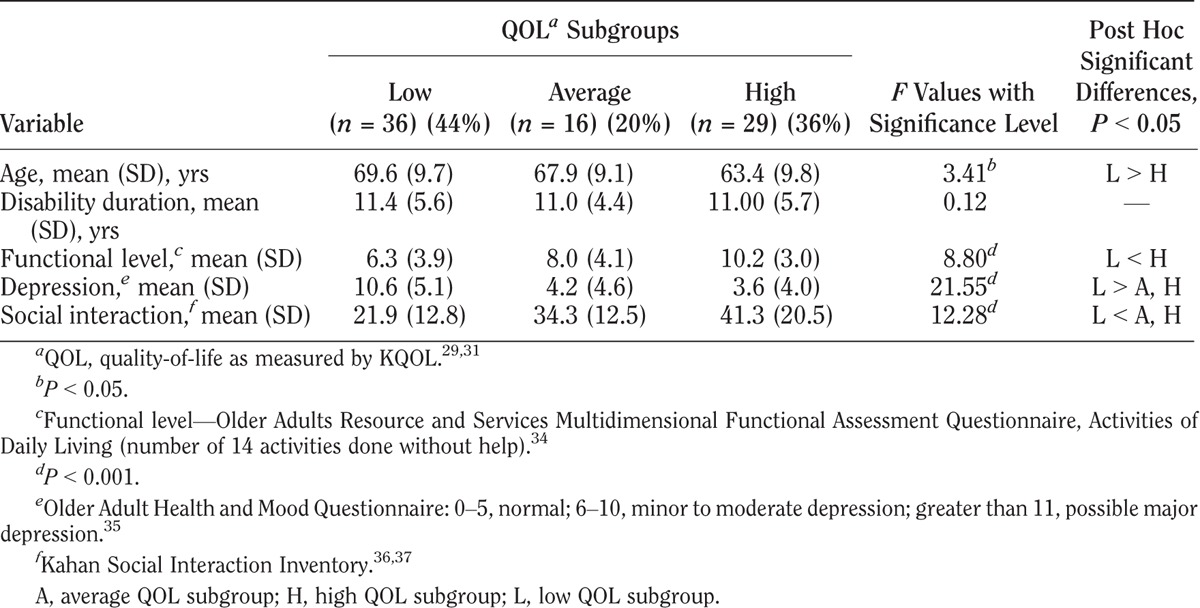
TABLE 4.
Characteristics of QOL subgroups with polio
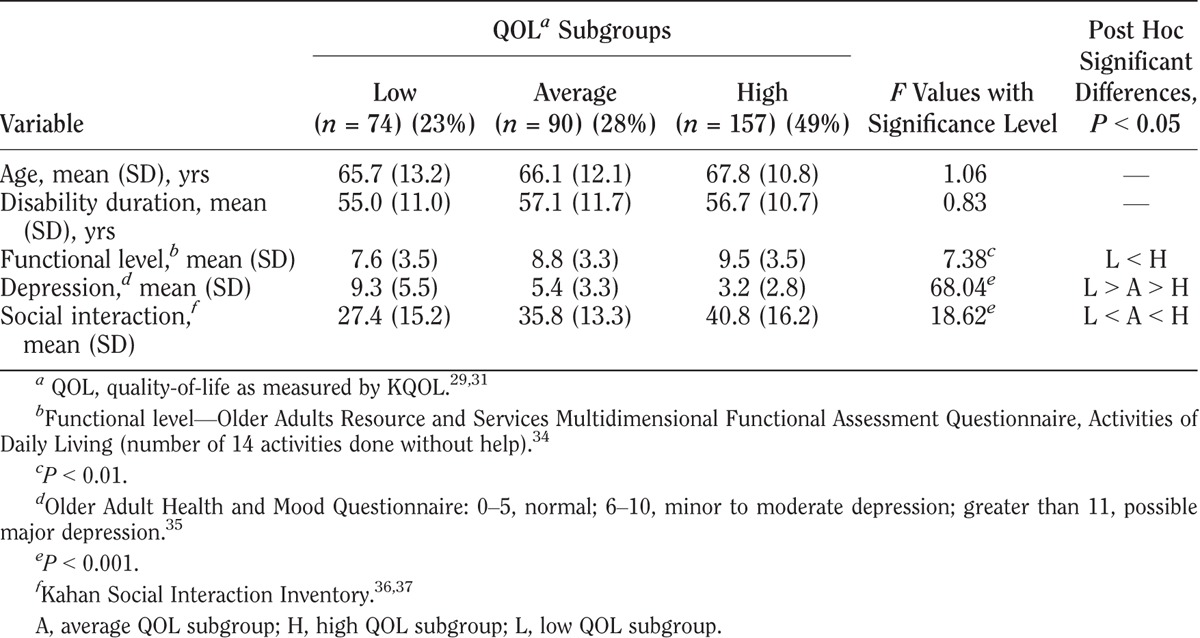
TABLE 5.
Characteristics of QOL subgroups with rheumatoid arthritis
DISCUSSION
In answer to the first objective, to examine the distribution of KQOL scores in four impairment groups, responses showed a range among low, average, and high scores in all four impairment groups. Study participants readily responded to the question, with only 0.03% missing data on this item. The use of only three anchoring terms at the low, middle, and high points of the scale seemed to work well. The use of a seven-point screening scale may help show a response range more effectively in the clinical setting than five-point global QOL scales. Others have chosen seven-point scales because evidence suggests that a seven-category division is about as fine a discrimination as the average person makes for many judgment issues. Also, seven categories are sufficient to capture essentially all potential variance (see Ref. 3, p. 19). In another study, researchers obtained feedback from individuals with muscular diseases who reported that they preferred a seven-point to a five-point Likert scale.22 Therefore, the KQOL measure may be a useful single-item, self-reported screening tool in clinical practice for individuals with a variety of impairments. Individuals can use their own frame of reference, considering what is most meaningful to them, in providing their QOL ratings.
In response to the second objective, to examine differences in clinical variables among low, average, and high KQOL groups, results showed that demographic variables and disability duration did not differ significantly among the low, average, and high QOL subgroups. However, the functional measure of activities of daily living, the psychologic measure of depression, and the measure of social activities did vary.
In all four groups, low QOL was associated with lower scores of functional independence. This has been shown in some, yet not all, studies examining QOL measures in individuals with impairments.15,20,22,29 Some potential confounders—or contributors—to lower QOL in people with disabilities may be pain, fatigue, and depression.38–40 Higher depression screening scores in this report and other studies have consistently been associated with lower QOL.9,23,41 These findings support that the low KQOL scores may serve as screens for both low QOL and depression. These lower KQOL scores may also be reflecting other bothersome symptoms that patients may have. In contrast, the high QOL subgroups all had a greater number of social interactions (activities or participation). This importance of social activities and social relationships is highlighted in several multi-item QOL scales.9,22,23
These findings add to the current literature that supports the potential use of the KQOL in research and clinical care. Shoulder pain correlated inversely with KQOL in a study evaluating individuals using manual wheelchairs and who had spinal cord injuries for at least 3 yrs’ duration.42 In a subsequent randomized controlled trial testing an education/exercise intervention, shoulder pain decreased significantly only in the intervention group, most items in the health-related QOL measure (Short-Form-36 Health Survey) improved, and the KQOL score improved 10% (0.5 points) from 4.8 ± 1.3 to 5.3 ± 0.9 (P = 0.04).43 This difference persisted at 4 wks follow-up. Depression and low KQOL were strongly associated (P < 0.001) in another study of individuals with spinal cord injury.31 Similarly, social interaction showed a significant association with high KQOL. These associations remained significant in logistic regression models that included age and disability status. In a comparison study, individuals with spinal cord injury had a slightly lower mean KQOL score (5.2) compared with those without disability (5.7), and many had high KQOL scores.38
These findings add to the growing literature on the use of QOL measures in direct clinical care. Detmar et al.44 found that physicians who were made aware of QOL issues before meeting with the patient were able to identify a greater number of major health problems compared with physicians who were not made aware. Presumably, knowledge of the patient’s QOL, especially those with low QOL, led the physicians to investigate further what was accounting for it. Breek et al.45 likewise have shown that subjective QOL levels, as measured by the WHOQOL-100 in patients with vascular claudication, ranged widely in almost all quartiles of the health status measures as assessed through the Short Form-36. They concluded that for individuals with chronic conditions, objective functioning and subjective appraisal of that functioning are complementary and both can contribute to addressing patients’ needs more effectively.
Additional research on the KQOL’s utility in clinical care is merited.5 As a single question, it serves as a brief exploratory tool. Clinicians can verbally describe the scale, using the directions described in Figure 1, and patients can supply verbal responses that can be recorded by the clinician. For those with lower QOL scores, minimizing negative symptoms like pain when possible and optimizing functional levels may be important strategies as well as exploring individuals’ expectations. However, this requires thoughtful discussion.5,19 Also, the finding in this report, as well as in other studies, of a higher association of depression with low QOL supports the importance of assessing patients with lowest QOL scores (KQOL 1–3) further for clinical depression.
The positive correlation of higher number of self-selected social activities with high QOL also suggests a clinical practice strategy. Discussions could examine ways of increasing social interactions and problem solving barriers for those individuals who wish to increase their QOL through exploring increased social activities. Anecdotal reports suggest this possible clinical application. The authors have the experience, after asking patients to rate their KQOL, of next asking patients what might improve their KQOL score 1/2 to 1 point. In one case, when a patient’s stated goal for an improved KQOL score was to get a girlfriend, the clinician queried if smoking might be a barrier to this. The patient saw a connection, for himself, and stopped his smoking immediately.
Recent research insights on human thought processes identify limitations in using single-item measures in assessing constructs like QOL or well-being. These constructs elicit multidimensional and complex feeling and thought processes that contribute to individuals’ responses.46 Nonetheless, clinical advantages to single-item screening questions remain possible, at an individual level, as in the example above. The response to a single question can enhance brief, meaningful dialogues between patient and clinician. Both parties may benefit from improved insights and more relevant, productive, and practical decision-making. A clinician concerned about a patient’s QOL may find relief when an individual’s KQOL response is 5, 6, or 7. This may help overcome clinician reticence to broach the subject of QOL. Likewise, a response of 1, 2, or 3 may efficiently trigger a clinician’s decision to prioritize depression assessment when this may not have initially seemed warranted.
Additional research is also needed to compare the clinical value of using the KQOL compared with other single QOL items. For example, one global question in the WHOQOL, both 100-item and BREF versions, is “How would you rate your quality of life?” Five response choices are very poor, poor, neither poor nor good, good, and very good. Recent research has shown that this single question correlated strongly with a total combined score of the WHOQOL-BREF, a 26-item cross-cultural tool, for individuals with postpolio syndrome.25 Such comparisons would require comparing normalized scores for those measures without normal distributions.
Limitations
There are several limitations with this study. Data are from a group of volunteers living in the community. Therefore, results may not be representative of all individuals who have impairments associated with these four diagnoses. This limits the generalizability of these results. Another study limitation is that the database, created by combining all responses collected from separately funded projects, includes an estimated 20% of cases in which the same individual is included twice—once with baseline data and then a second time with identical data collection from a follow-up study conducted 3–5 yrs later. No variables were kept to reliably identify the follow-up cases. To the extent that these follow-up cases may not be representative of the entire sample, results may be biased toward individuals with either initial higher or lower QOL scores. However, the relatively large sample size and the spread of QOL scores across all groups suggest that at least a reasonable representation of individuals with low, average, and high QOL was achieved within the sample sizes collected.
CONCLUSION
The KQOL is an easily administered, self-rated global QOL measure. It has been shown to relate significantly to clinically relevant variables in adults with impairments caused by cerebral palsy, polio, rheumatoid arthritis, and stroke. The scale’s utility in direct clinical care merits further study.
Footnotes
Supported by the US Department of Education and the National Institute on Disability and Rehabilitation Research.
Financial disclosure statements have been obtained, and no conflicts of interest have been reported by the authors or by any individuals in control of the content of this article.
This is an open access article distributed under the terms of the Creative Commons Attribution-NonCommercial-NoDerivatives 3.0 License, where it is permissible to download and share the work provided it is properly cited. The work cannot be changed in any way or used commercially.
REFERENCES
- 1. Esselman P, Berbrayer D, Friedly J, et al. Chronic care education in medical schools—A focus on functional health and quality of life. Am J Phys Med Rehabil 2009; 88: 798– 804 [DOI] [PubMed] [Google Scholar]
- 2. Kirshner KL, Curry RH: Educating health care professionals to care for patients with disabilities. JAMA 2009; 302: 1334– 5 [DOI] [PubMed] [Google Scholar]
- 3. Andrews FM, Withey SB: Social Indicators of Well-Being—Americans’ Perception of Life Quality. New York, Plenum, 1976, pp. 455 [Google Scholar]
- 4. Dijkers MP: Individualization in quality of life measurement: Instruments and approaches. Arch Phys Med Rehabil 2003; 84: S3– 14 [DOI] [PubMed] [Google Scholar]
- 5. Higginson IJ, Carr AJ: Using quality of life measures in the clinical setting. BMJ 2001; 322: 1297– 300 [DOI] [PMC free article] [PubMed] [Google Scholar]
- 6. Gill TM, Feinstein AR: A critical appraisal of the quality of quality-of-life measurements. JAMA 1994; 272: 619– 26 [PubMed] [Google Scholar]
- 7.World Health Organization: Quality of Life Assessment—An Annotated Bibliography. Geneva, Switzerland, Division of Mental Health, World Health Organization, 1994 [Google Scholar]
- 8. McDowell I, Newell C: Measuring Health—A Guide to Rating Scales and Questionnaires, 2nd ed New York, NY, Oxford University Press, 1996, pp. 1– 523 [Google Scholar]
- 9.The WHOQOL Group: The World Health Organization Quality of Life Assessment (WHOQOL): Position Paper from the World Health Organization. Soc Sci Med 1995; 41: 1403– 9 [DOI] [PubMed] [Google Scholar]
- 10. O’Boyle CA, McGee H, Hickey A, et al. Individual quality of life in patients undergoing hip replacement. Lancet 1992; 339: 1088– 91 [DOI] [PubMed] [Google Scholar]
- 11. Carr AJ, Higginson IJ: Are quality of life measures patient centred? BMJ 2001; 322: 1357– 60 [DOI] [PMC free article] [PubMed] [Google Scholar]
- 12. Carr AJ, Bison B, Robinson PG: Measuring quality of life—Is quality of life determined by expectations or experience? BMJ 2001; 322: 1240– 3 [DOI] [PMC free article] [PubMed] [Google Scholar]
- 13. Schwartz CE: Applications of response shift theory and methods to participation measurement: A brief history of a young field. Arch Phys Med Rehabil 2010; 91: S38– 43 [DOI] [PubMed] [Google Scholar]
- 14. Slevin ML, Plan H, Lynch D, et al. Who should measure quality of life, the doctor or the patient? Br J Cancer 1988; 57: 109– 12 [DOI] [PMC free article] [PubMed] [Google Scholar]
- 15. Rothwell PM, McDowell Z, Wong CK, et al. Doctors and patients don’t agree: Cross sectional study of patients’ and doctors’ perceptions and assessments of disability in multiple sclerosis. BMJ 1997; 314: 1580– 3 [DOI] [PMC free article] [PubMed] [Google Scholar]
- 16. Sneeuw KCA, Aaronson NK, Sprangers MAG, et al. Comparison of patient and proxy EORTC QLQ-C30 ratings in assessing the quality of life of cancer patients. J Clin Epidemiol 1998; 51: 617– 31 [DOI] [PubMed] [Google Scholar]
- 17. Addington-Hall J, Kalra L: Who should measure quality of life? BMJ 2001; 322: 1417– 20 [DOI] [PMC free article] [PubMed] [Google Scholar]
- 18. Stineman MG, Ross RN, Maislin G, et al. Recovery preference exploration: Analysis of patient feedback after imagined scenarios. Am J Phys Med Rehabil 2007; 86: 272– 81 [DOI] [PubMed] [Google Scholar]
- 19. Ruta DA, Garratt AM, Leng M, et al. A new approach to the measurement of quality of life—The Patient-Generated Index. Med Care 1994; 32: 1109– 26 [DOI] [PubMed] [Google Scholar]
- 20. Albrecht GL, Devlieger PJ: The disability paradox: High quality of life against all odds. Soc Sci Med 1999; 48: 977– 88 [DOI] [PubMed] [Google Scholar]
- 21. Hallan S, Åsberg A, Indredavik B, et al. Quality of life after cerebrovascular stroke: A systematic study of patients’ preferences for different functional outcomes. J Intern Med 1999; 246: 309– 16 [DOI] [PubMed] [Google Scholar]
- 22. Vincent KA, Carr AJ, Walburn J, et al. Construction and validation of quality of life questionnaire for neuromuscular disease (INQoL). Neurology 2007; 68: 1051– 7 [DOI] [PubMed] [Google Scholar]
- 23. Ware JE, Sherbourne CD: The MOST 36-item Short Form Health Survey (SF-36): Conceptual framework and item selection. Med Care 1992; 30: 473– 83 [PubMed] [Google Scholar]
- 24. Saxena S, Carlson D, Billington R, et al. The WHO quality of life assessment instrument (WHOQOL-Bref): The importance of its items for cross-cultural research. Qual Life Res 2001; 10: 711– 21 [DOI] [PubMed] [Google Scholar]
- 25. Pomeroy IM, Tennant A, Young CA: Rasch analysis of the WHOQOL-BREF in post polio syndrome. J Rehabil Med 2013; 45: 873– 80 [DOI] [PubMed] [Google Scholar]
- 26. Hays RD, Hahn H, Marshall G: Use of the SF-36 and other health-related quality of life measures to assess persons with disabilities. Arch Phys Med Rehabil 2002; 83: S4– 9 [DOI] [PubMed] [Google Scholar]
- 27. Dijkers MP: Quality of life in individuals with spinal cord injury: A review of conceptualization, measurement, and research findings. J Rehabil Res Dev 2005; 42: 87– 110 [DOI] [PubMed] [Google Scholar]
- 28. Jang Y, Hsieh C-l, Wang Y-H, et al. A validity study of the WHOQOL-BREF assessment in persons with traumatic spinal cord injury. Arch Phys Med Rehabil 2004; 85: 1890– 5 [DOI] [PubMed] [Google Scholar]
- 29. Kemp B, Ettelson D: Quality of Life while living and aging with a spinal cord injury and other impairments. Top Spinal Cord Inj Rehabil 2001; 6: 116– 27 [Google Scholar]
- 30. Kemp B: Quality of life, coping, and depression, in Kemp B, Mosqueda L. (eds): Aging with a Disability. Baltimore, MD, Johns Hopkins University Press, 2004. 307 pp., see pp. 48–67 [Google Scholar]
- 31. Kemp BJ, Bateham AL: The role of distress and social involvement in quality of life among people with spinal cord injury. Top Spinal Cord Inj Rehabil 2010; 16: 72– 80 [Google Scholar]
- 32. Kemp B: Quality of Life: What it Really Requires; How to Get It and Keep It. 2012. Amazon.com. pp. 1–262. See also http://kempqualityoflife-com.webs.com/ Accessed October 8, 2013 [Google Scholar]
- 33. Kemp B: Rehabilitation Research and Training Center on Aging with Physical Impairments. Final Report. Downey, CA, Rancho Los Amigos National Rehabilitation Center, University of Southern California, Los Amigos Research & Education Institute, Inc, 2010, pp. 1– 248 [Google Scholar]
- 34. Fillenbaum GG: Chapter 7—Administration of the OARS Multidimensional Functional Assessment Questionnaire, in Multidimensional Functional Assessment of Older Adults. Hillsdale, NJ, Lawrence Erlbaum, 1988;179 pp., see pp. 61–82 [Google Scholar]
- 35. Kemp BJ, Adams BM: The Older Adult Health and Mood Questionnaire: A measure of geriatric depressive disorder. J Geriatr Psychiatry Neurol 1995; 8: 162– 7 [DOI] [PubMed] [Google Scholar]
- 36. Kahan JS, Mitchell JM, Kemp BJ, et al. The results of a 6-month treatment for depression on symptoms, life satisfaction, and community activities among individuals aging with a disability. Rehabil Psychol 2006; 31: 13– 22 [Google Scholar]
- 37. Kahan J, Kemp B, Bateham D, et al. The Social Interaction Inventory: Development, reliability, and validity, in Kemp B, Adkins RH, Mitchell J, et al. (eds): Final Report of the Rehabilitation Research and Training Center on Aging with Physical Impairments 2010. Retrieved from Los Amigos Research and Education Institute, Inc pp. 194– 214 [Google Scholar]
- 38. Kemp B, Tsukerman D, Kahan J, et al. Predicting psychosocial outcomes using a brief measure of quality of life in a sample of people with spinal cord injury. Top Spinal Cord Inj Rehabil 2014; 20: 191– 6 [DOI] [PMC free article] [PubMed] [Google Scholar]
- 39. Skevington SM: Investigating the relationship between pain and discomfort and quality of life, using the WHOQOL. Pain 1998; 76: 395– 406 [DOI] [PubMed] [Google Scholar]
- 40. Abresch RT, Carter GT, Jensen MP, et al. Assessment of pain and health-related quality of life in slowly progressive neuromuscular disease. Am J Hosp Palliat Care 2002; 19: 39– 48 [DOI] [PubMed] [Google Scholar]
- 41. Daly EJ, Trivedi MH, Wisniewski SR, et al. Health-related quality of life in depression: A STAR*D report. Ann Clin Psychiatry 2010; 22: 43– 55 [PubMed] [Google Scholar]
- 42. Gutierrez DD, Thompson L, Kemp B, et al. The relationship of shoulder pain intensity to quality of life, physical activity, and community participation in persons with paraplegia. J Spinal Cord Med 2007; 30: 251– 5 [DOI] [PMC free article] [PubMed] [Google Scholar]
- 43. Mulroy SJ, Thompson L, Kemp B, et al. Strengthening and optimal movements for painful shoulders (STOMPS) in chronic spinal cord injury: A randomized controlled trial. Phys Ther 2011; 91: 305– 24 [DOI] [PubMed] [Google Scholar]
- 44. Detmar SB, Muller MJ, Schornagel JH, et al. Health-related quality of life assessments and patient-physician communication: A randomized control trial. JAMA 2002; 288: 3027– 34 [DOI] [PubMed] [Google Scholar]
- 45. Breek JC, de Vries J, van Heck GL, et al. Assessment of disease impact in patients with intermittent claudication: Discrepancy between health status and quality of life. J Vasc Surg 2005; 41: 443– 50 [DOI] [PubMed] [Google Scholar]
- 46. Kahneman D: Thinking, Fast and Slow. New York, Farrar, Straus and Giroux, 2011, pp. 1– 499 p. 399 [Google Scholar]


