

Abstract
The purpose of this study was to assess whether calibrated magnetic resonance imaging (MRI) can identify regional variances in cerebral hemodynamics caused by vascular disease. For this, arterial spin labeling (ASL)/blood oxygen level-dependent (BOLD) MRI was performed in 11 patients (65±7 years) and 14 controls (66±4 years). Cerebral blood flow (CBF), ASL cerebrovascular reactivity (CVR), BOLD CVR, oxygen extraction fraction (OEF), and cerebral metabolic rate of oxygen (CMRO2) were evaluated. The CBF was 34±5 and 36±11 mL/100 g per minute in the ipsilateral middle cerebral artery (MCA) territory of the patients and the controls. Arterial spin labeling CVR was 44±20 and 53±10% per 10 mm Hg ▵EtCO2 in patients and controls. The BOLD CVR was lower in the patients compared with the controls (1.3±0.8 versus 2.2±0.4% per 10 mm Hg ▵EtCO2, P<0.01). The OEF was 41±8% and 38±6%, and the CMRO2 was 116±39 and 111±40 μmol/100 g per minute in the patients and the controls. The BOLD CVR was lower in the ipsilateral than in the contralateral MCA territory of the patients (1.2±0.6 versus 1.6±0.5% per 10 mmHg ▵EtCO2, P<0.01). Analysis was hampered in three patients due to delayed arrival time. Thus, regional hemodynamic impairment was identified with calibrated MRI. Delayed arrival artifacts limited the interpretation of the images in some patients.
Keywords: calibrated MRI, cerebrovascular reactivity, cerebral metabolic rate of oxygen, internal carotid artery, occlusion, oxygen extraction fraction
Introduction
Severe steno-occlusive disease in the feeding arteries of the brain may result in a reduction of perfusion pressure in the vasculature distal to the obstructive lesion, and may change cerebral hemodynamics.1 The first pathway to counteract the reduction in perfusion pressure involves lowering the resistance of the microvascular bed through vasodilatation. The ability of the vasculature to modulate its tone through dilation or constriction is called the cerebrovascular reserve capacity, which is typically evaluated by measuring the cerebrovascular reactivity (CVR).2 Upon exhaustion of the cerebrovascular reserve capacity, further reductions in perfusion pressure are countered by increasing the oxygen extraction fraction (OEF)3 from arterial blood. When these mechanisms are not sufficient, the cerebral metabolic rate of oxygen (CMRO2) will decrease and this can lead to tissue ischemia.1, 3
Impaired CVR is a predictor for increased risk of ipsilateral stroke and transient ischemic attack (TIA) in patients with steno-occlusive carotid disease.4, 5 Similarly, increased OEF has been shown to predict recurrent ischemic stroke in patients with symptomatic occlusive disease of the cerebral vasculature.6 Furthermore, a higher stroke risk has been observed in patients with impaired CVR and increased OEF when compared with patients with impaired CVR only.7
The current gold standard through which the full range of brain hemodynamic parameters can be investigated is triple oxygen positron emission tomography (O15-PET) imaging. The O15-PET provides quantitative estimates of cerebral blood flow (CBF), cerebral blood volume (CBV), OEF, and CMRO2.8 This technique is invasive and relies on radioactive oxygen-15 (half-life: 2 minutes), which can only be produced in an onsite cyclotron. As an alternative, perfusion or flow techniques combined with a vasodilatory stimulus have been proposed to evaluate the CVR. Invasive techniques such as xenon-enhanced computed tomography5 or noninvasive techniques such as Doppler ultrasonography,4 blood oxygen level-dependent (BOLD) magnetic resonance imaging (MRI),9 or arterial spin labeling MRI10 have been suggested. A dual-echo arterial spin labeling (ASL) sequence can acquire perfusion data (first echo) and BOLD data (from the second echo which has T2* weighting) simultaneously.11 The ASL perfusion data are obtained by subtracting labeled images, in which arterial blood water is inverted to act as a tracer, from control images. The BOLD signal differs from the ASL signal as the BOLD contrast arises from changes in susceptibility that are related to the deoxyhemoglobin concentration, which fluctuates due to changes in CBF, CBV, and CMRO2.9 Dual-echo acquisitions have been previously used to compare ASL-CVR and BOLD-CVR in patients with ischemic cerebrovascular disease and were found to be equally sensitive in the detection of asymmetric steno-occlusive disease.12 Furthermore, when combined with hyperoxic and hypercapnic breathing challenges, acquired data can be used to generate quantitative hemodynamic parameter maps of CBV, OEF, and CMRO2.13 This information is often used in functional MRI studies to quantify the vascular (CBF) and metabolic (CMRO2) changes giving rise to the BOLD contrast in response to a task or stimulus. The vascular-metabolic coupling ratio (CBF/CMRO2) was shown to be region and age dependent14 and the CBF/CMRO2 coupling decreased in the presence of caffeine.15 So far, these calibrated fMRI studies included only healthy volunteers and did not investigate hemodynamic changes in relation to vascular disease.
The purpose of this study was to evaluate whether calibrated MRI techniques could be used to detect regional differences in quantitative hemodynamic parameters caused by vascular disease. If so, calibrated MRI techniques might be used in the future to recognize patients at risk for ischemic stroke, or to evaluate the effect of new drug therapies on cerebral hemodynamics. To evaluate the potential of calibrated MRI, we included patients with an occlusion of the internal carotid artery (ICA) as well as healthy controls. The results from clinical patients were compared against those of the healthy age-matched control group. Regional differences in hemodynamic parameters within the patients were evaluated and the success rate of the hemodynamic measurements (CBF, CBV, CVR, OEF, and CMRO2) was assessed.
Materials and methods
Subjects
This study was approved by the medical ethical review board review board of the University Medical Center Utrecht (Utrecht, The Netherlands). The trial number was NL39070.041.11. The experiments were performed according to the guidelines and regulations of the WMO (Wet Medisch wetenschappelijk Onderzoek). Signed informed consent was obtained from all subjects included in this study. Fifteen asymptomatic (for 9±4 years) patients (14 male) with unilateral or bilateral ICA occlusion were included. The mean age of these patients was 65±7 years. Magnetic resonance imaging could not be completed in four patients due to claustrophobia (n=2) or anxiety evoked by hypercapnic breathing. The baseline characteristics of the remaining 11 patients are shown in Table 1. Of these 11 patients (mean age 66±7 years, 10 males), 3 patients had double-sided occlusion (Table 1). Each patient was age and gender matched with a healthy control subject and patients having double-sided occlusion were matched with two healthy controls leading up to a total of 14 included healty volunteers. The inclusion criteria for the healthy volunteers were no history of cerebrovascular disease and no evidence of steno-occlusive disease of the brain-feeding arteries on MR angiography scans. The mean age of the 14 healthy volunteers (12 males) was 66±4 years.
Table 1. Baseline characteristics of the patients with ICA occlusion.
| Occlusion patients (N=11) | |
|---|---|
| Age | |
| Mean±s.d. | 66±7 |
| Male | 10 |
| Occlusion | |
| RICA | 4 |
| LICA | 4 |
| Double-sided | 3 |
| Previous symptoms | |
| Stroke | 4 |
| TIA | 9 |
| Amaurosis fugax | 6 |
| Time since last symptoms | |
| Mean±sd | 9±4 years |
| Range | 1–17 years |
Abbreviations: double-sided, occlusion of both the RICA and LICA; LICA, left internal carotid artery; RICA, right internal carotid artery; s.d., standard deviation; TIA, transient ischemic attack.
This table shows baseline characteristics of all patients in who calibrated MRI could be performed.
Magnetic Resonance Imaging
Magnetic resonance imaging was performed on a Philips 3 tesla system using a quadrature body coil for transmission and an 8-channel receiver head coil (Achieva, Philips Medical Systems, Best, The Netherlands). The scan protocol consisted of a T1-weighted MP-RAGE (magnetization prepared rapid acquisition gradient echo), a T2-weighted fluid attenuation inversion recovery sequence, diffusion-weighted imaging, a sagittal and coronal 2D phase-contrast MR angiography, a tissue equilibrium magnetization map (M0 map), a tissue T1 map, a blood T1 map, and a dual-echo pseudocontinuous ASL (pCASL) sequence.16 Scan parameters of the pCASL sequence were as follows: TR (repetition time)/TE1 (echo time)/TE2: 4,000/13.79/36.25 ms, label duration: 1,650 ms, postlabel delay (PLD): 1,550 to 2,185 ms, field of view: 240 × 240 mm, voxel dimensions: 3 × 3 × 7 mm, slice gap: 1 mm, echo train length: 35, dynamics: 135, readout: multislice single-shot echo planar imaging, total scan duration: 18:30. The acquisition parameters of the M0 and the tissue T1 maps were identical to those used for the pCASL measurements, except that there was no spin labeling. Furthermore, a long TR of 8,000 ms was used for generating the M0 maps. For the blood T1 maps, a T1 inversion recovery sequence was used that consisted of a presaturation pulse followed by a single adiabatic inversion pulse and single-shot echo planar imaging as a readout.17 Scan parameters were TR/TE/ΔTI/TI1: 15 seconds/20 ms/150 ms/20 ms, 60 phases, scan matrix 128 × 128, field of view 240 × 240, flip angle 95º, slice thickness 3mm, and sense 2.5. The imaging plane of the blood T1 sequence was positioned perpendicular to the superior sagittal sinus based on the sagittal angiography image.
Respiratory Paradigm
End-tidal partial pressures of oxygen and carbon dioxide (EtO2 and EtCO2) were targeted using a computer controlled sequential gas delivery system (RespirAct, Thornhill Research Inc., ON, Toronto, Canada).18 The respiratory paradigm executed during the dual-echo pCASL sequence consisted of baseline breathing interleaved with two hypercapnic blocks of 105 seconds in which EtCO2 was targeted at 10 mm Hg above the individual subject baseline EtCO2 and one block of 180 seconds of hyperoxic breathing with a target of 300 mm Hg EtO2. Table 2 shows the EtO2 and EtCO2 values at baseline, at hypercapnic, and at hyperoxic breathing for the patients and the control subjects.
Table 2. End-tidal partial pressures.
| Occlusion patients | Healthy controls | |
|---|---|---|
| N | 11 | 14 |
| Male | 10 | 12 |
| Mean age±s.d. (in years) | 66±7 | 66±4 |
| EtO2 baseline (in mmHg) | 113±3 | 116±4 |
| EtCO2 baseline (in mmHg) | 34±3 | 35±3 |
| EtO2 hypercapnia (in mmHg) | 119±3 | 122±5 |
| EtCO2 hypercapnia (in mmHg) | 40±3 | 42±3 |
| ▵EtO2 hypercapnia (in mmHg) | 6±2 | 7±3 |
| ▵EtCO2 hypercapnia (in mmHg) | 6±1 | 7±2 |
| EtO2 hyperoxia (in mmHg) | 251±20 | 267±25 |
| EtCO2 hyperoxia (in mmHg) | 35±3 | 36±4 |
| ▵EtO2 hyperoxia (in mmHg) | 138±20 | 151±24 |
| ▵EtCO2 hyperoxia (in mmHg) | 0.5±0.7 | 0.5±0.9 |
Abbreviations: EtCO2, end-tidal partial pressure of carbon dioxide; EtO2, end-tidal partial pressure of oxygen; ▵EtCO2, difference in EtCO2 from hypercapnia or hyperoxia to baseline; ▵EtO2, difference in EtO2 from hypercapnia or hyperoxia to baseline; s.d., standard deviation.
This table shows the characteristics of the respiratory paradigm for the patients group and the healthy controls. The number of patients differs from the number of healthy controls as two healthy subjects were included for each patient with a double-sided occlusion.
Postprocessing
Postprocessing of the calibrated magnetic resonance imaging data
Data analysis was done using IDL 6.1 for Windows (ITT Visual Information Solutions, Boulder, CO, USA). First, coregistration of label and control images was performed on the first echo using an affine transformation. The resulting transformation matrix was then applied to the second echo data. Echo label and control images were then surround subtracted to create ΔM images.19 Data (ΔM images) obtained at baseline breathing, stable hypercapnic breathing, and stable hyperoxic breathing were averaged to create mean (baseline, hypercapnic, and hyperoxic) images. Perfusion was quantified on these ▵Mtotal images using the following formula:20
 |
where the T1b represents the T1 of arterial blood (1.65 seconds), λ is the blood-tissue water partition coefficient (0.98), IE is the inversion efficiency τ is the label duration (1,650 ms) and PLD is the postlabel delay (1,550 to 2,185 ms).20 The IE was put at 0.95 for the images obtained at baseline breathing and 0.84 for the images obtained during hypercapnic breathing.21
The BOLD signal time series was detrended to remove signal drift using a quadratic function to the baseline time points. Arterial spin labeling and BOLD CVR was determined by calculating the percent CBF and BOLD change and dividing these values by the magnitude of the individual's hypercapnic breathing challenge (ΔEtCO2) and then normalize this value to a change of 10 mm Hg ΔEtCO2.
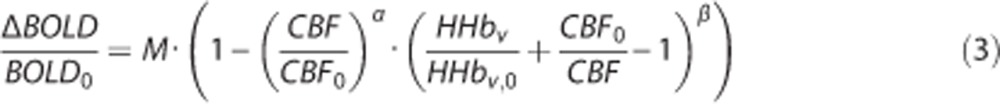
Next, a general BOLD signal model was used to calculate the OEF and CMRO2 maps; first, the theoretical maximum BOLD signal change (M), that would emerge with a complete removal of deoxyhemoglobin, was estimated using the hypercapnia calibration model:13
 |
where BOLD0, CMRO2,0, and CBF0 represent baseline values. Corresponding variables without subscripts represent the values calculated from the images obtained during hypercapnic breathing. β was set at 1.3 corresponding to a field strength of 3.0 tesla22 while α (the Grubb coefficient) was set at 0.23.23
Next, relative changes in deoxyhaemoglobin (HHb) concentration were calculated using the hyperoxia calibration model proposed by Chiarelli et al22 defined below:
 |
Using equations 2 and 3, the OEF can be estimated from both the hypercapnia and hyperoxia ASL and BOLD data using the framework proposed by Bulte et al.13 and which is described in details in Appendix A of their paper. Finally, CMRO2 was calculated from OEF0 and CBF0:23
where Ca is a constant representing the concentration of oxygen molecules per unit volume of blood (Ca=833.7 μmol O2/100 mL blood).24
Postprocessing of the blood T1 data
The data of the blood T1 sequence were analyzed to investigate the validity of the assumed T1b value. First, automatic localization of the sagittal sinus was performed on the magnitude reconstructed data. This automatic detection was based on the fact that at later time points the inflowing blood signal in the sagittal sinus is high (fully recovered) while the surrounding ‘static' tissue is suppressed by the repeated acquisition at high flip angle.25 Next, the inversion recovery curve obtained from within the sagittal sinus was used to derive the T1b using a standard two parameter inversion recovery model;17
 |
With S(t) being the signal over time, M0 is the magnetization, t is the time, and T1 is the longitudinal relaxation.
The calculation of the OEF13 and the CMRO2 (through the OEF and the Ca) rely on an assumed hemoglobin level of 15 g Hb per dL blood and a hematocrit value of 44%.24 To evaluate the validity of this assumption, and to investigate potential differences within this parameter in between the patients and the controls, we estimated the hematocrit based on the T1b using the following equation.17
 |
With a=0.50 and b=0.7.17
Data Analysis
Data analysis of the processed calibrated MRI data was performed using FMRIB Software Library (FSL, FMRIB, Oxford, UK). For this, brain tissue voxels of the MP-RAGE images were isolated using the brain extraction tool.26 The T1 maps were then coregistered to the brain-extracted MP-RAGE and next to the Montreal Neurological Institute (MNI) standard space (2 mm isotropic)27 using affine (FMRIB's Linear Image Registration Tool),28 and nonlinear (FMRIB's Non-linear Image Registration tool)29 transformations. The resulting transformation matrices of these coregistrations were then applied to the hemodynamic parameter maps (CBF, ASL CVR, BOLD CVR, OEF, and CMRO2 maps). The region of interest was the gray matter of the middle cerebral artery (MCA) territory and it was extracted in all subjects based on an in-house perfusion territory template. This template was based on the perfusion territories of healthy subjects as detected by territorial selective arterial spin labeling imaging.30
Statistical Analysis
IBM SPSS statistics (version 19.0.1., SPSS Inc., Chicago, IL, USA) were used for statistical analysis. Before statistical analysis, the presence of delayed arrival artifacts (DAAs) on the ASL maps was scored by two readers in a consensus meeting. Delayed arrival artifact was scored positive when the following two signs were present. Sign one, part of the brain tissue did not receive inflow signal at the time of readout, and this part of the brain did not show any signs of ischemia on conventional MR images. Sign two, the labeled signal was still present in the vasculature at the time of readout. Hereafter, statistical analysis was performed both including and excluding the subjects with DAAs. For this analysis and for the values shown, it is important to realize that for each individual subject, the BOLD CVR and ASL CVR was normalized to the BOLD signal change and the percentage perfusion change that would occur as a response to a hypercapnic stimulus of 10 mm Hg. A P value lower than 0.05 was considered as statistically significant.
Values of the hemodynamic parameters obtained in the gray matter of the ipsilateral MCA territory of patients (ipsilateral to the occluded vessel) were compared with values obtained in healthy controls using Student's t-tests. Paired Student's t-tests were used to compare the values of the hemodynamic parameters measured in the gray matter of the MCA territories ipsilateral to the ICA occlusion with the values of the hemodynamic parameters measured in the gray matter of the MCA territories contralateral to the ICA occlusion.
The mean T1b for all subjects, for all occlusion subjects, and for all healthy controls was calculated and the difference in mean T1b between the occlusion subjects and the healthy controls was evaluated by means of an independent Student's t-test. Similarly, the mean hematocrit was calculated and the mean hematocrit in the occlusion subjects was compared with the mean hematocrit of the healthy controls.
Simulations
The effect of errors in the input estimates
As the calibrated BOLD model relies on relative BOLD and ASL signal changes induced by hypercapnic and hyperoxic breathing challenges, any potential error within the measurements propagates throughout the model and induces errors in the resulting OEF and CMRO2 estimates. A simulation was performed to estimate the effect of these errors on the OEF. For this, the α was assumed to be 0.23, the β was set at 1.3, the hemoglobin (Hb) at 15.0, the relative change in CMRO2 as a result of hypercapnic breathing (ΔCMRO2) was put at 0.9, and the ratio between the arterial to venous oxygen concentration difference (Ca,O2-Cv,O2) before and during hyperoxia breathing (ΔCaCv) was considered to be 1.0. The baseline CBF was set at 50 mL/100 g per minute and the CBF at hypercapnia (CBFCO2) and hyperoxia (CBFO2) breathing was put at 65 and 48 mL/100 g per minute, respectively. The bold signal change (ΔBOLD) from baseline to hypercapnia (ΔBOLDCO2) was set at 3%, and the ▵BOLD from baseline to hyperoxia (ΔBOLDO2) was set at 1%. The combination of these values resulted in an OEF of 34%. Next, input errors ranging from −5 to +5% for the CBF and BOLD values were taken and the effect of these errors on the OEF was evaluated.
The effect of errors in the assumptions
The data analysis performed in this study assumes that the same calibrated BOLD model can be applied in healthy subjects (with healthy brain tissue) as in patients with cerebrovascular disease who may have diseased brain tissue. However, in patients, the hematocrit and hemoglobin level might be different, the blood-brain barrier might be damaged, the relation between the CBF and the CBV may have changed and the neurovascular coupling can be different when compared with healthy controls. Potential hemodynamic changes due to disease would manifest, in the calibrated BOLD model, as changes in the assumed α, β, Hb, ▵CMRO2, or ▵CaCv parameters. Therefore, we simulated the potential effect caused by disease-related changes within these parameters on the estimated OEF, by varying α, β, Hb, ΔCMRO2, and ΔCaCv while keeping the CBF and BOLD data constant.
Results
The Success Rate of the Hemodynamic Measurements and Patient Examples
Delayed arrival artifacts were apparent in the perfusion maps of three out of eleven patients. These artifacts propagated to the respective OEF and CMRO2 maps and analyses were performed including and excluding these patients.
Mean hemodynamic parameter maps were created. Figure 1A shows the mean maps of all subjects without DAA (left hemisphere) and the mean maps of their corresponding controls (right hemisphere). Figure 1B shows the mean maps of all subjects with DAA (left hemisphere) and the mean maps of their corresponding controls (right hemisphere).
Figure 1.

Hemodynamic maps. (A) Mean maps of all patients (P) without delayed arrival artifacts (DAAs) are shown (left hemisphere), mean maps of their corresponding controls (C, right hemisphere). (B) Mean maps of the patients with DAA (P, left hemisphere) and their corresponding controls (C, right hemisphere). Delayed arrival artifacts are visible on the ASL images of the patients with DAA and this propagates to the OEF and CMRO2 maps. Note that the images of the control subjects of the patients with DAA (B, right hemispheres) seem to have higher values compared with the control subjects of the patients without DAA (A, right hemispheres). We hypothesize this to be caused by the fact that the right hemisphere in (B) shows the mean image of three controls while the right hemisphere in (A) shows the mean image of 11 controls which decreases the amount of variation on which the mean perfusion images are based. BOLD CVR, blood oxygen level-dependent cerebrovascular reactivity (% per 10 mm Hg ▵EtCO2); CBF, cerebral blood flow (in mL/100 g per minute); CBF-HC, cerebral blood flow during hypercapnia (in mL/100 g per minute); CMRO2, cerebral metabolic rate of oxygen (in μmol/100 g per minute); OEF, oxygen extraction fraction (in %).
One 54-year-old male patient with a right-sided ICA occlusion showed increased OEF in both MCA territories. This patient had a TIA, a minor stroke, and amaurosis fugax in the clinical history, but was asymptomatic at the time of MRI for over 7 years. Quantitative data of the ipsilateral and contralateral MCA territory of this patient along with corresponding quantitative hemodynamic maps are shown in Figure 2A. In Figure 2B, quantitative data and hemodynamic maps of a 70-year-old male subject with bilateral occlusion of the internal carotid arteries are shown. This patient had a TIA and amaurosis fugax in the clinical history, but was asymptomatic at the time of MRI for over 10 years. In this patient, we found the OEF to be higher and the CMRO2 to be lower in the gray matter of the left MCA territory compared to the gray matter of the right MCA territory, which may suggest that the left MCA territory is more vulnerable to future ischemic events.31
Figure 2.

Patient example. (A) Example images and quantitative data of a 54-year-old male patient with a right-sided internal carotid artery (ICA) occlusion. The oxygen extraction fraction is increased in the gray matter of both MCA territories and the ability of the vasculature to modulate its tone in response to a hypercapnic stimulus (ASL CVR) is exhausted in both hemispheres. (B) Example images and quantitative data of a 70-year-old male patient with a bilateral ICA occlusion. The OEF is higher and the CMRO2 are lower in the gray matter of the left compared with the right MCA territory. ASL CVR, arterial spin labeling cerebrovascular reactivity; BOLD, blood oxygenation level-dependent; CBF, cerebral blood flow; CMRO2, cerebral metabolic rate of oxygen; MCA, middle cerebral artery; OEF, oxygen extraction fraction.
Patients Versus Healthy Control Subjects
In the 11 patients with either one-sided or double-sided ICA occlusion, there were 14 MCA territories with an ipsilateral occluded ICA. Of these 14 MCA territories and 3 MCA territories showed DAA. The remaining 11 MCA territories (no DAA) were compared with a matched MCA territory of a healthy control subject. Mean BOLD CVR in the gray matter of the ipsilateral patient MCA territories was significantly lower than in the controls (1.3±0.8% versus 2.2±0.4% per 10 mm Hg ΔEtCO2). No significant differences in baseline CBF (34±5 versus 36±11 mL/100 g per minute), ASL CVR (44±20% versus 54±10% per 10 mm Hg ▵EtCO2), OEF (41±8% versus 38±6%) or CMRO2 (116±39 versus 111±40 μmol/100 g per minute) were found between the patients and the controls (Table 3).
Table 3. Hemodynamic parameters in patients versus healthy controls.
| Patients (without DAA) | Controls | P-value | |
|---|---|---|---|
| MCA | |||
| N | 11 | 11 | |
| CBF (mL/100 g/min) | 34±5 | 36±11 | Ns |
| ASL CVR (%/10 mm Hg ▵EtCO2) | 44±20 | 53±10 | Ns |
| BOLD CVR (%/10 mm Hg ▵EtCO2) | 1.3±0.8 | 2.2±0.4 | <0.01 |
| OEF (%) | 41±8 | 38±6 | Ns |
| CMRO2 (μmol/100 g/min) | 116±39 | 111±40 | Ns |
| Patients (with and without DAA) | Controls | P-value | |
| MCA | |||
| N | 14 | 14 | |
| CBF (mL/100 g/min) | 32±6 | 38±12 | Ns |
| ASL CVR (%/10 mm Hg ▵EtCO2) | 45±18 | 52±10 | Ns |
| BOLD CVR (%/10 mm Hg ▵EtCO2) | 1.2±0.7 | 2.2±0.4 | <0.001 |
| OEF (%) | 39±8 | 39±6 | Ns |
| CMRO2 (μmol/100 g/min) | 106±39 | 120±47 | Ns |
Abbreviations: ASL CVR, arterial spin labeling cerebrovascular reactivity; BOLD, blood oxygenation level-dependent; CBF, cerebral blood flow; CMRO2, cerebral metabolic rate of oxygen; DAAs, delayed arrival artifacts; MCA, middle cerebral artery; OEF, oxygen extraction fraction.
Results obtained in patients versus controls (mean±s.d.) for the MCA territory (gray matter). Analysis was performed excluding and including patients with DAAs. P-values are shown in the table.
When the patients showing DAA were included in the analysis, 14 MCA territories of patients could be compared with 14 MCA territories of healthy matched controls. Mean BOLD CVR was significantly lower in the gray mater of the ipsilateral MCA territories of the patient group (1.2±0.7% versus 2.2±0.4% per 10 mm Hg ▵EtCO2). No differences were found in CBF (32±6 versus 38±12 mL/100 g per minute), ASL CVR (45±18 versus 52±10% per 10 mm Hg ▵EtCO2), OEF (39±9% versus 39±6%), or CMRO2 (106±39 versus 120±47 μmol/100 g per minute) (Table 3).
Ipsilateral Versus Contralateral Middle Cerebral Artery Territory in Patients
Eight patients had a one-sided occlusion (Table 1). Of these eight patients, five patients did not show DAA. When comparing the gray matter of the ipsilateral with the gray matter of the contralateral MCA territory of these five patients, BOLD CVR was significantly lower in the ipsilateral versus contralateral MCA territories (1.2±0.6% and 1.6±0.5% per 10 mm Hg ▵EtCO2, see Table 3). No significant differences in CBF (34±4 versus 39±7 mL/100 g per minute), ASL CVR (44±17% versus 47±20% per 10 mm Hg ▵EtCO2), OEF (44±10% versus 48±13%), or CMRO2 (130±48 versus 168±78 μmol/100 g per minute) were found between either territories (Table 4).
Table 4. Ipsilateral MCA territory versus contralateral MCA territory.
| Patients without DAA | iMCA | cMCA | P-value |
|---|---|---|---|
| N | 5 | 5 | |
| CBF (mL/100 g per minute) | 34±4 | 39±7 | Ns |
| ASL CVR (% per 10 mm Hg ▵EtCO2) | 44±17 | 47±20 | Ns |
| BOLD CVR (% per 10 mm Hg ▵EtCO2) | 1.2±0.6 | 1.6±0.5 | <0.05 |
| OEF (%) | 44±10 | 48±13 | Ns |
| CMRO2 (μmol/100 g per minute) | 130±48 | 168±78 | Ns |
| Patients with and without DAA | iMCA | cMCA | P-value |
|---|---|---|---|
| N | 8 | 8 | |
| CBF (mL/100 g per minute) | 32±6 | 42±8 | <0.05 |
| ASL CVR (% per 10 mm Hg ▵EtCO2) | 45±13 | 55±20 | Ns |
| BOLD CVR (% per 10 mm Hg ▵EtCO2) | 1±0.5 | 1.8±0.7 | <0.05 |
| OEF (%) | 39±10 | 45±11 | <0.05 |
| CMRO2 (μmol/100 g per minute) | 108±48 | 161±60 | <0.01 |
Abbreviations: ASL CVR, arterial spin labeling cerebrovascular reactivity; BOLD CVR, blood oxygen level-dependent CVR; CBF, cerebral blood flow; cMCA, contralateral MCA territory; CMRO2, cerebral metabolic rate of oxygen; iMCA, ipsilateral middle cerebral artery territory (ipsilateral to side of ICA occlusion); OEF, oxygen extraction fraction.
Hemodynamic parameters measured in the gray matter of the ipsilateral MCA territory and in the gray matter of the contralateral MCA territory of patients, only patients with one-sided occlusion were taken into account and analysis was performed excluding and including patients with DAAs. P-values are shown in the table.
When including the patients with DAA, eight ipsilateral MCA territories could be compared with their contralateral counterparts. Cerebral blood flow (32±6 versus 42±8 mL/100 g per minute), BOLD CVR (01±0.5% versus 1.8±0.7% per 10 mm Hg ▵EtCO2), OEF (39±10% versus 45±11%) and CMRO2 (108±48 versus 162±60 μmol/100 g per minute) were significantly lower in the ipsilateral than in the contralateral MCA territory (Table 4). There was no difference in ASL CVR between the ipsilateral and contralateral MCA territory (45±13% versus 55±20% per 10 mm Hg ▵EtCO2).
Reliability of Assumptions and Simulations
Data of the blood T1 sequence could not be fitted in one occlusion subject and in one healthy control, thus, the T1b and the hematocrit could only be measured and estimated in 23 out of 25 subjects. The overall mean T1b was 1.64 seconds (±0.17) and the overall mean hematocrit was 48% (±13%). The mean T1b in the occlusion subjects was 1.65 (±0.15) seconds and 1.64 (±0.07) seconds in the healthy controls. This was not significantly different. The mean hematocrit was 47% (±11) in the occlusion subjects and 48% (±5) in the healthy controls, this was also not significantly different.
In Figure 3A, the OEF error induced by errors in the measured CBF and BOLD data is shown. From this figure, it can be seen that small errors within the CBF measurements performed at hyperoxia level, potentially can cause large errors in the order of 50% on the OEF estimate. In Figure 3B, the effect of errors in α, β, Hb, ΔCMRO2, and ΔCaCv on OEF is shown. From this figure, it can be seen that all parameters (except β) can induce errors in the OEF.
Figure 3.

(A) Demonstration of the error in the OEF estimate introduced by errors in the CBF and ΔBOLD measurements performed at hypercapnia and hyperoxia breathing level. (B) Demonstration of the OEF error introduced by errors in the α, β, ΔCMRO2, and the ΔCaCv. CBFCO2, cerebral blood flow measured at hypercapnia breathing; CBFO2, CBF measured at hyperoxia breathing; ΔBOLDCO2, change in blood oxygenation level-dependent signal change from baseline to hypercapnia breathing; ΔBOLDO2, change in BOLD signal change from baseline to hyperoxia breathing; OEF, oxygen extraction fraction; ΔCMRO2, the relative change in the CMRO2 as a result of hypercapnia breathing; ΔCaCv, the ratio between the arterial to venous concentration of oxygen before and during hyperoxia breathing.
Discussion
We set out to investigate whether calibrated MRI can detect variances in hemodynamic parameters caused by vascular disease. This information could potentially be used in the future to evaluate the risk of stroke recurrence or effectiveness of new drug therapies. One of our patients did in fact show increased OEF corresponding to misery perfusion, which supports the feasibility of calibrated MRI to detect variations in hemodynamic parameters. When performing group analysis, we found a significantly lower BOLD CVR in the gray matter of the ipsilateral MCA territory of patients with cerebrovascular occlusive disease as compared with their contralateral MCA territory. We observed a significantly lower BOLD CVR in the gray matter of the ipsilateral MCA territory of patients compared with the healthy controls. Thus, we showed that calibrated MRI can identify regional differences in quantitative hemodynamic parameters, which can be related to vascular disease. However, the success rate of calibrated MRI in the clinical patients was limited due to anxiety in more than 10% of the patients and due to the presence of DAAs of the pASL perfusion method in 27% of the patients.
A Comparison to Literature Values Obtained by Arterial Spin Labeling and Blood Oxygen Level-Dependent Magnetic Resonance Imaging
To the best of our knowledge calibrated MRI has not been used to investigate hemodynamic changes related to vascular disease. Arterial spin labeling and BOLD MRI have been used separately to evaluate the CBF and the CVR. Previous studies showed that baseline whole brain CBF was decreased in symptomatic patients with a high-grade arterial stenosis compared with healthy controls (42.3 versus 55.7 mL/100 g per minute).32 We could not confirm this, possibly due to our selection of patients having a long asymptomatic period. This is in agreement with an earlier study which confirmed that patients with a normal CBF have a good prognosis independent of their CVR.33 Similar to an earlier study, we found slightly lower (but not significant) ASL CVR in the gray matter of the ipsilateral MCA territory (44% per 10 mm Hg ▵EtCO2) compared with the gray matter of the contralateral MCA territory (47% per 10 mm Hg ▵EtCO2). Bokkers et al34 examined the ASL CVR in response to acetazolamide in patients with a symptomatic occlusion and found it to be 13.5% in the ipsilateral ICA territory and 26.2% in the contralateral ICA territory. Mandell et al35 evaluated both BOLD and ASL CVR in response to hypercapnia in patients with cerebrovascular disease.35 They found BOLD CVR to be 2.0% and 2.8% per 10 mm Hg ▵EtCO2 in the ipsilateral and contralateral hemisphere of the patients with one-sided occlusion. In the same patients, ASL CVR was 33% per 10 mm Hg ▵EtCO2 in the ipsilateral hemisphere and 52% per 10 mm Hg ▵EtCO2 in the contralateral hemisphere. In our patients, BOLD CVR was 1.2% and 1.6% per 10 mm Hg ▵EtCO2 in the ipsilateral and contralateral MCA territory, respectively, and ASL CVR was 44% and 47% per 10 mm Hg ▵EtCO2.
A Comparison to Literature Values Obtained by Positron Emission Tomography
The gold standard to evaluate the brain's hemodynamic parameters (CBF, CVR, OEF, and CMRO2) is PET. Yamauchi et al36 demonstrated a mean OEF of 43% in healthy subjects using PET. This value is very similar to the OEF value that we found in the contralateral MCA territory (48%). We only found misery perfusion (a low CBF with an increased OEF (> 53.3%)36) in one of our patients. This phenomenon is known to be related to an increased 1 year incidence of ipsilateral ischemic stroke.36 Thus far, 9 months after imaging, this patient did not experience a new ischemic event. The absence of misery perfusion in our other patients matches well with their asymptomatic status (being asymptomatic for 9 years on average). Contrary to increased OEF we actually found a trend toward lower OEF in the gray matter of the ipsilateral MCA territory compared with the contralateral (44% and 48%, respectively). An earlier study performed by Baron et al37 showed lower CMRO2 in the ipsilateral hemisphere (115 μmol/100 g per minute) than in the contralateral hemisphere (149 μmol/100 g per minute).37 Although our values were comparable (130 and 168 μmol/100 g per minute), this difference was not significant, possibly due to our rather low sample size.
Patients Versus Controls
Interestingly, when comparing quantitative hemodynamic measurements in the gray matter of the ipsilateral MCA territory of the patients with the values measured in the MCA territory of the healthy controls we only found a significant difference in BOLD CVR. No differences in baseline CBF, ASL CVR, OEF, or CMRO2 were found. This may have been caused by the large intersubject variability in CBF, OEF, and CMRO238, 39 measurements and our relatively small sample size. For instance, the study performed by Coles et al38 showed intersubject coefficients of variation of 13.5%, 7.3%, and 12.8% for CBF, OEF, and CMRO2, respectively, and Parkes et al39 found an intersubject variation of up to 100% perfusion difference. The BOLD CVR and the ASL CVR are least sensitive to intersubject variations as they are expressed as percentage changes from the subject's baseline. These two parameters should thus be best suited to identify differences in between patients and healthy controls. We did in fact found significant BOLD CVR differences in between patients and control subjects. However, we did not identify significant differences in ASL CVR. This could be caused by the low signal-to-noise ratio of ASL imaging compared with BOLD imaging.40 In any case, the fact, that BOLD CVR showed a significant difference while the other parameters did not, supports earlier studies who proposed BOLD CVR for evaluating the cerebrovascular reserve capacity.41 The advantage of BOLD CVR over calibrated MRI lies in the fact that it only requires a BOLD sequence and a single block paradigm. Although, in this respect, we should also mention that the data of an earlier study performed by Mandell et al35 demonstrated the exact opposite. They found a significant lower ASL CVR in the ipsilateral hemisphere compared with the contralateral hemisphere (2.88 versus 5.36%▵CBF/mm▵PetCO2, P<0.005) of patients with unilateral steno-occlusive disease, but did not detect significant differences in BOLD CVR (0.41 versus 0.31%▵BOLD/mm▵PetCO2, P=0.674). However, we should keep in mind that this study used a pulsed ASL sequence with an inversion time of 1,000 ms that may have been too early to actually measure perfusion signal, specifically in patients with cerebrovascular disease.
Reliability of the Assumptions and Errors Introduced by the Assumptions
When processing calibrated MRI data a number of assumptions are adopted. In this study, we evaluated the validity of two assumptions; the T1 of blood that is considered to be 1.65 seconds and the hematocrit that is assumed to be 44% and equal in patients and controls. We found a mean (venous) T1 of blood of 1.64 seconds, which is very close to the assumed (arterial) T1 of blood of 1.65 seconds. The calibrated MRI model assumes a hematocrit value of 44%, in good agreement with our estimated hematocrit of 48% based on the T1 of blood measurements. Most importantly, we did not find significant differences in hematocrit values between the patients and the controls so potential deviations would be similar in both groups. Although we did not find any differences in hematocrit, future studies involving patients should be careful when assuming an equal hematocrit specifically studies concerning acutely ill subjects as administered drugs may influence hematocrit. In patients with cerebrovascular disease, there are a number of vascular- and perfusion-related properties that can change. For instance, the vascular compliance may be different causing a change in the CBF versus CBV relationship and would thus change the Grubb coefficient, or the OEF may differ from healthy subjects. Although we did not investigate these parameters in our subjects, we simulated the effect of errors within these parameters on our obtained data. These simulations showed that errors within all of these parameters could have an influence on the estimated OEF. In our study, these possible errors could have masked a difference in OEF between healthy controls and patients with cerebrovascular disease. Thus, future research should investigate potential errors made in the OEF estimate due to changes in the assumed parameters caused by cerebrovascular disease, for instance by comparing with O15-PET. Or, when new studies are set up, the sample size should take the standard deviation that we found into account together with the estimated errors. Apart from the effect of these errors, we also demonstrated that an error in the CBF measurements performed at hyperoxia level induces the most error in the OEF estimate. As such it could be wise to increase the number of ASL dynamics made at hyperoxia level to increase the signal-to-noise ratio and thus decrease the potential error in the CBF measurement.
Limitations
In our patient group, 2 out of 15 patients experienced anxiety during hypercapnic breathing and the MRI measurements had to be stopped. This anxiety occurred despite a test run with hypercapnic breathing. We hypothesize this anxiety to be caused by both the hypercapnic breathing itself, but as well by our means of delivering the hypercapnic gas. The system we used is very good at creating complex breathing paradigms but it requires the breathing mask to be sealed to the subjects face and it makes use of a rebreathing phase. These two things create some resistance to breathing that may induce anxiety in some subjects. Future studies could try to make use of another system and can try to minimize anxiety by adapting the respiratory paradigm. For instance, the change in EtCO2 from baseline to hypercapnia can be attenuated. However, lower concentrations of CO2 will also decrease the strength of the effect on which the calibrated BOLD experiments are based.42 Alternatively, the hypercapnia period can be shortened as a recent study demonstrated that a 1-minute paradigm performed equally well as a 4-minute paradigm and at the same time was more comfortable and tolerable for the subjects.43 Nevertheless, care should be taken as it has been shown that BOLD changes have a delayed response with respect to changes in EtCO2.43 In addition, one has to secure enough ASL signal averages to obtain sufficient signal-to-noise ratio.
A second limitation is delayed arrival that presents itself as ASL label still present in the arterial vasculature instead of the tissue. This is a known problem of ASL imaging in patients with collateral supply 44 and was seen in 3 out of the 11 patients. In calibrated MRI, DAAs propagate from the CBF to the OEF and CMRO2 maps and therefore preclude analysis of the OEF and the CMRO2 data. When the presence of delayed arrival is not recognized, this would lead to a falsely reduced CMRO2 via the incorrect (lower) measured CBF. The DAAs can potentially be reduced by increasing the PLD, or by using a separate multiple inversion times (multi-TI) sequence to obtain the ‘true' CBF value.45 In this study, we used a PLD ranging from 1,550 to 2,185 ms. This is in line with the PLD recently recommended by the ASL community.20 However, we should keep in mind that transit times can be up to 2.5 seconds or even longer in patients with collateral blood supply.44 It is not preferable to increase the PLD even more as there is a concurrent decrease in signal-to-noise ratio.46 This would be in particular problematic with regards to obtaining a reliable CBF estimate during hyperoxia as we showed that an error within this measurement jeopardizes the accuracy of the OEF estimate the most (Figure 3A).
A promising alternative for CBF measurements in patients with large vessel disease is the velocity selective ASL method,47 which is insensitive to transit times. Although the general signal-to-noise ratio is lower than in pCASL, due to the saturation rather than the inversion of blood, it has the advantage that the labeling takes place within the imaging region and therefore the PLD can be reduced at the same time reducing the bolus decay.20
Conclusion
Calibrated MRI performed in patients with occlusive cerebrovascular disease can identify variances in CBF, CVR, OEF, and CMRO2. Thus, this noninvasive technique can potentially be used to identify patients at risk for recurrent stroke and to evaluate the effect of new drug therapies on cerebral hemodynamics.
The authors declare no conflict of interest.
Footnotes
This research is supported by the Dutch Technology Foundation STW (grant number: 11047), applied science division of NWO, the technology program of the ministry of economic affairs and the ZonMW electromagnetic fields and health program (grant numbers: 5300005 and 16126322).
References
- 1Derdeyn CP, Videen TO, Yundt KD, Fritsch SM, Carpenter DA, Grubb RL et al. Variability of cerebral blood volume and oxygen extraction: stages of cerebral haemodynamic impairment revisited. Brain 2002; 125: 595–607. [DOI] [PubMed] [Google Scholar]
- 2MacKenzie ET, Farrar JK, Fitch W, Graham DI, Gregory PC, Harper AM. Effects of hemorrhagic hypotension on the cerebral circulation. I. Cerebral blood flow and pial arteriolar caliber. Stroke 1979; 10: 711–718. [DOI] [PubMed] [Google Scholar]
- 3Powers WJ, Grubb RL, Darriet D, Raichle ME. Cerebral blood flow and cerebral metabolic rate of oxygen requirements for cerebral function and viability in humans. J Cereb Blood Flow Metab 1985; 5: 600–608. [DOI] [PubMed] [Google Scholar]
- 4Vernieri F, Pasqualetti P, Passarelli F, Rossini PM, Silvestrini M. Outcome of carotid artery occlusion is predicted by cerebrovascular reactivity. Stroke 1999; 30: 593–598. [DOI] [PubMed] [Google Scholar]
- 5Yonas H, Smith HA, Durham SR, Pentheny SL, Johnson DW. Increased stroke risk predicted by compromised cerebral blood flow reactivity. J Neurosurg 1993; 79: 483–489. [DOI] [PubMed] [Google Scholar]
- 6Yamauchi H, Fukuyama H, Nagahama Y, Nabatame H, Ueno M, Nishizawa S et al. Significance of increased oxygen extraction fraction in five-year prognosis of major cerebral arterial occlusive diseases. J Nucl Med 1999; 40: 1992–1998. [PubMed] [Google Scholar]
- 7Hokari M, Kuroda S, Shiga T, Nakayama N, Tamaki N, Iwasaki Y. Impact of oxygen extraction fraction on long-term prognosis in patients with reduced blood flow and vasoreactivity because of occlusive carotid artery disease. Surg Neurol 2009; 71: 532–538. [DOI] [PubMed] [Google Scholar]
- 8Mintun MA, Raichle ME, Martin WR, Herscovitch P. Brain oxygen utilization measured with O-15 radiotracers and positron emission tomography. J Nucl Med 1984; 25: 177–187. [PubMed] [Google Scholar]
- 9Ogawa S, Lee TM, Barrere B. The sensitivity of magnetic resonance image signals of a rat brain to changes in the cerebral venous blood oxygenation. Magn Reson Med 1993; 29: 205–210. [DOI] [PubMed] [Google Scholar]
- 10Williams DS, Detre JA, Leigh JS, Koretsky AP. Magnetic resonance imaging of perfusion using spin inversion of arterial water. Proc Natl Acad Sci U S A 1992; 89: 212–216. [DOI] [PMC free article] [PubMed] [Google Scholar]
- 11Kim SG, Tsekos NV, Ashe J. Multi-slice perfusion-based functional MRI using the FAIR technique: comparison of CBF and BOLD effects. NMR Biomed 1997; 10: 191–196. [DOI] [PubMed] [Google Scholar]
- 12Faraco CC, Strother MK, Dethrage LM, Jordan L, Singer R, Clemmons PF et al. Dual echo vessel-encoded ASL for simultaneous BOLD and CBF reactivity assessment in patients with ischemic cerebrovascular disease. Magn Reson Med 2014. doi:10.1002/mrm.25268e-pub ahead of print. [DOI] [PMC free article] [PubMed]
- 13Bulte DP, Kelly M, Germuska M, Xie J, Chappell MA, Okell TW et al. Quantitative measurement of cerebral physiology using respiratory-calibrated MRI. Neuroimage 2012; 60: 582–591. [DOI] [PMC free article] [PubMed] [Google Scholar]
- 14Chiarelli PA, Bulte DP, Gallichan D, Piechnik SK, Wise R, Jezzard P. Flow-metabolism coupling in human visual, motor, and supplementary motor areas assessed by magnetic resonance imaging. Magn Reson Med 2007; 57: 538–547. [DOI] [PubMed] [Google Scholar]
- 15Chen Y, Parrish TB. Caffeine's effects on cerebrovascular reactivity and coupling between cerebral blood flow and oxygen metabolism. Neuroimage 2009; 44: 647–652. [DOI] [PMC free article] [PubMed] [Google Scholar]
- 16Dai W, Garcia D, de Bazelaire C, Alsop DC. Continuous flow-driven inversion for arterial spin labeling using pulsed radio frequency and gradient fields. Magn Reson Med 2008; 60: 1488–1497. [DOI] [PMC free article] [PubMed] [Google Scholar]
- 17Varela M, Hajnal JV, Petersen ET, Golay X, Merchant N, Larkman DJ. A method for rapid in vivo measurement of blood T1. NMR in biomedicine 2011; 24: 80–88. [DOI] [PubMed] [Google Scholar]
- 18Slessarev M, Han J, Mardimae A, Prisman E, Preiss D, Volgyesi G et al. Prospective targeting and control of end-tidal CO2 and O2 concentrations. J Physiol 2007; 581: 1207–1219. [DOI] [PMC free article] [PubMed] [Google Scholar]
- 19Liu TT, Wong EC. A signal processing model for arterial spin labeling functional MRI. Neuroimage 2005; 24: 207–215. [DOI] [PubMed] [Google Scholar]
- 20Alsop DC, Detre JA, Golay X, Gunther M, Hendrikse J, Hernandez-Garcia L et al. Recommended implementation of arterial spin-labeled perfusion MRI for clinical applications: A consensus of the ISMRM perfusion study group and the European consortium for ASL in dementia. Magn ResonMed 2014. b doi:10.1002/mrm.25197e-pub ahead of print. [DOI] [PMC free article] [PubMed]
- 21Aslan S, Xu F, Wang PL, Uh J, Yezhuvath US, van Osch M, Lu H. Estimation of labeling efficiency in pseudocontinuous arterial spin labeling. Magn Reson Med 2010; 63: 765–771. [DOI] [PMC free article] [PubMed] [Google Scholar]
- 22Chiarelli PA, Bulte DP, Wise R, Gallichan D, Jezzard P. A calibration method for quantitative BOLD fMRI based on hyperoxia. Neuroimage 2007; 37: 808–820. [DOI] [PubMed] [Google Scholar]
- 23Chen JJ, Pike GB. BOLD-specific cerebral blood volume and blood flow changes during neuronal activation in humans. NMR Biomed 2009; 22: 1054–1062. [DOI] [PubMed] [Google Scholar]
- 24Xu F, Ge Y, Lu H. Noninvasive quantification of whole-brain cerebral metabolic rate of oxygen (CMRO2) by MRI. Magn Reson Med 2009; 62: 141–148. [DOI] [PMC free article] [PubMed] [Google Scholar]
- 25De Vis JB, Hendrikse J, Groenendaal F, de Vries LS, Kersbergen KJ, Benders MJ, Petersen ET. Impact of neonate haematocrit variability on the longitudinal relaxation time of blood: Implications for arterial spin labeling MRI. Neuroimage Clin 2014; 4: 517–525. [DOI] [PMC free article] [PubMed] [Google Scholar]
- 26Smith SM, Jenkinson M, Woolrich MW, Beckmann CF, Behrens TE, Johansen-Berg H et al. Advances in functional and structural MR image analysis and implementation as FSL. Neuroimage 2004; 23: S208–S219. [DOI] [PubMed] [Google Scholar]
- 27Mazziotta J, Toga A, Evans A, Fox P, Lancaster J, Zilles K et al. A probabilistic atlas and reference system for the human brain: International Consortium for Brain Mapping (ICBM). Philos Trans R Soc Lond B Biol Sci 2001; 356: 1293–1322. [DOI] [PMC free article] [PubMed] [Google Scholar]
- 28Jenkinson M, Smith S. A global optimisation method for robust affine registration of brain images. Med Image Anal 2001; 5: 143–156. [DOI] [PubMed] [Google Scholar]
- 29Andersson JLR, Jenkinson M, Smith S. Non-linear registration, aka spatial normalisation. FMRIB Technical Report 2010. TR07JA2.
- 30Hartkamp NS, Petersen ET, De Vis JB, Bokkers RP, Hendrikse J. Mapping of cerebral perfusion territories using territorial arterial spin labeling: techniques and clinical application. NMR Biomed 2013; 26: 901–912. [DOI] [PubMed] [Google Scholar]
- 31Reinhard M, Schwarzer G, Briel M, Altamura C, Palazzo P, King A et al. Cerebrovascular reactivity predicts stroke in high-grade carotid artery disease. Neurology 2014; 83: 1424–1431. [DOI] [PMC free article] [PubMed] [Google Scholar]
- 32Roc AC, Wang J, Ances BM, Liebeskind DS, Kasner SE, Detre JA. Altered hemodynamics and regional cerebral blood flow in patients with hemodynamically significant stenoses. Stroke 2006; 37: 382–387. [DOI] [PubMed] [Google Scholar]
- 33Isozaki M, Arai Y, Kudo T, Kiyono Y, Kobayashi M, Kubota T et al. Clinical implication and prognosis of normal baseline cerebral blood flow with impaired vascular reserve in patients with major cerebral artery occlusive disease. Ann Nucl Med 2010; 24: 371–377. [DOI] [PubMed] [Google Scholar]
- 34Bokkers RPH, van Osch MJP, Klijn CJM, Kappelle LJ, Hendrikse J. Cerebrovascular reactivity within perfusion territories in patients with an internal carotid artery occlusion. J Neurol Neurosurg Psychiatry 2011; 82: 1011–1016. [DOI] [PubMed] [Google Scholar]
- 35Mandell DM, Han JS, Poublanc J, Crawley AP, Stainsby JA, Fisher JA et al. Mapping cerebrovascular reactivity using blood oxygen level-dependent MRI in Patients with arterial steno-occlusive disease: comparison with arterial spin labeling MRI. Stroke 2008; 39: 2021–2028. [DOI] [PubMed] [Google Scholar]
- 36Yamauchi H, Fukuyama H, Nagahama Y, Nabatame H, Nakamura K, Yamamoto Y et al. Evidence of misery perfusion and risk for recurrent stroke in major cerebral arterial occlusive diseases from PET. J Neurol Neurosurg Psychiatry 1996; 61: 18–25. [DOI] [PMC free article] [PubMed] [Google Scholar]
- 37Baron JC, Rougemont D, Soussaline F, Bustany P, Crouzel C, Bousser MG et al. Local interrelationships of cerebral oxygen consumption and glucose utilization in normal subjects and in ischemic stroke patients: a positron tomography study. J Cereb Blood Flow Metab 1984; 4: 140–149. [DOI] [PubMed] [Google Scholar]
- 38Coles JP, Fryer TD, Bradley PG, Nortje J, Smielewski P, Rice K et al. Intersubject variability and reproducibility of 15O PET studies. J Cereb Blood Flow Metab 2006; 26: 48–57. [DOI] [PubMed] [Google Scholar]
- 39Parkes LM, Rashid W, Chard DT, Tofts PS. Normal cerebral perfusion measurements using arterial spin labeling: reproducibility, stability, and age and gender effects. Magn Reson Med 2004; 51: 736–743. [DOI] [PubMed] [Google Scholar]
- 40Gauthier CJ, Madjar C, Desjardins-Crepeau L, Bellec P, Bherer L, Hoge RD. Age dependence of hemodynamic response characteristics in human functional magnetic resonance imaging. Neurobiol Aging 2013; 34: 1469–1485. [DOI] [PubMed] [Google Scholar]
- 41Spano VR, Mandell DM, Poublanc J, Sam K, Battisti-Charbonney A, Pucci O et al. CO2 blood oxygen level-dependent MR mapping of cerebrovascular reserve in a clinical population: safety, tolerability, and technical feasibility. Radiology 2013; 266: 592–598. [DOI] [PubMed] [Google Scholar]
- 42Markus H, Cullinane M. Severely impaired cerebrovascular reactivity predicts stroke and TIA risk in patients with carotid artery stenosis and occlusion. Brain 2001; 124: 457–467. [DOI] [PubMed] [Google Scholar]
- 43Yezhuvath US, Lewis-Amezcua K, Varghese R, Xiao G, Lu H. On the assessment of cerebrovascular reactivity using hypercapnia BOLD MRI. NMR Biomed 2009; 22: 779–786. [DOI] [PMC free article] [PubMed] [Google Scholar]
- 44Bokkers RP, van Laar PJ, van de Ven KC, Kapelle LJ, Klijn CJ, Hendrikse J. Arterial spin-labeling MR imaging measurements of timing parameters in patients with a carotid artery occlusion. AJNR Am J Neuroradiol 2008; 29: 1698–1703. [DOI] [PMC free article] [PubMed] [Google Scholar]
- 45Kelly M, Hare H, Germuska M, Filippini N, Bulte D. Changes in cerebral physiology with ageing assessed by respiratory-calibrated MRI. Proc Intl Soc Mag ResonMed 2014; 22, p 0465. [Google Scholar]
- 46Wu B, Lou X, Wu X, Ma L. Intra- and interscanner reliability and reproducibility of 3D whole-brain pseudo-continuous arterial spin-labeling MR perfusion at 3 T. J Magn Reson Imaging 2014; 39: 402–409. [DOI] [PubMed] [Google Scholar]
- 47Wong EC, Cronin M, Wu W-C, Inglis B, Frank LR, Liu TT. Velocity-selective arterial spin labeling. Magn Reson Med 2006; 55: 1334–1341. [DOI] [PubMed] [Google Scholar]