

Abstract
C57BL/6 mice have more cerebral arterial branches and collaterals than BALB/c mice. We measured and compared blood flow dynamics of the middle cerebral artery (MCA) in these two strains, using noninvasive optical imaging with indocyanine green (ICG). Relative maximum fluorescence intensity (Imax) and the time needed for ICG to reach Imax in the MCA of C57BL/c were lower than that in BALB/c mice. Moreover, the mean transit time was significantly lower in C57BL/6 than in BALB/c mice. These data suggest that the higher number of arterial branches and collaterals in C57BL/6 mice yields a lower blood flow per cerebral artery.
Keywords: cerebral blood flow measurement, cerebral hemodynamics, imaging, middle cerebral artery, optical imaging
Introduction
BALB/c mice have more severe tissue damage, and take longer to recover from stroke than C57BL/6 mice.1, 2 These differences have been attributed to disparities in branch density and collateral interconnections of the cerebral vasculature.3 Anatomically, C57BL/6 mice have more collateral anastomoses than other mouse strains;4 however, there is little physiological data showing differences in cerebral blood flow (CBF) dynamics between BALB/c and C57BL/6 mice.
Measurement of CBF is important for the diagnosis and monitoring of vascular diseases. The fluorescent dye indocyanine green (ICG) can be used to measure CBF, and can significantly enhance the signal-to-noise ratio. Moreover, the kinetics of the ICG bolus can improve the detection of deep organs and tissue blood flow in experimental animals5, 6 and humans.7, 8 A recent study showed that near infrared imaging of ICG fluorescence, combined with a time-series analysis of its molecular dynamics, can be useful for CBF analysis.9
Thus, in the current study, we visualized blood flow in the cerebral arteries and venous sinuses using ICG-optical imaging, and measured several features of blood flow dynamics to assess CBF differences in cerebral arteries of BALB/c and C57BL/6 mice.
To the best of our knowledge, this is the first study showing differences in CBF in two mouse strains.
Materials and methods
Animal Preparation
Eight-week-old male BALB/c and C57BL/6 mice were obtained from Daehan Biolink (Gyeonggi-do, Republic of Korea). In these two mice strains, males have the same blood pressure.10 Animals were anesthetized with ketamine (0.1 mg/g wt) and xylazine (0.01 mg/g wt). We measured systemic physiologic parameters of blood relevant for resting CBF (Supplementary Information S1). Body temperatures were monitored by a rectal probe, and maintained at 37°C using a temperature-controlled heating pad (Harvard Apparatus, Holliston, MA, USA). All procedures were approved by the Institutional Animal Care and Use Committee of the Kyung Hee University. We performed all experimental procedures and handled experimental animals according to the ARRIVE guidelines (http://www.nc3rs.org.uk/ARRIVE).11
Indocyanine Green Imaging
Under anesthesia, an incision was made to expose the entire skull. Then, mice were placed under an 830-nm band-pass filter CCD camera. A solution (40 μL) of ICG (0.001 mg/g wt) was injected manually into the tail vein (the rate of injection: 80 μL/s) using a 31-gauge needle, and the head was illuminated with 760 nm wavelength lights. Time series of ICG fluorescence signal was acquired every 160 ms for 2 minutes. Using a customized software (Vieworks Co., Ltd., Anyang, Republic of Korea), the initial 100 frames were used to generate blood flow maps as previously reported by Ku et al.9
The Trising value was calculated as the time between Tarrival (time of first appearance of ICG fluorescence, i.e., arrival of the bolus) and Tmax (time of maximum intensity). The slope of the first peak in the time-intensity curve was used to calculate the blood flow index (BFI), dividing the relative fluorescence intensity at Tpeak (the first peak time) by Trising. Mean transit time (MTT) was calculated as the center of gravity of the dynamic curve.12 We used the signals during the 16 seconds period after T arrival for the calculation. After adjusting the baseline intensity to zero, the following equation was applied:
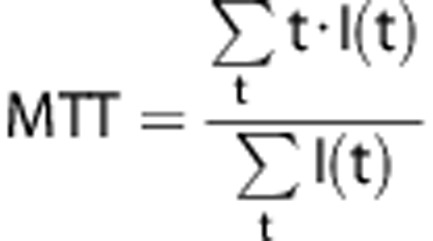 |
Statistical Analysis
Data are given as the mean±s.e.m. for n number of mice ((n=6) per strain) and were analyzed using Student's t-tests.
Results
Structural Differences in the Arterial Tree between BALB/c and C57BL/6 Mice
Two minutes after intravenous ICG injection, raw images were acquired and streamed to a computer. In the raw fluorescent image, blood vessels appeared as bright areas. We made a representative movie to show the kinetics of blood flow (Supplementary Information S2). From the serial images, we created a filtered time-series stack image, and noticed that the number of distal arterial branches appeared to differ between BALB/c and C57BL/6 mice during angiographic analyses (Figure 1A). Therefore, we measured the number of branching points from the middle cerebral artery (MCA) and anterior cerebral artery. After magnifying the image on the monitor, we delineated the arterial trees on the overlying layer. The vessels delineated in this image were analyzed using ImageJ and the Skeleton plugins (http://rsbweb.nih.gov/ij/). Our data showed that C57BL/6 mice had significantly more branching points (20.5±2.195) than BALB/c mice (10±1.065) (**P<0.05) (Figure 1B). See more details in Supplementary Information S3.
Figure 1.

Time-series stack image and single-pixel dynamics of two mouse strains. (A) Representative filtered time-series stack image of the cerebral arteries. There are fewer visible cerebral artery branches in BALB/c. (B) The number of cerebral artery branching points was significantly different between the two strains. Data represent the mean±s.e.m. (Student's t-test, **P<0.01). (C) Time-series image after tail vein injection of indocyanine green (ICG). Selected pixels are indicated by colored circles (pink and sky blue: first branching point of the middle cerebral artery (MCA); red and blue: superior sagittal sinus (SSS). (D) ICG dynamics of each pixel after the injection of an ICG bolus. (E) Interpolated dynamics were plotted, and Tarrival and Tmax (for the calculation of Trising) are indicated in the time axis. Imax is indicated on the fluorescence intensity axis. (F) Expanded graph showing the time window of interest (0 to 5 seconds) of (D). (G) Normalized graph of ICG dynamics at the first MCA branching point showing Tmax differences between the two strains (double-headed arrow). (H) Normalized graph of ICG dynamics at the SSS showing Tmax differences between the two strains (two arrows).
Analysis of Single-Pixel Indocyanine Green Dynamics in Cerebral Vessels and Comparison Between Strains
We selected one pixel in the first branching area of the MCA, and one in the superior sagittal sinus (SSS) (Figure 1C), in fluorescence images. Then, we examined the dynamics of each pixel (Figure 1D), which typically consisted of an initial peak followed by subsequent peaks produced by systemic recirculation (Figure 1E). Afterwards, we extracted a Trising value from the first peak as a representative parameter of the status of tissue blood supply. Trising was calculated by subtracting Tarrival from Tmax (Figure 1E). To identify differences in Tmax of each pixel, we reconfigured the ICG dynamics graph (Figure 1F) to show that each point had a different Tmax. We next normalized each dynamic value, and compared the Tmax between C57BL/6.MCA and BALB/c.MCA, and between C57BL/6.SSS and BALB/c.SSS. Using this approach, we determined that the MCA had a larger difference in Tmax than the SSS (Figures 1G and 1H). Thus, analysis of single-pixel dynamics showed a probable difference in CBF in the MCA and SSS between the two mice strains.
Blood Flow Feature Maps and Comparison Between Strains
To analyze statistical differences in CBF between BALB/c and C57BL/6 mice, we assessed blood flow features in the following regions of interest (ROIs; 0.5 mm diameter): the first MCA branching area (yellow circle) appearing on the lateral area of the parietal bones in both hemispheres, and two ROIs in the SSS (blue circles) around the junction with the cerebral veins (Figure 2A). Values for each blood flow feature (Trising, Imax, BFI, and MTT) were mapped onto the above-mentioned vascular brain regions (Figure 2B). These values were then calculated and compared in the MCA and SSS (Figure 2C). In Trising maps, the overall Trising value of the MCA in BALB/c mice (2.643±0.118) was larger than in C57BL/6 mice (2.146±0.057) (**P<0.01). This suggests that CBF takes longer to reach Imax in BALB/c than in C57BL/6 mice. In addition, the Imax value of the MCA in BALB/c mice (5,437.6±200.983) was higher than in C57BL/6 mice (4,052.9±173.559) (***P<0.001), suggesting that more blood flows in the MCAs of BALB/c than in C57BL/6 mice. The BFI was calculated by determining the change in intensity of the maximum value/Trising.9 Interestingly, BALB/c mice showed a tendency for slightly higher BFI, although BFI was not significantly different between the two strains (Figure 2C). The MTT was defined as the transition time after the bolus arrives at a region.9, 13 The MTT for the MCA in BALB/c mice (7.407±0.083) was larger than in C57BL/6 mice (7.164±0.041) (*P<0.05), suggesting that a bolus of ICG in the MCA of the BALB/c strain takes longer time to transit through the artery.
Figure 2.

Types of cerebral blood flow (CBF) maps, and comparison of CBF parameters in BALB/c and C57BL/6 mice. (A) Selected regions of interest (ROIs) are indicated by colored circles (yellow: first branching area of middle cerebral arteries (MCAs) in both hemispheres; sky blue: two randomly selected areas of the superior sagittal sinus (SSS)). (B) Representative CBF maps of the MCA and the SSS. The first branching area of the MCA and the SSS were selected from the high intensity area of the regions, and were processed using the image analysis program to create CBF maps of the selected area. Selected area maps were rearranged on the time-series stack image to indicate the location of each area in the MCA and the SSS. In each map, selected ROIs are indicated as yellow and blue circles, in the MCA and the SSS, respectively. (C) The averages of the blood flow parameters for each ROI were compared between mouse strains. Trising, Imax, and mean transit time (MTT) parameters showed significant differences in the MCA between the two mouse strains. Data represent the mean±s.e.m. (Student's t-test, *P<0.05; **P<0.01; ***P<0.001). BFI, blood flow index.
To evaluate CBF in the distal branches of the MCA and microvessels in cortical tissue, we delineated 2 mm diameter ROIs covering these areas on both hemispheres. The ROI centers were positioned 2 mm posterior and 2 mm lateral from bregma (Supplementary Information S4). Interestingly, Trising and Imax were significantly higher in the BALB/c mice; however, MTT and BFI were not significantly different between strains. Similar cortical values for BFI and MTT suggest that blood flow rate in the microvessels of the cortex is similar between the two strains.
Discussion
Although previous study reported that blood flow assessed by [14C]iodoantipyrine autoradiography in the lateral cortex (the MCA territory) was not significantly different between C57BL/6 and BALB/c,1 we hypothesized that differences in branch density and collaterals could lead to dissimilarities in CBF across mouse strains. To examine this hypothesis, we adopted a very sensitive optical imaging method using the near-infrared fluorescence dye ICG, combined with a time-series analysis of ICG molecular dynamics. There were differences in ICG dynamics between strains, which were successfully detected using four dynamic parameters (i.e., Trising, Imax, MTT, and BFI). To our knowledge, this is the first study examining differences in CBF between BALB/c and C57BL/6 mice.
Our study revealed that cerebral arterial branching and collaterals determined the values of the various CBF parameters. Thus, since cerebral arterial branching and collaterals differ across mouse strains, CBF parameters differ according to their genetic backgrounds. Single-pixel ICG dynamics in the vessels of the two strains revealed that differences in CBF could be analyzed statistically. Particularly, it was determined that Trising and Imax were higher in the MCA of BALB/c than in C57BL/6 mice. However, the BFI, or the slope of the first peak, did not differ significantly between strains. Consequently, the infusion rate of blood in the MCA was not significantly different between C57BL/6 and BALB/c mice. However, the elevated Imax in the MCA of BALB/c mice suggests that these mice have a larger volume of blood than C57BL/6 mice in a branch of the MCA. A possible explanation is that, during development, the number of second- and third-order branches is lower in BALB/c, while the diameter of second-order branches is larger,3 thus more blood may flow in a branch of the MCA in BALB/c mice. In addition, our data show that the MTT in the MCA of BALB/c mice was higher than in C57BL/6 mice. This could be explained by the fact that a higher volume of blood takes longer time to transit through an artery, and the C57BL/6 strain has more arterial branches and collaterals, which may imply shorter transit times for blood in the MCA.
In our study, C57BL/6 mice reached faster an ICG peak in the MCA, but the rate did not differ in the SSS. Thus, we compared CBF of the distal part of the MCA and cortical microvessels in the center area of the hemisphere. The results showed that there were no differences in MTT between the two strains, suggesting that microvessel networks in the cerebral cortex have similar blood flow rates. Interestingly, BALB/c mice showed a tendency for slightly higher cortical microvessel area density,14 which may explain the similar peak time of ICG's for SSS and MCA.
Several anatomic studies have showed that differences in cerebral vasculature (e.g., branching and collaterals) in mouse strains can influence infarct size, and the recovery time after stoke.1, 4 In the current study, we showed that two mouse strains have different physiologic patterns of arterial blood flow, using ICG optical imaging. Our data showed that a larger volume of blood flows in a branch of the MCA in BALB/c, which explains why a blockage of a branch of cerebral artery in BALB/c could induce a bigger infarction than C57BL/6.
Other optical methods to measure CBF include Laser Doppler flowmetry, and Laser Speckle imaging. These two techniques measure the velocity of flow of red blood cells.15 Laser Doppler flowmetry lacks on sensitivity to estimate regional CBF, and only detects relative changes,9 while Laser Speckle imaging is usually used to visualize the vasculature and make an image of relative blood flow.15 Indocyanine green provides accurate and reliable identification of feeder and drainer vessels. This information is of great use to identify artery and vein. In addition, ICG imaging provides information of blood volume.15 Indocyanine green image shows a much stronger signal in the larger vessels compared to small vessels with same blood flow rate. In this study, we used the properties of ICG to delineate the arteries and veins, and measured CBF parameters on a specific region of the brain. In future studies, we will use this noninvasive optical imaging method to examine the effect of neurovascular-related diseases on the perfusion rate of vessels in specific brain region.
Acknowledgments
The authors thank Dr. Yujung Kang (R&D center, Vieworks Co., Ltd.) for reviewing the manuscript and interpretation of data.
Author Contributions
HK and CP conceived and designed the experiments; HK and IS performed the experiments; HK, SK, DK, JJ, JWJ, and CP analyzed the data; HK and CP wrote the paper; all authors reviewed the manuscript before submission.
The authors declare no conflict of interest.
Footnotes
Supplementary Information accompanies the paper on the Journal of Cerebral Blood Flow & Metabolism website (http://www.nature.com/jcbfm)
This work was supported by the Basic Science Research Program of the National Research Foundation of Korea (NRF) funded by the Ministry of Education, Science and Technology (NRF-2013R1A1A2060667).
Supplementary Material
References
- 1Majid A, He YY, Gidday JM, Kaplan SS, Gonzales ER, Park TS et al. Differences in vulnerability to permanent focal cerebral ischemia among 3 common mouse strains. Stroke 2000; 31: 2707–2714. [DOI] [PubMed] [Google Scholar]
- 2Zhang H, Prabhakar P, Sealock R, Faber JE. Wide genetic variation in the native pial collateral circulation is a major determinant of variation in severity of stroke. J Cereb Blood Flow Metab 2010; 30: 923–934. [DOI] [PMC free article] [PubMed] [Google Scholar]
- 3Chalothorn D, Faber JE. Formation and maturation of the native cerebral collateral circulation. J Mol Cell Cardiol 2010; 49: 251–259. [DOI] [PMC free article] [PubMed] [Google Scholar]
- 4Chalothorn D, Clayton JA, Zhang H, Pomp D, Faber JE. Collateral density, remodeling, and VEGF-A expression differ widely between mouse strains. Physiol Genomics 2007; 30: 179–191. [DOI] [PubMed] [Google Scholar]
- 5Kuebler WM, Sckell A, Habler O, Kleen M, Kuhnle GE, Welte M et al. Noninvasive measurement of regional cerebral blood flow by near-infrared spectroscopy and indocyanine green. J Cereb Blood Flow Metab 1998; 18: 445–456. [DOI] [PubMed] [Google Scholar]
- 6Kang Y, Choi M, Lee J, Koh GY, Kwon K, Choi C. Quantitative analysis of peripheral tissue perfusion using spatiotemporal molecular dynamics. PLoS One 2009; 4: e4275. [DOI] [PMC free article] [PubMed] [Google Scholar]
- 7Keller E, Nadler A, Alkadhi H, Kollias SS, Yonekawa Y, Niederer P. Noninvasive measurement of regional cerebral blood flow and regional cerebral blood volume by near-infrared spectroscopy and indocyanine green dye dilution. Neuroimage 2003; 20: 828–839. [DOI] [PubMed] [Google Scholar]
- 8Kang Y, Lee J, Kwon K, Choi C. Dynamic fluorescence imaging of indocyanine green for reliable and sensitive diagnosis of peripheral vascular insufficiency. Microvasc Res 2010; 80: 552–555. [DOI] [PubMed] [Google Scholar]
- 9Ku T, Choi C. Noninvasive optical measurement of cerebral blood flow in mice using molecular dynamics analysis of indocyanine green. PLoS One 2012; 7: e48383. [DOI] [PMC free article] [PubMed] [Google Scholar]
- 10Mouse Phenome Database at The Jackson Laboratory. http://phenome.jax.org/db/qp?rtn=views/measplot&brieflook=15112&projhint=Jaxwest1.
- 11Kilkenny C, Browne WJ, Cuthill IC, Emerson M, Altman DG. Improving bioscience research reporting: the ARRIVE guidelines for reporting animal research. PLoS Biol 2010; 8: e1000412. [DOI] [PMC free article] [PubMed] [Google Scholar]
- 12Gobbel GT, Cann CE, Fike JR. Measurement of regional cerebral blood flow using ultrafast computed tomography. Theoretical aspects. Stroke 1991; 22: 768–771. [DOI] [PubMed] [Google Scholar]
- 13Liebert A, Wabnitz H, Steinbrink J, Moller M, Macdonald R, Rinneberg H et al. Bed-side assessment of cerebral perfusion in stroke patients based on optical monitoring of a dye bolus by time-resolved diffuse reflectance. Neuroimage 2005; 24: 426–435. [DOI] [PubMed] [Google Scholar]
- 14Ward NL, Moore E, Noon K, Spassil N, Keenan E, Ivanco TL et al. Cerebral angiogenic factors, angiogenesis, and physiological response to chronic hypoxia differ among four commonly used mouse strains. J Appl Physiol 2007; 102: 1927–1935. [DOI] [PubMed] [Google Scholar]
- 15Towle EL, Richards LM, Kazmi SM, Fox DJ, Dunn AK. Comparison of indocyanine green angiography and laser speckle contrast imaging for the assessment of vasculature perfusion. Neurosurgery 2012; 71: 1023–1030. [DOI] [PMC free article] [PubMed] [Google Scholar]
Associated Data
This section collects any data citations, data availability statements, or supplementary materials included in this article.