

Abstract
Arterial spin labeling (ASL) is a noninvasive method to measure cerebral blood flow (CBF). Arterial spin labeling is susceptible to artifact generated by head motion; this artifact is propagated through the subtraction procedure required to calculate CBF. We introduce a novel strategy for mitigating this artifact based on weighting tag/control volumes according to a noise estimate. We evaluated this strategy (DVARS weighting) in application to both pulsed ASL (PASL) and pseudo-continuous ASL (pCASL) in a cohort of normal adults (N=57). Application of DVARS weighting significantly improved test–retest repeatability as assessed by the intra-class correlation coefficient. Before the application of DVARS weighting, mean gray matter intra-class correlation (ICC) between subsequent ASL runs was 0.48 and 0.51 in PASL and pCASL, respectively. With weighting, ICC was significantly improved to 0.63 and 0.58.
Keywords: arterial spin labeling, ASL, cerebral blood flow measurement, perfusion-weighted MRI
Introduction
Arterial spin labeling (ASL) is a noninvasive functional magnetic resonance imaging (fMRI) technique that measures cerebral blood flow (CBF). Arterial spin labeling acquisition involves tagging arterial blood water, waiting for the blood to perfuse the slice of interest, and measuring the signal. The physical principal underlying ASL is observing the intensity difference between tagged and untagged images to infer CBF. The ASL-based CBF measurements approximate CBF estimates derived from positron emission tomography using radio-labeled water.1 The favorable properties of ASL (e.g., no ionizing radiation exposure, superior temporal, and spatial resolution) motivate further methodological development. However, ASL, like most fMRI techniques, is sensitive to motion-induced artifact.2
The problem of motion artifact and strategies to mitigate such artifacts have been extensively discussed in the context of blood oxygen level-dependent fMRI.3, 4 Motion also impacts ASL-derived measurements of CBF but discussion of this issue has been limited.5, 6 Extant strategies focus on removing signals presumed to be artifactual (e.g., residual motion artifacts and global signal2) or removing frames contaminated by movement (i.e., frame censoring5). However, the efficacy of these strategies has not been quantitatively evaluated.
The procedure used to calculate CBF makes ASL particularly susceptible to head motion artifacts. Arterial spin labeling, like blood oxygen level-dependent fMRI, is subject to artifacts induced by head motion (spin history effects).7 These artifacts introduce noise, which corrupts the measurement and cannot be corrected by simple realignment. However, the calculation of CBF from ASL data involves subtracting subsequently acquired volumes. Thus, head motion over two frames contribute artifactual signal which exacerbates the confound.
Here, we report a technique that reduces the effect of motion by systematically discounting motion-contaminated frames. We demonstrate that this weighting scheme improves test–retest repeatability of ASL using both pulsed ASL (PASL) and pseudo-continuous ASL (pCASL) in a cohort of healthy individuals. Further, we demonstrate that noise weighting reduces the variance because of artifact in estimated CBF.
Materials and Methods
Participants
Fifty-seven participants (34F/27M; mean age=35 years old, standard deviation=16 years) were included in this study. Each participant was cognitively normal and had no history of head injury with loss of consciousness greater than 30 minutes, major psychiatric disorders, or contraindications to scanning. The Human Research Protection Office at Washington University in St. Louis approved all the procedures and each participant provided written informed consent. All the procedures conformed to the ethical standards put forth by the Washington University in St. Louis Human Research Protection Office and the Declaration of Helsinki.
Image Acquisition
Participants underwent imaging with a Siemens 3T Trim Trio scanner equipped with a standard 12-channel head coil. A high-resolution three-dimensional, sagittal, MPRAGE (magnetization-prepared rapid gradient echo scan) T1 scan was acquired (TR (time to repeat)=2,400 milliseconds, TE (time to echo)=3.16 milliseconds, flip angle=8°, 256 × 256 acquisition matrix, inversion time=1,000 milliseconds, voxel size=1 × 1 × 1 mm). A two-dimensional multi-slice oblique axial spin density/T2-weighted fast spin echo scan (TE=450 milliseconds, TR=3,200 milliseconds, 256 × 256 acquisition matrix, 1 × 1 × 1 mm voxels) was also acquired for image registration. Pulsed ASL was acquired using a common Siemens sequence with PICORE Q2T (TI1/TI of 700/1,800 milliseconds, TR/TE of 2,600/13 milliseconds, voxel size=3.4 × 3.4 × 6.0 mm with 1.5 mm slice gap, 64 × 64 acquisition matrix, 15 axial slices, and 90° flip angle). Two PASL runs each containing 63 volumes (duration of 2.7 minutes) were acquired. Pseudo-continuous ASL was also obtained (1.5 seconds labeling time,1.2 seconds post-labeling delay, TR of 3,500 seconds, TE of 9.0 milliseconds, 64 × 64 acquisition matrix, 90° flip angle, 22 axial slices with a 1 mm gap, and voxel size of 3.4 × 3.4 × 5.0). Two pCASL runs each containing 60 volumes (duration of 3.5 minutes) were acquired. Pulsed ASL and pCASL run pairs were acquired in immediate succession. Pulsed ASL preceded pCASL in all but one subject. There was approximately 5 minutes between PASL and pCASL acquisitions.
Preprocessing—Structural Data
Affine transforms were calculated to align each participant's T1 image to a common atlas space. This affine transform was combined with the transformation relating the T2 image to the T1 scan to enable alignment of the ASL data to a common space.
Preprocessing—Functional Data Alignment
The ASL data were aligned (6 degrees-of-freedom rigid body motion) within and across runs using a standard algorithm minimizing the squared intensity difference between input and reference images. Mean PASL and pCASL images (across each scan) were aligned to the T2 structural scan. The overall scheme achieves atlas transformation by a composition of affine transforms (EPI → T2w →MPRAGE → atlas).8 The final preprocessing step generated volumetric time-series EPI data in 3 mm3 atlas space, combining head motion correction and atlas transformation in one resampling step.
Using the realignment time-series, we calculated the root sum squared frame displacement for the first and second run for PASL and pCASL separately. The mean and standard deviation frame displacement across subjects was 0.22 (0.2) for the first PASL run, 0.28 (0.2) for the second PASL run, 0.18 (0.2) for the first pCASL run, and 0.21 (0.2) for the second pCASL run. We subjected these frame displacement values to a run by sequence repeated measures analysis of variance and found no effect or run (F1,56=1.55, P=0.21), sequence (F1,56=2.25, P=0.14), or an interaction (F1,56=0.08, P=0.77). Thus, the reported results were not significantly affected by differential movement in the different scans.
Cerebral Blood Flow Calculation
Cerebral blood flow was calculated using a previously defined mathematical model.9, 10, 11 Variables and constants are defined in Table 1. Cerebral blood flow for PASL was calculated using a single blood-compartment model:
Table 1. Model constants.
| Constant | PASL | pCASL | Definition |
|---|---|---|---|
| λ | 0.9 g/mL [23] | 0.9 g/mL [23] | Blood/tissue partition coefficient |
| α | 0.95 [26] | 0.85 [24] | Labeling efficacy |
| T1b | 1.65 s [25] | 1.65 s [25] | T1 decay of labeled protons |
| Tl1 | 0.7 s | Bolus duration | |
| τ | 1.5 s | Labeling duration | |
| Tl | 1.8 s | Inversion time | |
| PLD | 1.2 s | Post-labeling delay | |
| Tp | Tag volume in a given pair p | ||
| Cp | Untagged volume in a given pair p | ||
| M0 | Equilibrium image |
Abbreviations: ASL, arterial spin labeling; PASL, pulsed ASL; pCASL, pseudo-continuous ASL.
Arbitrary and derived constants for the ASL model.
 |
Similarly, CBF for pCASL was calculated using a single blood-compartment model:
 |
The expression parameterized as Z accounts for the serial acquisition of slices.
The sliced nature of the ASL acquisition used in this study introduces a time dependence on the axial slice number with slices closer to the vertex acquired at a later time than those closer to the base of the brain. Tagged blood decays over time. In participant space, correcting for this decay is a function of position along the axial dimension. However, alignment to atlas space disrupts this relationship. To compensate, an image was generated where each voxel contained the appropriate Z value (defined above). This Z image was aligned for both PASL and pCASL to yield a  image.
  represents the Z image for the tagged volume in the ASL pair corrected for the effects of atlas alignment. Accordingly,
  replaces Z in the above equations for calculated CBF. Equations (1) and (2) would not apply to other techniques that do not exhibit the same slide number time dependence (e.g., 3D GRASE).
Weighted Cerebral Blood Flow Calculation
Given multiple samples of the same quantity plus additive noise, the least squares estimate is achieved by averaging the individual samples weighted inversely in proportion to noise power.12 Arterial spin labeling data are contaminated by multiple sources of noise, the most important being head motion.5 In overview, weighting consists of computing a weighted mean of CBF measures derived from tagged/untagged frame pairs, where the weight is inversely proportional to estimated noise. In conventional CBF computation, all tagged/untagged frame pairs are equally weighted. We estimated noise using the temporal derivative of the frame-to-frame variance (DVARS) measure,4, 13 defined as the root mean square change in voxel intensity within the whole brain across successive frames:
 |
where I represents image intensity within a particular voxel r at frame t. M is the number of voxels in the brain mask. For the purpose of DVARS calculation only, the data were pre-blurred with a Gaussian kernel (10 mm full width half maximum in each direction).
As CBF is computed using an ASL pair (tag/control pairs), the noise power associated with each CBF estimate is computed as:
 |
where t indexes the tagged frame and p indexes the tag/control pair. Thus, the weight assigned to each tag/control pair was computed as
where 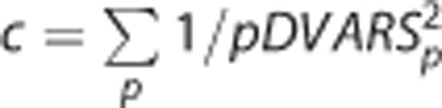 . Thus,
  . In the unweighted condition, wp=1/p, where p is the number of tag/control pairs. Mean weighted CBF is calculated as the inner product of wp and CBFp. Thus,
 |
The first tag/control pair was excluded because pDVAR (see below) for a given frame is only defined if a previous tag/control pair exists. For pCASL, the equilibrium image is computed by taking the mean across all control frames in the run. We reduce motion contamination in the equilibrium image by applying a similar weighting scheme for ASL pair using DVARS for control frames instead of pDVARS.
Statistics
The principal analytic question assessed here is the repeatability of measured blood flow across immediately successive measurements assuming that the mean CBF measured in both runs is identical. Any difference in calculated CBF between runs is attributed to noise and measurement error. We quantified the similarity between runs (two each for PASL and pCASL) using a two-way random effects intra-class correlation coefficient (ICC).14 To reduce the effects of noise, ICC was calculated within 15 mm isotropic cubic ROIs spanning the entire brain. Regional ICC was calculated separately for PASL and pCASL with and without DVARS weighting.
Results
Group average CBF images derived from PASL and pCASL with and without DVARS weighting are shown in Figure 1. Pulsed ASL- and pCASL-derived CBF estimates produced correlated topographies but the range of computed CBF values was greater for PASL. In particular, PASL-derived CBF from white matter approached zero whereas gray matter regions near the brain surface exhibited very high values. These differences most likely represent divergent biases depending on ASL technique. Exemplar single subject results are shown in Supplementary Materials (Supplementary Figure 1).
Figure 1.

Arterial spin labeling (ASL) derived cerebral blood flow (CBF). Mean CBF from 57 participants is displayed for PASL and pCASL with and without DVARS weighting. (A) Unweighted (uw) PASL. (B) uw-pCASL. (C) Weighted (w) PASL. (D) w-pCASL. White voxels indicate computed CBF values less than 0. PASL, pulsed ASL; pCASL, pseudo-continuous ASL.
DVARS-based weighting did not appreciably change mean computed CBF values for either PASL or pCASL (Figure 1). Voxelwise CBF before and after weighting was highly correlated for PASL and pCASL images (Table 2). Further, linear regression of the weighted result onto the unweighted result revealed a nearly zero intercept and a slope of near unity.
Table 2. Weighting comparison.
| Sequence | Pearson correlation | Slope | Intercept |
|---|---|---|---|
| PASL | 0.98 | 0.961 [0.959, 0.962] | −0.75 [−0.851, −0.657] |
| pCASL | 0.98 | 0.917 [0.975, 0.978] | −0.976 [−0.995, −0.839] |
Abbreviations: PASL, pulsed ASL; pCASL, pseudo-continuous ASL.
Regressing results comparing unweighted and weighted CBF. Quantities in square brackets are 95% confidence intervals.
Test–retest repeatability of each technique was quantified using ICC (Figure 2). Inspection of Figure 2 suggests that ICC was generally greater in the gray matter as compared with the white matter. Before DVARS weighting, pCASL results tended to have slightly higher ICC compared with PASL results (Figure 3A). However, following DVARS weighting, the ICC values for PASL and pCASL were nearly equivalent (Figure 3B). DVARS weighting improved the ICC for both techniques (Figures 3C and 3D). A sequence (PASL; pCASL) by weighting (unweighted; weighted) by tissue type (gray matter; white matter) analysis of variance using ROIs as repeated measures generated the following outcomes (Table 3). There was no average difference between the sequences but DVARS weighting within the gray matter was associated with higher ICC values. There was a significant sequence × weighting interaction wherein PASL ICC values were significantly more improved by weighting than pCASL ICC values.
Figure 2.

Intra-class correlation coefficient (ICC) calculated between duplicate ASL runs, evaluated in (15 mm3) cubes. Values near 1 indicate perfect repeatability. (A) uw-PASL. (B) uw-pCASL. (C) w-PASL. (D) w-pCASL. ASL, arterial spin labeling; PASL, pulsed ASL; pCASL, pseudo-continuous ASL; uw, unweighted; w, weighted.
Figure 3.

ICC comparisons. Paired ICC comparisons across conditions. (A) uw-PASL versus uw-pCASL. (B) w-PASL versus w-pCASL. (C) uw-PASL versus w-PASL. (D) uw-pCASL versus w-pCASL. Open and closed circles represent predominantly white and gray matter cubes, respectively. These data are treated statistically in Table 3. ICC, ICC, intra-class correlationcoefficient; PASL, pulsed arterial spin labeling; pCASL, pseudo-continuous arterial spin labeling; uw, unweighted; w, weighted.
Table 3. Intra-class correlation coefficient comparison.
|
PASL |
pCASL |
|||
|---|---|---|---|---|
| Unweighted | Weighted | Unweighted | Weighted | |
| GM | 0.48 (0.20) | 0.63 (0.18) | 0.51 (0.20) | 0.58 (0.18) |
| WM | 0.41 (0.25) | 0.69 (0.22) | 0.49 (0.20) | 0.54 (0.19) |
| F | P | |||
| Sequence | 1.6 | 0.206 | ||
| Weighting | 102.23 | <10−16 | ||
| Tissue | 11.012 | 0.000932 | ||
| Sequence:Weighted | 30.850 | 3.42 × 10⁻⁸ | ||
| Sequence:Tissue | 0.171 | 0.679 | ||
| Weighted:Tissue | 1.152 | 0.283 | ||
| Sequence:Weighted:Tissue | 0.026 | 0.872 | ||
Abbreviations: ICC, intra-class correlation coefficient; PASL, pulsed ASL; pCASL, pseudo-continuous ASL.
Upper section: mean (s.d.) ICC values. Lower section: analysis of variance (ANOVA) table.
Discussion
We demonstrate that the DVARS-weighting approach described here is effective at improving the repeatability of ASL by reducing within-participant variance. Evidence derived from resting-state fMRI suggests that this variance is largely a consequence of head motion.4, 15 Importantly, DVARS weighting of ASL data does not bias empirically calculated mean CBF. DVARS weighting improves the repeatability of PASL more than pCASL. This result implies that pCASL is less sensitive to corruption by head motion. We also observed that DVARS weighting is less effective in white matter. This difference most likely is attributable to the relatively low signal to noise in white matter.
Head Motion in Functional Imaging
It has been recognized for nearly two decades that movement corrupts blood oxygen level-dependent fMRI, the physical basis being the interaction of head motion with echo planar imaging (spin history effects).7 This artifact manifests as spurious changes in reconstructed image intensity that cannot be corrected by simple realignment. Extant approaches for mitigating the effects of motion in blood oxygen level-dependent fMRI include regression of realignment time-series,2, 8 censoring of movement-contaminated frames,4 independent component analysis,16 and regression of global signals.17, 18 Reported approaches for reducing spurious noise in ASL include correcting for known sources of physiologic noise,19, 20 low pass filtering subtracted image pairs,21 suppression of background signal,22 regression of nuisance time-series,2 and removal of motion-contaminated frames.5 Removal of contaminated frames is conceptually close to DVARS weighting. However, here we extensively characterize the effect of DVARS weighting in terms of ICC in a cohort of 57 normal adults.
Summary and Conclusions
We demonstrate that DVARS weighting of ASL data improves ICC, more so with PASL in comparison with pCASL. DVARS weighting does not significantly bias measures of CBF. Moreover, this technique is easily implemented and does not involve arbitrary constants (e.g., filter settings). Our results were obtained by systematically discounting frames with low SNR. Such a SNR-weighting approach improves mean estimates generally. In principle, the inverse SNR weighting is applicable to other ASL implementations (e.g., multiple post-labeling delays/inversion times or three-dimensional acquisitions), although the weighting scheme would have to be appropriately modified.
Acknowledgments
The authors acknowledge Danny J.J. Wang for helpful discussions and Elizabeth Westerhaus for data collection.
Author Contributions
ABT contributed to the conception of the study, analyzed and interpreted the data, drafted and approved the final version of the manuscript. AZS contributed to the conception of the study, analyzed and interpreted the data, drafted and approved the final version of the manuscript. MRB contributed to the analysis and interpretation of the data, drafted and approved the final version of the manuscript. BMA conceived the study, oversaw data collection and analysis, interpreted the results, drafted and approved the final version of the manuscript.
Disclaimer
The content of this study is solely the responsibility of the authors and does not necessarily represent the official view of NIH.
The authors declare no conflict of interest.
Footnotes
Supplementary Information accompanies the paper on the Journal of Cerebral Blood Flow & Metabolism website (http://www.nature.com/jcbfm)
This work was supported by the grants from the National Institute of Health—the National Institute of Mental Health (R21MH099979; BMA), the National Institute of Nursing Research (R01 NR012657, R01 NR014449, R01 NR012907; BMA), and P30NS048057 (AZS) and the Paula and Rodger Riney Fund. Research was conducted at the Washington University Institute of Clinical and Translational Sciences (UL1 TR000448 from the National Center for Advancing Translational Sciences).
Supplementary Material
References
- 1Detre JA, Wang J, Wang Z, Rao H. Arterial spin-labeled perfusion MRI in basic and clinical neuroscience. Curr Opin Neurol 2009; 22: 348–355. [DOI] [PubMed] [Google Scholar]
- 2Wang Z. Improving cerebral blood flow quantification for arterial spin labeled perfusion MRI by removing residual motion artifacts and global signal fluctuations. Magn Reson Imaging 2012; 30: 1409–1415. [DOI] [PMC free article] [PubMed] [Google Scholar]
- 3Oakes TR, Johnstone T, Ores Walsh KS, Greischar LL, Alexander AL, Fox AS et al. Comparison of fMRI motion correction software tools. Neuroimage 2005; 28: 529–543. [DOI] [PubMed] [Google Scholar]
- 4Power JD, Barnes KA, Snyder AZ, Schlaggar BL, Petersen SE. Spurious but systematic correlations in functional connectivity MRI networks arise from subject motion. Neuroimage 2012; 59: 2142–2154. [DOI] [PMC free article] [PubMed] [Google Scholar]
- 5Tan H, Maldjian JA, Pollock JM, Burdette JH, Yang LY, Deibler AR et al. A fast, effective filtering method for improving clinical pulsed arterial spin labeling MRI. J Magn Reson Imaging 2009; 29: 1134–1139. [DOI] [PMC free article] [PubMed] [Google Scholar]
- 6Jezzard P, Clare S. Sources of distortion in functional MRI data. Hum Brain Mapp 1999; 8: 80–85. [DOI] [PMC free article] [PubMed] [Google Scholar]
- 7Friston KJ, Williams S, Howard R, Frackowiak RS, Turner R. Movement-related effects in fMRI time-series. Magn Reson Med 1996; 35: 346–355. [DOI] [PubMed] [Google Scholar]
- 8Shulman GL, Pope DL, Astafiev SV, McAvoy MP, Snyder AZ, Corbetta M. Right hemisphere dominance during spatial selective attention and target detection occurs outside the dorsal frontoparietal network. J Neurosci 2010; 30: 3640–3651. [DOI] [PMC free article] [PubMed] [Google Scholar]
- 9Wang J, Alsop DC, Song HK, Maldjian JA, Tang K, Salvucci AE et al. Arterial transit time imaging with flow encoding arterial spin tagging (FEAST). Magn Reson Med 2003; 50: 599–607. [DOI] [PubMed] [Google Scholar]
- 10Wong EC. Quantifying CBF with pulsed ASL: technical and pulse sequence factors. J Magn Reson Imaging 2005; 22: 727–731. [DOI] [PubMed] [Google Scholar]
- 11Wong EC, Buxton RB, Frank LR. Quantitative imaging of perfusion using a single subtraction (QUIPSS and QUIPSS II). Magn Reson Med 1998; 39: 702–708. [DOI] [PubMed] [Google Scholar]
- 12Bevington PR. Data Reductions and Error Analysis for the Physical Sciences. McGraw-Hill: New York, NY. 1969; pp 92–118. [Google Scholar]
- 13Smyser CD, Inder TE, Shimony JS, Hill JE, Degnan AJ, Snyder AZ et al. Longitudinal analysis of neural network development in preterm infants. Cereb Cortex 2010; 20: 2852–2862. [DOI] [PMC free article] [PubMed] [Google Scholar]
- 14Shrout PE, Fleiss JL. Intraclass correlations: uses in assessing rater reliability. Psychol Bull 1979; 86: 420–428. [DOI] [PubMed] [Google Scholar]
- 15Satterthwaite TD, Wolf DH, Loughead J, Ruparel K, Elliott MA, Hakonarson H et al. Impact of in-scanner head motion on multiple measures of functional connectivity: relevance for studies of neurodevelopment in youth. Neuroimage 2012; 60: 623–632. [DOI] [PMC free article] [PubMed] [Google Scholar]
- 16Thomas CG, Harshman RA, Menon RS. Noise reduction in BOLD-based fMRI using component analysis. Neuroimage 2002; 17: 1521–1537. [DOI] [PubMed] [Google Scholar]
- 17Fox MD, Snyder AZ, Vincent JL, Corbetta M, Van Essen DC, Raichle ME. The human brain is intrinsically organized into dynamic, anticorrelated functional networks. Proc Natl Acad Sci USA 2005; 102: 9673–9678. [DOI] [PMC free article] [PubMed] [Google Scholar]
- 18Fox MD, Zhang D, Snyder AZ, Raichle ME. The global signal and observed anticorrelated resting state brain networks. J Neurophysiol 2009; 101: 3270–3283. [DOI] [PMC free article] [PubMed] [Google Scholar]
- 19Pfeuffer J, Van de Moortele PF, Ugurbil K, Hu X, Glover GH. Correction of physiologically induced global off-resonance effects in dynamic echo-planar and spiral functional imaging. Magn Reson Med 2002; 47: 344–353. [DOI] [PubMed] [Google Scholar]
- 20Restom K, Behzadi Y, Liu TT. Physiological noise reduction for arterial spin labeling functional MRI. Neuroimage 2006; 31: 1104–1115. [DOI] [PubMed] [Google Scholar]
- 21Liu TT, Wong EC. A signal processing model for arterial spin labeling functional MRI. Neuroimage 2005; 24: 207–215. [DOI] [PubMed] [Google Scholar]
- 22Ye FQ, Frank JA, Weinberger DR, McLaughlin AC. Noise reduction in 3D perfusion imaging by attenuating the static signal in arterial spin tagging (ASSIST). Magn Reson Med 2000; 44: 92–100. [DOI] [PubMed] [Google Scholar]
Associated Data
This section collects any data citations, data availability statements, or supplementary materials included in this article.