To the Editor
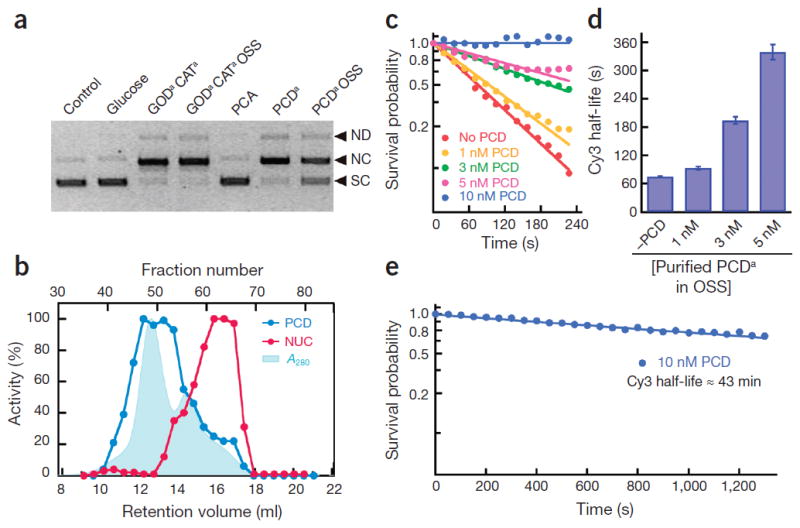
Much to our surprise, we observed substantial DNA nuclease activity with both the glucose-coupled glucose oxidase/catalase (GODCAT)1,2 and the protocatechuic acid (PCA)–protocatechuate-3,4-dioxygenase (PCD)3 oxygen-scavenging systems (OSSs) that are widely used for single-molecule (SM) studies (Fig. 1a and Supplementary Figs. 1–3). The GODCAT system also displayed non-specific DNA binding/ aggregation activity, a fluorescent cofactor and single-stranded and/or double-stranded DNA endo- and exonuclease activities (Supplementary Figs. 2–4 and Supplementary Notes 1–4). In addition, nearly all the OSS enzymes from multiple commercial sources (Supplementary Table 1, Supplementary Methods) displayed residual Mg2+-dependent nuclease contaminants (Supplementary Fig. 5a–c). The commonly used CATa,b and PCDa enzymes contained the most impurities and the highest level of nuclease activity, whereas CATc and PCDb seemed to be the least contaminated commercially available OSS components.
Figure 1.

Nuclease contamination of oxygen-scavenging enzymes; purification and analysis of PCD. (a) Analysis of endonuclease activity in different OSS components. The resulting products include the following: SC, supercoiled monomer; NC, nicked circular monomer; ND, nicked dimer. (b) Normalized absorbance at 280 nm (light blue shaded area), percent PCD activity (blue) and percent endonuclease activity (red) of Superose 6 gel filtration fractions. (c) Kinetics of Cy3 photobleaching at different purified PCDa concentrations. (d) The calculated half-life of Cy3 with the purified PCDa OSS in the imaging buffer. The half-life of Cy3 corresponds to a 50% survival probability in c. Error bars denote ±s.e. (e) Extended analysis of the survival probability of Cy3 in the presence of 10 nM purified PCDa OSS (see main text).
These observations suggested that DNA binding and/or aggregation, nuclease and other contaminants should be removed from the OSS before use in DNA-SM analysis. We developed a straightforward Superose 6 size-exclusion chromatography purification method for PCDa that takes advantage of the enzyme’s large reported size, with 12 α-dimer (23.3 kDa) and β-dimer kDa) subunits4 (Supplementary Notes 5 and 6). The majority of nuclease activity eluted as an ~40-kDa protein, with a slightly higher molecular weight shoulder at ~100 kDa (Fig. 1b and Supplementary Fig. 6), whereas peak PCD enzyme activity corresponded with the αβ-subunits, eluting at 417 kDa (Fig. 1b and Supplementary Figs. 6 and 7). The pooled PCD fractions (43–51) were free of nuclease activity and did not inhibit several DNA metabolic reactions even at high concentrations (100 nM; Supplementary Figs. 5 and 8–10 and Supplementary Note 7).
Using SM photobleaching analysis, we counted and analyzed the number of Cy3 spots on a 3,429-μm2 image area as a function of irradiation time at different PCD concentrations (Fig. 1c–e and Supplementary Fig. 11). We observed a PCD concentration–dependent increase in Cy3 half-life, in which Cy3 fluorescence loss at 10 nM PCD was negligible after 4 min of irradiation (Fig. 1c and Supplementary Fig. 11). An extended analysis suggested an apparent photobleaching rate constant of 10 nM PCD (kpb = 0.016 ± 0.003 min−1; s.e. from the fitting) that resulted in an estimated half-life of Cy3 of ~2,600 s (43 min) (Fig. 1e), which substantially exceeds observations from most SM kinetic studies5. Moreover, we observed very little ‘blinking’ of Cy3, similar to previous reports3, suggesting a remarkable additional stability that is capable of enhancing SM analysis (data not shown).
Finally, GODaCATa and PCDa are the most common OSS enzymes used in SM DNA and RNA analysis. Our surveys strongly suggest that these enzymes could influence SM observations as a result of multiple contaminants. We recommend the use of commercial PCDb or purified PCDa, as outlined here for DNA- or RNA-based SM studies (Fig. 1 and Supplementary Fig. 5). Although the commercial CATc preparation is relatively free of nuclease, there does not seem to be a commercial GOD product or method of purification that will provide a nuclease-free OSS with these enzymes.
Supplementary Material
Acknowledgments
We thank our laboratory members for their insights and helpful discussions. This work was supported by the National Research Foundation of Korea (grant 2011-0013901 to J.-B.L.) and the US National Institutes of Health (grant AI099854 to K.E.Y.; grants GM080176 and CA67007 to R.F.).
Footnotes
AUTHOR CONTRIBUTIONS
G.S., J.L., J.-B.L., K.E.Y. and R.F. designed the experiments; G.S., J.L. and R.F. analyzed the data; M.A.L. helped with the PCD purification and performed PFV integration analysis; J.M.-L. prepared the D-loop DNA substrate; J.H. helped with the SM analysis; all authors participated in critical discussions and writing of the paper.
COMPETING FINANCIAL INTERESTS
The authors declare no competing financial interests.
Note: Any Supplementary Information and Source Data files are available in the online version of the paper (doi:10.1038/nmeth.3588).
References
- 1.Rasnik I, McKinney SA, Ha T. Nat Methods. 2006;3:891–893. doi: 10.1038/nmeth934. [DOI] [PubMed] [Google Scholar]
- 2.Shi X, Lim J, Ha T. Anal Chem. 2010;82:6132–6138. doi: 10.1021/ac1008749. [DOI] [PMC free article] [PubMed] [Google Scholar]
- 3.Aitken CE, Marshall RA, Puglisi JD. Biophys J. 2008;94:1826–1835. doi: 10.1529/biophysj.107.117689. [DOI] [PMC free article] [PubMed] [Google Scholar]
- 4.Ohlendorf DH, Lipscomb JD, Weber PC. Nature. 1988;336:403–405. doi: 10.1038/336403a0. [DOI] [PubMed] [Google Scholar]
- 5.Juette MF, et al. Curr Opin Chem Biol. 2014;20:103–111. doi: 10.1016/j.cbpa.2014.05.010. [DOI] [PMC free article] [PubMed] [Google Scholar]
Associated Data
This section collects any data citations, data availability statements, or supplementary materials included in this article.


