Abstract
Evidence shows that an abnormal deposition of amyloid beta-peptide25–35 (Aβ25–35) was the primary cause of the pathogenesis of Alzheimer’s disease (AD). And the elimination of Aβ25–35 is considered an important target for the treatment of AD. Triptolide (TP), isolated from Tripterygium wilfordii Hook.f. (TWHF), has been shown to possess a broad spectrum of biological profiles, including neurotrophic and neuroprotective effects. In our study investigating the effect and potential mechanism of triptolide on cytotoxicity of differentiated rat pheochromocytoma cell line (the PC12 cell line is often used as a neuronal developmental model) induced by Amyloid-Beta25–35 (Aβ25–35), we used 3-(4, 5-dimethylthiazol-2-yl)-2, 5- diphenyltetrazolium bromide (MTT) assay, flow cytometry, Western blot, and acridine orange staining to detect whether triptolide could inhibit Aβ25–35–induced cell apoptosis. We focused on the potential role of the autophagy pathway in Aβ25–35-treated differentiated PC12 cells. Our experiments show that cell viability is significantly decreased, and the apoptosis increased in Aβ25–35-treated differentiated PC12 cells. Meanwhile, Aβ25–35 treatment increased the expression of microtubule-associated protein light chain 3 II (LC3 II), which indicates an activation of autophagy. However, triptolide could protect differentiated PC12 cells against Aβ25–35-induced cytotoxicity and attenuate Aβ25–35-induced differentiated PC12 cell apoptosis. Triptolide could also suppress the level of autophagy. In order to assess the effect of autophagy on the protective effects of triptolide in differentiated PC12 cells treated with Aβ25–35, we used 3-Methyladenine (3-MA, an autophagy inhibitor) and rapamycin (an autophagy activator). MTT assay showed that 3-MA elevated cell viability compared with the Aβ25–35-treated group and rapamycin inhibits the protection of triptolide. These results suggest that triptolide will repair the neurological damage in AD caused by deposition of Aβ25–35 via the autophagy pathway, all of which may provide an exciting view of the potential application of triptolide or TWHF as a future research for AD.
Introduction
Alzheimer’s disease (AD) is a neurodegenerative disease and it is the main cause of dementia. AD accounts for 60%-70% of dementia syndromes in people older than 65 years [1]. Clinically, the major characteristic of AD is memory impairment, especially impairment of episodic memory [2]. Evidence shows that an abnormal deposition of amyloid beta-peptide25–35 (Aβ25–35) could cause the loss of neurons, and synaptic lesions, all of which are considered to affect the memory. Therefore, the abnormal deposition of Aβ25–35 in plaques of brain tissue was the primary cause of the pathogenesis of AD [3]. Thus, the prevention and elimination of excessive accumulation of Aβ25–35 is considered an important target for the treatment of AD [4–6].
Autophagy is widely present in eukaryotic cells. It is an evolutionarily conserved catabolic process involved in the elimination and recycling of non-essential or abnormal organelles and long-lived proteins by lysosomes [7]. Since De Duve first used the word autophagy 50 years ago, people mainly use it to describe the digestion/degradation of misfolded or aggregated proteins and damaged organelles in the cells [8, 9]. With the development of technology and medicine, many researchers found that disrupting the autophagy is the target for many diseases such as pancreatic cancer and non-small cell lung cancer. In addition, numerous studies using postmortem human tissue, genetic- and toxin- induced animal and cellular models confirmed that many etiological factors of neurodegenerative disorders can perturb the autophagic process. More recent data support the view that autophagy is critical for the pathogenesis of neurodegenerative disorders [10–12]. More and more evidence shows the pathophysiological roles of autophagy in neurodegenerative disorders, such as Alzheimer’s disease, Parkinson’s disease, Huntington’s disease and Amyotrophic lateral sclerosis [13]. For example, in Parkinson’s disease, the autophagic pathway is involved in mitochondrial dysfunction, which serves as a crucial pathogenic mechanisms. Mitochondrial dysfunction is the primary mediator of cell death in Parkinson’s disease [14]. In Huntington’s disease, post mortem brains of patients with Huntington's disease have endosomal and/or lysosomal organelles and multivesicular bodies, characteristic features of autophagy [15]. Excessive autophagy have also been examined in lymphoblasts of Huntington's disease patients’ tissue [16]. Furthermore, an increase in autophagic activity can affect the formation and degradation of β-amyloid and tau protein [17]. Autophagy is now recognized as an arbiter of neuron survival and apoptosis [18] in neurodegenerative disorders [19]. An increasing amount of data confirms that autophagy could increase the accumulation of intracellular Aβ25–35 protein aggregates in neurons [20, 21]. In addition, there are many autophagosomes in the brain in early AD [22]. Therefore, autophagy has been the direction of research in Aβ25–35 deposition in recent years. Meanwhile, reactive oxygen species (ROS) are closely associated with oxidative stress, including superoxide anion (O2 -), hydroxyl radical (• OH), and hydrogen peroxide (H2O2) [23]. The latest research suggests that ROS as signaling molecules could increase production of mitochondrial membrane lipid peroxidation and mitochondrial dysfunction, causing autophagic cell death [24, 25]. Accordingly, clarifying the molecular signal mechanism of autophagy in Aβ-induced cytotoxicity will contribute to discovering the treatment target of AD.
Tripterygium wilfordii Hook.f. (TWHF) is a representative Traditional Chinese Medicine (TCM) herb, which belongs to the Celastraceae family [26]. TWHF has aided in treating inflammatory and autoimmune diseases for hundreds of years [27, 28]. According to the data, more than 300 compounds were identified in TWHF, such as triptolide, tripdiolide, tripcheorolide, 16-hydroxytriptolide, triptonide, and triptriolide [29]. As one kind of triepoxide lactone, triptolide (TP) is the major active compound in TWHF [30], which has been shown to have a broad spectrum of biological profiles including anti-inflammatory, immunosuppressive, anti-fertility, anti-tumor activity, neurotrophic and neuroprotective effects [26]. Currently, much of the available data reveals that triptolide is a promising immunosuppressive and anti-inflammatory agent [31]. In addition, triptolide could easily penetrate the blood-brain barrier because of its lipophilic character and small molecular size [32, 33], and it is proven to have a potential medicinal effect for diseases of the central nervous system (CNS) such as Parkinson's disease, spinal cord and brain injuries, and multiple sclerosis [26]. Gu and He et al point out that triptolide plays a neuroprotective role in a variety of cell models. For example, triptolide could decrease the Ca2+ concentration that is induced by Aβ25–35 [34]. Moreover, triptolide inhibits the apoptosis of PC12 cells treated with glutamate [35]. However, little is known about whether triptolide has a protective effect on cytotoxicity of differentiated PC12 cells induced by Aβ25–35 and what the mechanisms are.
Based on these, the purpose of this study was to assess whether triptolide could protect against Aβ induced cytotoxicity in differentiated PC12 cells. In our experiments, we use MTT assay and flow cytometry to investigate the protective effects of triptolide. Western blot and acridine orange staining were chosen to detect the mechanism of triptolide on differentiated PC12 cells treated with Aβ25–35. All of these may provide an interesting view of the potential application of triptolide or TWHF in future research for AD.
Materials and Methods
Materials
Aβ25–35, 3-(4, 5-dimethylthiazol-2-yl)-2, 5-diphenyltetrazolium bromide (MTT), triptolide, rapamycin and 3-Methyladenine (3-MA) were purchased from Sigma Chemical Co., MO, USA. The RPMI 1640 medium and fetal bovine serum (FBS) were purchased from Gibco BRL, USA. The Annexin V-FITC propidium iodide (PI) apoptosis detection kit was from Bipec Biopharma Corporation, USA. The ROS testing kit was from Genmed Scientifics Inc., USA. Mouse monolyclonal anti-LC 3 antibodies (primary antibody, working dilution 1:1000) were purchased from Medical & Biological Laboratories Co., Ltd. and mouse polyclonal anti-β-actin IgG (primary antibody, working dilution 1:1000) were obtained from Santa Cruz Biotechnology, Inc. CA, U.S.A. The Alexa 594-conjugated goat anti-mouse IgG secondary antibody was obtained from Invitrogen, San Diego, CA, USA. Chemiluminescent HRP substrate (Immobilon western) was purchased from Millipore Corporation, Billerica, MA, U.S.A.
Pretreatment of Aβ25–35 and triptolide
Aβ25–35 (molecular formula: C45H81N13O14S, molecular weight: 1060.27, purity: ≥97%) was purchased from Sigma. Aβ25–35 was diluted to 1mmol/L with phosphate buffered saline (PBS), and incubated at 37°C for 2 weeks to induce the aggregation of Aβ25–35. When using, it was diluted to different concentrations with RPMI 1640 medium.
Triptolide (PG490, molecular formula: C20H24O6, molecular weight: 360.4) was purchased from Sigma. The material was composed of white to off-white crystals, had a melting point of 235–237°C, and conformed to standard triptolide preparation by proton nuclear magnetic resonance. The material was 98% pure by reverse phase high pressure liquid chromatography evaluation. Before using, triptolide was soluble in dimethylsulfoxide (DMSO). After reconsititution, triptolide was stored at -20°C at a concentration of 1 mg/mL. When using, it was diluted to different concentrations with RPMI 1640 medium.
Cell culture
The rat pheochromocytoma cell line (PC12, derived from the American Type Culture Collection) was purchased from the Institute of Basic Medical Sciences Chinese Academy of Medical Sciences. It has been described in our previously work [23, 36]. The cell line was derived from a rat adrenal medulla pheochromocytoma. In the presence of nerve growth factor (NGF), the undifferentiated PC12 cells could differentiate into sympathetic-like neurons, which were widely used as the model of neurons in vitro [37].
The undifferentiated PC12 cells were cultured in an incubator aerated with 95% humidified air with 5% CO2 at 37°C, supplemented with 10% FBS, 5% horse serum, and 1% antibiotics (penicillin and streptomycin). Then the medium was replaced with serum-free RPMI1640 supplemented with 50 ng/mL NGF for 7 days to obtain neuronal differentiated PC12 cells. Then differentiated PC12 cells were cultured in RPMI 1640 medium (pH = 7.4) supplemented with 5% FBS and 1% antibiotics (penicillin and streptomycin). Cells were grown at 37°C in 95% humidified air with 5% CO2. All subsequent experiments in the present study were undertaken with these differentiated PC12 cells.
Cytotoxicity induced by Aβ25–35 on differentiated PC12 cells
In vitro cytotoxicity induced by Aβ25–35 on differentiated PC12 cells was assessed by the MTT assay, which was widely used to evaluate the cytotoxic activity. Differentiated PC12 cells were cultured on 96-well plates with RPMI 1640 medium for stabilization. 24 hours later, cells were incubated with different concentrations of Aβ25–35 (5, 10, 20 μmol/L) for 24 hours. Subsequently, MTT was added and incubated for 4 hours at 37°C. After that, formazan crystals were dissolved by DMSO and measured at a wavelength of 570 nm. The cell viability was expressed as a percentage of viability of the control culture. Each condition and experiment was repeated three times.
The viability of differentiated PC12 cells treated with different concentrations of triptolide
After differentiated PC12 cells were cultured on 96-well plates with RPMI 1640 medium for stabilization, differentiated PC12 cells were incubated with different concentrations of triptolide (10−11, 10−10, 10−9 mol/L) for 24 hours. The concentrations in this study were chosen according to the published data [26, 35]. Then cell viability was determined by the MTT assay. Each condition and experiment was repeated three times.
Effect of different concentrations of triptolide on Aβ25–35-induced cytotoxicity in differentiated PC12 cells
In the study, we chose 10 μmol/L Aβ25–35 as a final concentration to incubate differentiated PC12 cells to detect the cytotoxicity of Aβ. In order to assess the effect of triptolide on Aβ25–35-induced cytotoxicity in PC12 cells, our experiment was performed with the following treatments: control (culture medium), 10 μmol/L Aβ25–35, 10 μmol/L Aβ25–35+10−11 mol/L triptolide, 10 μmol/L Aβ25–35+10−10 mol/L triptolide, and 10 μmol/L Aβ25–35+10−9 mol/L triptolide. Each group of cells was cultured for 24 hours. Then cell viability was determined by the MTT assay. Each condition and experiment was repeated three times.
Detection of apoptotic cells
Annexin V-FITC and PI staining analyzed by flow cytometry (Beckman-Coulter, USA) was used to detect the apoptotic index. The cells were plated in 6-well plates and exposed to 10 μmol/L Aβ25–35 and /or 10−10 mol/L triptolide or cell culture medium without treatment (control) for 24 hours. Then cells were harvested and rinsed with PBS. After that, cells were re-suspended in 400 μL 1×binding buffer containing 10 μL PI and 5 μL V-FITC, and incubated for 15 min at room temperature in the dark. The cell suspension was determined by flow cytometry to analyze the apoptotic rate. The apoptosis ratio was calculated as follows: apoptosis ratio (%) = (the percentage of early apoptotic cells) + (the percentage of late apoptotic cells). The percentage of the cells is presented in the area of respective quadrant profiles. All experiments were performed a minimum of three times.
Measurement of ROS generation
The level of ROS induced by different conditions was measured by dichlorodihydrofluorescein diacetate (DCFH-DA). Cells were exposed to cell culture medium, 10 μmol/L Aβ25–35, and 10 μmol/L Aβ25–35+10−10 mol/L triptolide for 24 hours. Then differentiated PC12 cells were incubated in the staining solution containing DCFH-DA for 20 min at 37°C and washed with PBS. The methodology followed the procedures as described in the ROS assay kit. The intracellular accumulation of ROS was measured by flow cytometry. The level of ROS generation was calculated as follows: the level of ROS (%) = the percentage of DCF-positive cells in M1 region. All experiments were performed a minimum of three times.
Acridine orange staining
Cellular acidic compartments were examined by acridine orange staining. Acridine orange (molecular formula: C17H19N3·HCl·ZnCl2, molecular weight: 438.1, purity:≥98%) was diluted to 1μmol/L with PBS. Differentiated PC12 cells were seeded in 6-well plates and treated with cell culture medium, 10 μmol/L Aβ25–35 and /or 10−10 mol/L triptolide for 24 hours. After treatment, the cells were stained with acridine orange at 37°C for 15 min. After washing three times with PBS, the cells were immediately visualized by a Leica TCS SP5 laser-scanning confocal microscope for the detection of acidic vesicular organelles. For the quantitation analysis, fluorescent intensity was quantified using Image-Pro Plus 6.0 (IPP 6.0) [38]. Data were analyzed from several cells of one sample, and there were seven samples for each group. The TIFF images were not processed before measurement of signal intensities.
Immunofluorescence
The cells were treated with cell culture medium, 10 μmol/L Aβ25–35, 10 μmol/L Aβ25–35+10−10 mol/L triptolide and 10−10 mol/L triptolide for 24 hours. Following a 30 min-fixation in 4% paraformaldehyde at 4°C, cells were washed with PBS, and then were permeabilized with 0.5% Triton X-100 and blocked with 10% NGS for 2 hours at room temperature. After that, cells were incubated with mouse anti-LC3 antibody as the primary antibody overnight at 4°C. After washing with PBS, cells were incubated with Alexa 594-conjugated anti-mouse IgG for 3 hours at room temperature. Thereafter, the cell nuclei were stained by DAPI. The fluorescent signals were examined using an Olympus FV1000 laser-scanning confocal microscope, and fluorescent intensity was quantified using IPP 6.0. Data were analyzed from several cells of one sample, and there were seven samples for each group. The TIFF images were not processed before measurement of signal intensities. All experiments were performed a minimum of three times.
Western blot assay
Differentiated PC12 cells were incubated with cell culture medium, 10−10 mol/L triptolide, 10 μmol/L Aβ25–35 and /or 10−10 mol/L triptolide for 24 hours. Then cells were lysed for 30 min on ice. Protein samples were centrifuged for 15 min at 4°C. Samples were subjected to electrophoresis on SDS-polyacrylamide gel and the separated proteins were electrotransferred to polyvinylidenedifluoride (nitrocellulose) membranes. Membranes were blocked in 5% non-fat milk for 2 hours at room temperature, and then incubated with primary antibody (anti-LC3) overnight at 4°C. Subsequently, membranes were washed and incubated with a 1:2500 dilution of secondary antibodies for 1 hour at room temperature. The bands were visualized by a chemiluminescent HRP substrate detection kit. For analysis, quantization was performed by scanning and determination of the intensity of the hybridization signals. We used the LC3 II/LC3 I ratio to comprehensive assess autophagy flux. Protein loading and transferring of LC3 II and LC3 I were standardized by preliminary experiments in which β-actin expression on the same Western blot sample was quantitated by use of the Imge J software [39]. All experiments were performed a minimum of three times.
Effect of 3-MA and rapamycin
In order to assess the effect of autophagy on the protective effects of triptolide in differentiated PC12 cells treated with Aβ25–35, we used 3-MA (an autophagy inhibitor, 10 μmol/L) and rapamycin (an autophagy activator, 10ng/mL). PC12 cells were incubated with culture medium, 10 μmol/L Aβ25–35, 10 μmol/L Aβ25–35+10 μmol/L 3-MA, 10 μmol/L 3-MA, 10ng/mL rapamycin, 10 μmol/L Aβ25–35+10−10 mol/L triptolide, and 10 μmol/L Aβ25–35+10−10 mol/L triptolide +10ng/mL rapamycin for 24 hours. The cell viability was determined by MTT. Each condition and experiment was repeated three times.
Statistical analysis
All of the results were expressed as mean ±S.E.M and analyzed by Origin 8.1 and SPSS 17.0. The results of the groups treated with the triptolide were compared to those of the no- triptolide -treated group and represented as the percentage of the control value. The test of Kolmogorov–Smirnov with the correction of Lilliefors was used to evaluate the normal distribution and the test of Levene to evaluate the homogeneity of variance. Statistical analysis was performed using one-way ANOVA followed by a Turkey’s multiple range test and P<0.05 was considered significant.
Results
Cytotoxicity induced by Aβ25–35 on differentiated PC12 cells
We first tested the cytotoxicity of Aβ25–35 on differentiated PC12 cells by MTT assay. Kolmogorov-Smirnov with the correction of Lilliefors and Levene test showed that all of our data satisfied the normal distribution (P>0.05) and the homogeneity of variance (P>0.05). Therefore, it was omitted in next experiments.
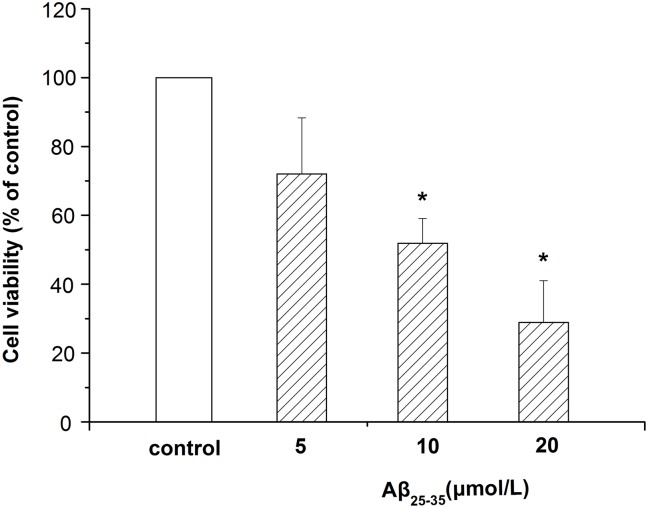
As shown in Fig 1, exposure of cells to different concentrations of Aβ25–35 (5, 10, 20 μmol/L) for 24 hours resulted in a decrease of the cell viability, which indicated that Aβ25–35 induced toxicity in differentiated PC12 cells. Additionally, the toxicity induced by Aβ25–35 was in a concentration-dependent manner. 10 μmol/L Aβ25–35 was chosen in this experiment because of the 50% viability.
Fig 1. Cytotoxicity induced by Aβ25–35 in differentiated PC12 cells.
Cells were treated with different concentrations (5, 10, 20 μmol/L) of Aβ25–35 for 24 hours. The cell viability was measured by MTT assay. Data represents the mean ± S.E.M. n = 6/group. *P < 0.05 vs. control group.
Viability of differentiated PC12 cells treated with different concentrations of triptolide
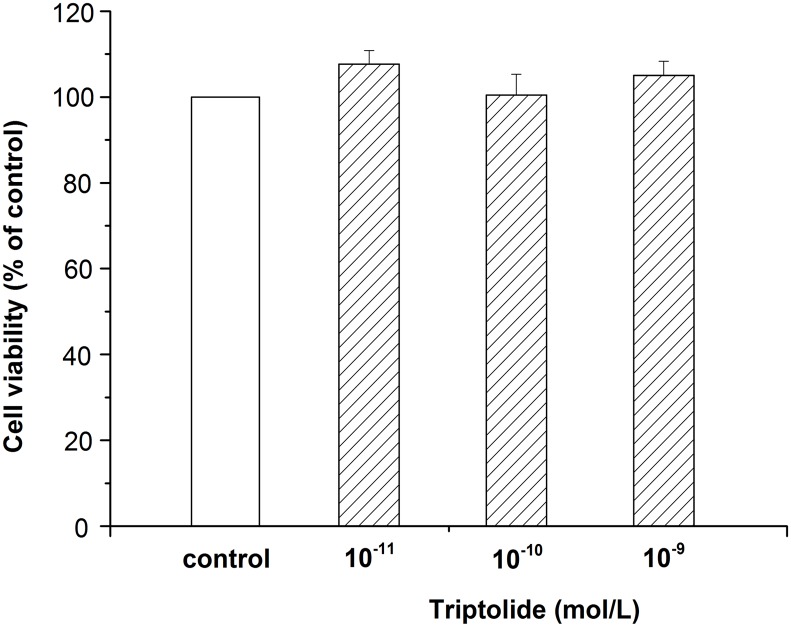
Differentiated PC12 cells were treated with different concentrations (10−11, 10−10, 10−9 mol/L) of triptolide for 24 hours, followed by the MTT assay to determine cell viability. As shown in Fig 2, cell viability showed no significant difference with the control group when the concentration changed. The results suggest that our concentrations of the triptolide were safe for differentiated PC12 cells.
Fig 2. Viability of differentiated PC12 cells treated with different concentrations of triptolide.
Differentiated PC12 cells were incubated with different concentrations of triptolide (10−11, 10−10, 10−9 mol/L) for 24 hours. Cell viability was determined by MTT assay. Data represents the mean ± S.E.M. n = 6/group.
Effect of different concentrations of triptolide on Aβ25–35-induced cytotoxicity in differentiated PC12 cells
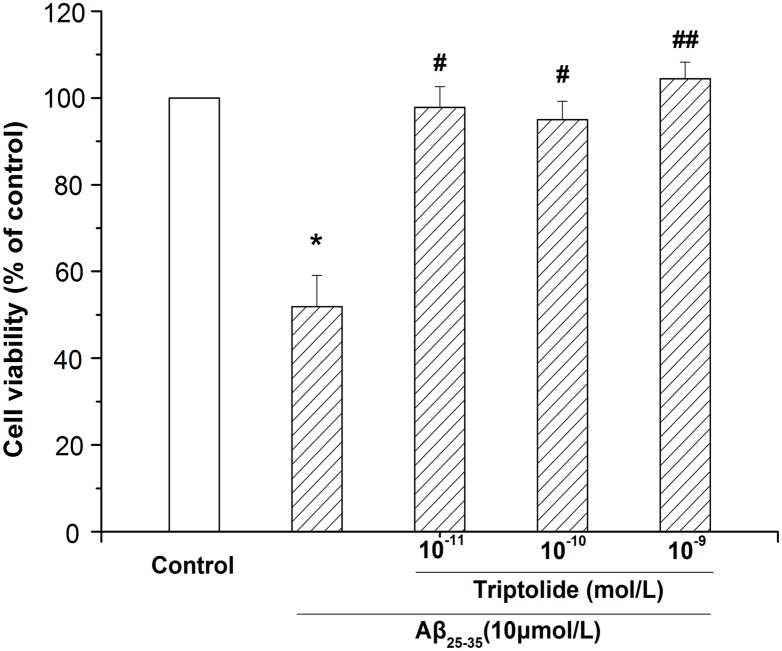
Differentiated PC12 cells were incubated with different concentrations of triptolide (10−11, 10−10, 10−9 mol/L) in the presence of 10 μmol/L Aβ25–35 for 24 hours and MTT assay was used to detect the effect of triptolide. The results in Fig 3 show that Aβ25–35 could decrease the cell viability and when treated with triptolide the viability of differentiated PC12 cells was significantly increased. The results indicate that triptolide can alleviate cellular damage caused by Aβ25–35, which means that triptolide has a neuroprotective effect.
Fig 3. Effect of different concentrations of triptolide on Aβ25–35-induced cytotoxicity in differentiated PC12 cells.
Differentiated PC12 cells were treated with culture medium, 10 μmol/L Aβ25–35, 10 μmol/L Aβ25–35+10−11 mol/L triptolide, 10 μmol/L Aβ25–35+10−10 mol/L triptolide, and 10 μmol/L Aβ25–35+10−9 mol/L triptolide for 24 hours. Cell viability was measured by MTT assay and the results were expressed as the percentile of absorbance of treated samples compared to that of the control. Data represents the mean ± S.E.M. n = 6/group. *P < 0.05 vs. control group. # P < 0.05, ## P < 0.01 vs. 10 μmol/L Aβ25–35 group.
Effect of triptolide on Aβ25–35-induced apoptosis in differentiated PC12 cells
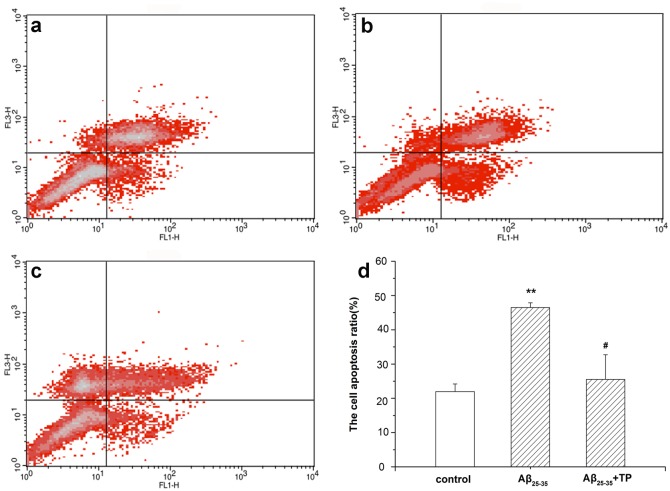
The effect of triptolide on Aβ25–35-induced apoptosis in differentiated PC12 cells was tested by flow cytometry, as shown in Fig 4. After incubation with 10 μmol/L Aβ25–35 for 24 hours, the apoptotic rates of cells were increased significantly compared to those of the control group without treatment (Fig 4d). When treated with 10−10 mol/L triptolide and 10 μmol/L Aβ25–35 for 24 hours, the apoptotic rate of differentiated PC12 cells was significantly decreased. The results indicate that triptolide has neuroprotective effects on differentiated PC12 cells treated with Aβ25–35.
Fig 4. Effect of triptolide on Aβ25–35-induced apoptosis in differentiated PC12 cells.
The apoptotic rate of differentiated PC12 cells was analyzed by flow cytometry after being incubated with culture medium (a), 10 μmol/L Aβ25–35 (b), and 10 μmol/L Aβ25–35+10−10 mol/L triptolide (c) for 24 hours. The intensity of Annexin V-FITC fluorescence was on the X-axis and PI fluorescence was on the Y-axis. The bar graph was shown in (d). The apoptosis ratio was calculated as follows: apoptosis ratio (%) = (the percentage of early apoptotic cells) + (the percentage of late apoptotic cells). And the percentage of the cells is presented in the area of respective quadrant profiles. Each data represents the mean ± S.E.M. n = 3/group. **P < 0.01 vs. control group. # P < 0.05 vs. 10 μmol/L Aβ25–35 group.
Measurement of ROS generation
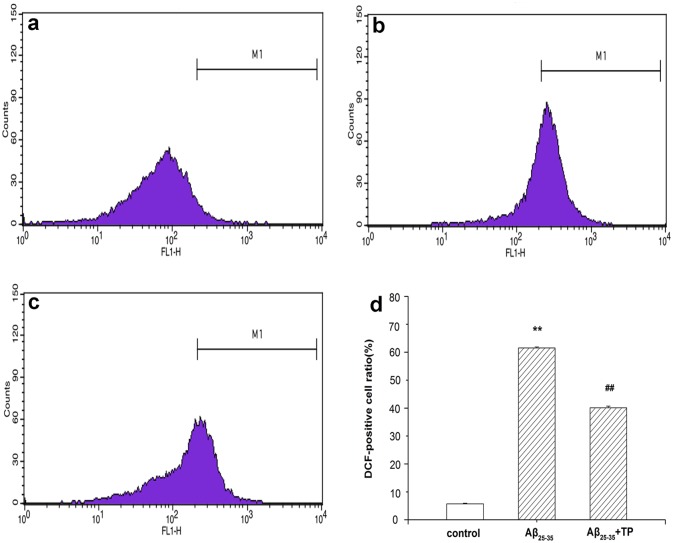
After treatment with different drugs (cell culture medium, 10 μmol/L Aβ25–35 and 10 μmol/L Aβ25–35+10−10 mol/L triptolide) for 24 hours, ROS was measured by flow cytometry. As shown in Fig 5, Aβ25–35 significantly increased ROS levels. When treated with 10−10 mol/L triptolide, the ratio of ROS decreased from 61.54% to 40.1%. The results reveal that treatment with triptolide could inhibit the intracellular ROS level induced by Aβ25–35 in differentiated PC12 cells.
Fig 5. Measurement of ROS generation.
ROS levels were determined by flow cytometric analysis. The level of ROS generation was calculated as follows: the level of ROS (%) = the percentage of DCF-positive cell in M1 region. Differentiated PC12 cells were incubated with 10 μmol/L Aβ25–35 (b), and 10 μmol/L Aβ25–35+10−10 mol/L triptolide (c) for 24 hours. Cells were cultured with culture medium (a). The bar graph is shown in (d). Data represents the mean ± S.E.M. n = 3/group. **P < 0.01 vs. control group. ## P < 0.01 vs. 10 μmol/L Aβ25–35 group.
Morphological change observations using acridine orange staining
Acridine orange is a nucleic acid dye that also enters acidic compartments, such as acidic vesicular organelles, where it becomes protonated and sequestered. Acridine orange staining is often used to detect the occurrence of autophagy. As shown in Fig 6a, green fluorescence with minimal orange fluorescence was displayed in the control group; in the Aβ25–35-treated cells the acidic compartments displayed orange fluorescence and green fluorescence with minimal orange fluorescence being displayed in the triptolide-treated cells. Moreover, acidic compartments of Aβ25–35-treated differentiated PC12 cells (the level of red fluorescence) were markedly more than triptolide -treated cells (P<0.01) in Fig 6b. Our data (the raw data was showed in S1 Table) provide evidence that the number of acidic vesicular organelles increased when the cells were treated with Aβ25–35, which means that autophagy processes were activated, and triptolide could inhibit autophagy.
Fig 6. Measurement of the acidic compartment in differentiated PC12 cells.
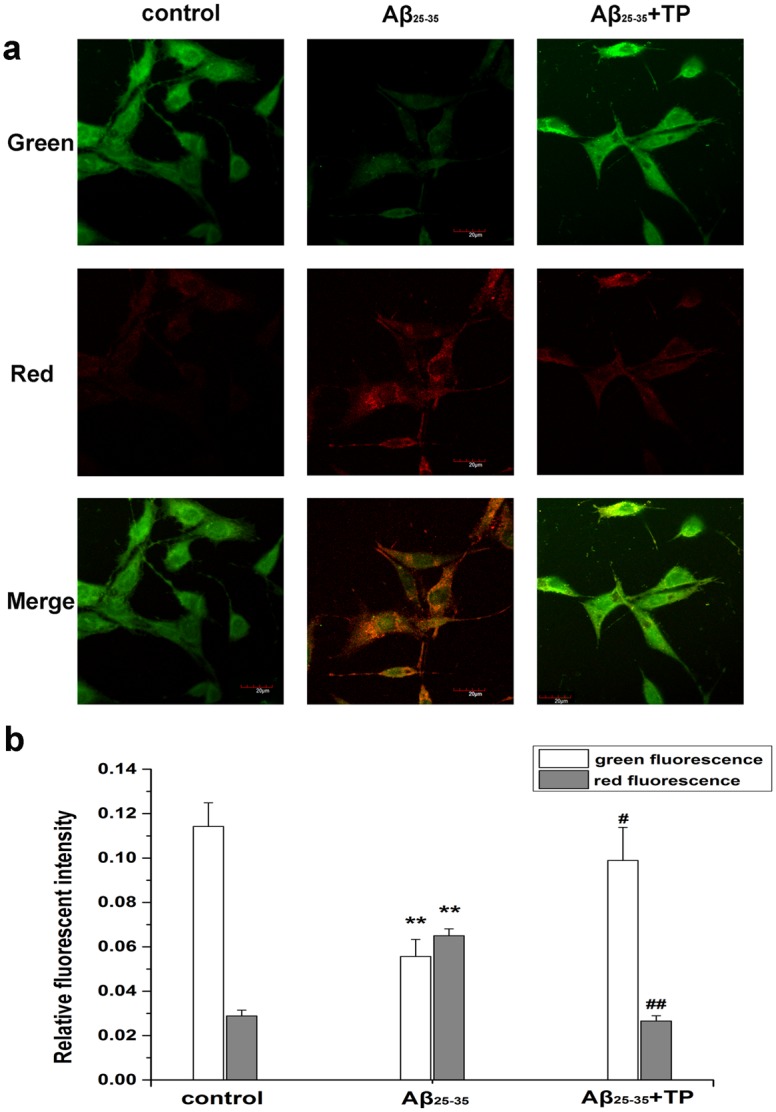
To characterize autophagy, we used acridine orange staining to observe the acidic compartment in differentiated PC12 cells. Cells were incubated with culture medium, 10 μmol/L Aβ25–35, 10 μmol/L Aβ25–35+10−10 mol/L triptolide for 24 hours. Cellular acidic compartments were stained to orange. Fig green cells with the green filter and Fig red with the red filter. Scale bar, 20 μm. Fig b was the corresponding linear diagram of relative fluorescent intensity. Data were presented as the means ±mean ± S.E.M. n = 7/group. **P < 0.01 vs. control group. # P < 0.05, ## P < 0.01 vs. 10 μmol/L Aβ25–35 group.
Morphological evaluation of autophagy
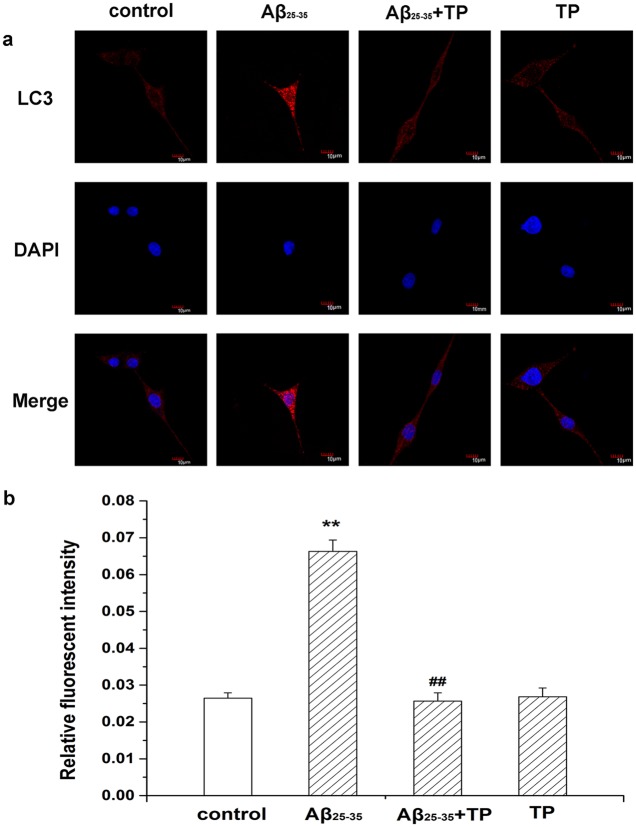
Staining with anti-LC3 is a recognized marker for autophagosomes. The fluorescence intensity and the number of bright fluorescent particles are related to the extent of lysosome acidity and these are used to predict the autophagy level. Additionally, in our study we addressed the distribution of LC3 in differentiated PC12 cells using confocal microscopy. As shown in Fig 7a, staining intensity and larger numbers of bright fluorescent particles in cells were visibly enhanced by Aβ25–35 treatment, indicating the presence of autophagosomes. The quantitative analysis in Fig 7b showed triptolide could inhibit the increase in the autophagy process induced by Aβ25–35(P<0.01). In addition, there was no significant difference with control cells in the triptolide only group (the raw data was showed in S2 Table).
Fig 7. Expression of LC3 in differentiated PC12 cells.
Morphological evaluation of autophagy in differentiated PC12 cells by immunofluorescence was acquired by confocal microscopy. The immunohistochemical staining showed that LC3 was expressed in the control group (cells treated with culture medium), 10 μmol/L Aβ25–35 group, 10 μmol/L Aβ25–35+10−10 mol/L triptolide group and 10−10 mol/L triptolide group. Scale bar, 10 μm. Fig b was the corresponding linear diagram of relative fluorescent intensity. Data were presented as the means ±mean ± S.E.M. n = 7/group. *P < 0.05, **P < 0.01 vs. control group. ## P < 0.01 vs. 10 μmol/L Aβ25–35 group.
The level of LC3 in differentiated PC12 cells
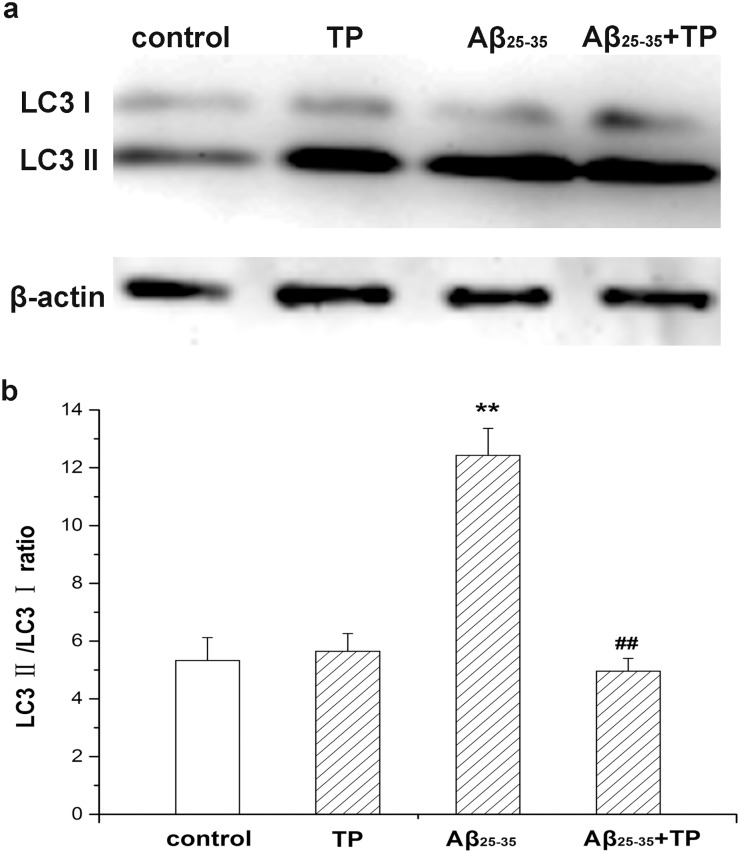
To identify the level of autophagy, the expression of LC3 was examined by Western blot analysis. Conjugated LC3, called LC3 II, is the canonical marker of autophagosomes. During autophagy, LC3 I is cleaved to LC3 II, while the LC3 II/LC3 I ratio increases. As a result, we found that the LC3 II/LC3 I ratio of Aβ25–35-treated cells increased compared to the control groups (the raw figure was showed in S1 Fig). When incubated with triptolide, the LC3 II/LC3 I ratio in differentiated PC12 cells was significantly decreased (Fig 8). Our experiments suggest that autophagy was greatly and continually activated when differentiated PC12 cells were treated with Aβ25–35 and triptolide could inhibit this autophagy process.
Fig 8. Ratio of LC3 II/LC3 I in differentiated PC12 cells.
Differentiated PC12 cells were determined by measuring expression of LC3 protein, which was the autophagosome marker, using Western blot analysis. Cells were incubated with culture medium, 10−10 mol/L triptolide, 10 μmol/L Aβ25–35, and 10 μmol/L Aβ25–35+10−10 mol/L triptolide for 24 hours. The corresponding linear diagram of immunoblotting quantitation is shown in (b). The ratio of LC3 II/LC3 I was evaluated by densitometry analysis and data were expressed as folds of the control. Data represents the mean ± S.E.M. n = 3/group. *P < 0.05, **P < 0.01 vs. control group. # P < 0.05, ## P < 0.01 vs. 10 μmol/L Aβ25–35 group.
Effect of 3-MA and rapamycin
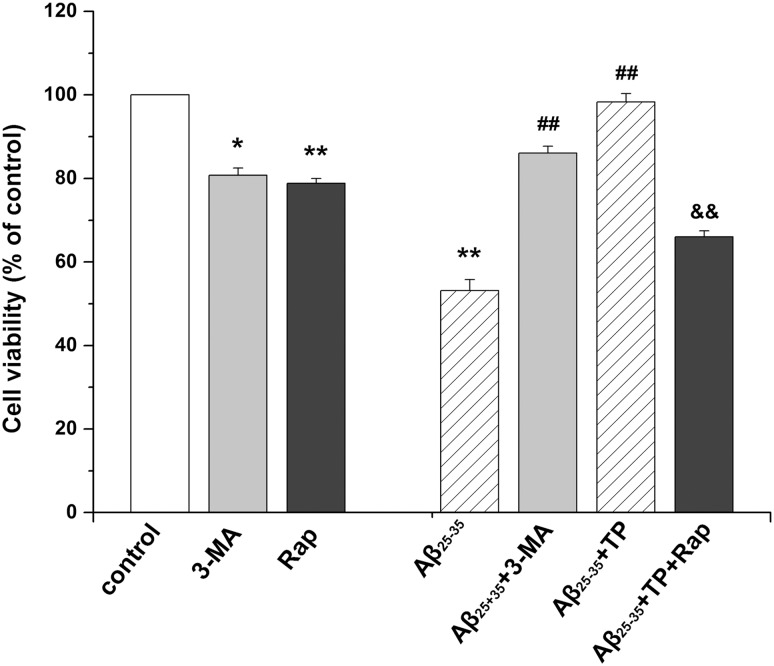
As shown in Fig 9, the viability of PC12 cells was decreased in the rapamycin group (P<0.01) and 3-MA group (P<0.05). Cell viability was increased in the Aβ25–35+ 3-MA group, and there was a significant difference between the Aβ25–35 + 3-MA -treated group and Aβ-treated group (P<0.01). Then, we determined the effects of the autophagy activator rapamycin in Aβ25–35+ triptolide-treated differentiated PC12 cells. The viability of PC12 cells treated with rapamycin was reduced, and there was a significant difference between the Aβ25–35+triptolide+rapamycin-treated group and the Aβ25–35+triptolide-treated group (P<0.01).
Fig 9. Effect of 3-MA and rapamycin.
Differentiated PC12 cells were incubated with culture medium, 10 μmol/L Aβ25–35, 10 μmol/L 3-MA, 10ng/mL rapamycin, 10 μmol/L Aβ25–35+10 μmol/L 3-MA, 10 μmol/L Aβ25–35+10−10 mol/L triptolide, and 10 μmol/L Aβ25–35+10−10 mol/L triptolide +10ng/mL rapamycin, for 24 hours. The cell viability was determined by MTT. Data represents the mean ± S.E.M. n = 6/group. *P < 0.05, **P < 0.01 vs. control group. # P < 0.05, ## P < 0.01 vs. 10 μmol/L Aβ25–35 group. & P < 0.05, && P < 0.01 vs.10 μmol/L Aβ25–35+10−10 mol/L triptolide group.
Discussion
AD is a devastating neurological disorder, and its hallmark pathologic characteristics are β-amyloid plaques, neurofibrillary tangles, and neurodegeneration. AD is a huge burden on society and patients’ families. Currently, due to rapidly aging populations, the prevalence of AD is growing exponentially. However, the pathogenesis of AD has not yet clearly been explained and there remains a dearth of effective treatments and cures. The deposition of Aβ was considered as a pathological hallmark of AD, and how to inhibit the cell apoptosis induced by Aβ was attracting considerable and increasing concern of the public [3].
Recent reports indicate that triptolide has neurotrophic and neuroprotective effects [40]. In our experiment, we investigated whether triptolide treatment could decelerate PC12 cells apoptosis, which treated with Aβ25–35. As a result, we found that Aβ25–35 was cytotoxic to differentiated PC12 cells and showed a concentration-dependent effect (Fig 1). In addition, the detection of apoptotic cells showed that the Aβ25–35 also induced the apoptosis of differentiated PC12 cells, which was significant between the control group and Aβ25–35 group (Fig 4). All of these results were consistent with previous studies indicating that Aβ25–35 could induce cell injury and death in differentiated PC12 cells [41, 42]. When treated with triptolide, the differentiated PC12 cells’ viability when incubated with Aβ25–35 increased. Additionally, triptolide also attenuated the apoptosis in differentiated PC12 cells induced by Aβ25–35, which implies that triptolide could protect differentiated PC12 cells with Aβ25–35. In addition, we also detected the effect of different concentrations of triptolide on differentiated PC12 cells because the safety of the drug is a crucial factor in clinical applications. As shown in Fig 3, differentiated PC12 cells were treated with different concentrations (10−11, 10−10, 10−9 mol/L) of triptolide for 24 hours, and there was no statistically significant difference in the cell viability between the control and triptolide group, which shows that our concentrations of triptolide were safe for differentiated PC12 cells.
Autophagy is an evolutionary conserved catabolic process used by eukaryotic cells for the degradation of damaged or superfluous proteins and organelles [43]. However, many scholars have found that excessive autophagy or autophagy activity perturbation were the arbiters in the formation and degradation of Aβ and tau protein [17] which might induce AD. Autophagy is regarded as a potential therapeutic target for AD.
Conventional wisdom suggests that ROS was one of the indicators of oxidative stress and an important factor in the apoptotic process [36, 44]. Accumulating evidence suggests that ROS act as signaling molecules involving a variety of intracellular processes. Furthermore, the intracellular excessive accumulation of ROS might mediate autophagy [45, 46]. For example, the addition of H2O2 could induce autophagy [47]. In some diseases, endogenous ROS levels were raised which then activated mitochondrial autophagy [47, 48]. In our research, the data of flow cytometry showed that the ROS level significantly increased when the differentiated PC12 cells were incubated with Aβ25–35, and treatment with triptolide could decrease the intracellular ROS level in cells (Fig 5). We speculated that Aβ25–35 might induce autophagy through elevating the ROS level in differentiated PC12 cells and triptolide protected the cell by reducing the generation of ROS to weaken autophagy induced by Aβ25–35. However, ROS could induce autophagy or play an important role in the process, and various circumstances could cause an increase of intracellular ROS. Meanwhile, we also found that ROS generation of triptolide group was intermediate of the Aβ25–35 group and higher than control group, which meant that the pathway activated by ROS was just one of mediators in autophagy.
Acridine orange is a fluorescent dye which stains acidic compartments (such as lysosomes and autolysosomes) orange/red, while it stains cytoplasm and nuclei bright green. Acidic vacuoles, which are formed by autophagosomes fusing with lysosomes, can usually bind acridine orange in the process of cells’ autophagy. Therefore, acridine orange staining is often used to detect the occurrence of autophagy [49, 50]. Furthermore, in Fig 6, Aβ25–35-treated cells showed an obvious increase in orange fluorescence compared with that of the control group (P<0.01), which was indicated by the level of red fluorescence. And triptolide could decrease the level of acidic vesicular organelle during the autophagy process (P<0.01).
To further determine whether the autophagy was activated, we detected the expression of LC3, which is an autophagosome marker [51, 52]. LC3 exists in cytosolic LC3 I and phosphatidylethanolamine (PE)-conjugated LC3 II forms [53, 54]. Autophagosomes transport to the lysosomes for forming autolysosomes and LC3 II is degraded in autolysosomal lumen at the same time. Thus, as a marker of autophagosomal membranes, changes in the cellular LC3 II level reflect starvation-induced autophagic activity [52, 55]. To monitor autophagy during the treatment with triptolide, we measured the expression of LC3 by immunofluorescence and the LC3 II/LC3 I ratio by Western blot. Fig 7 shows a more intensive fluorescence was detected and the number of stained lysosomes was much higher than that in control cells (P<0.01). Additionally, there was a decrease in the autophagy process in triptolide-treated Aβ25–35 incubated cells (P<0.01). As shown in Fig 8, the LC3 II/LC3 I ratio increased with time during the incubation of Aβ25–35. A remarkable decrease of the LC3 II/LC3 I ratio was seen in triptolide-treated groups during incubation of Aβ25–35. The level of LC3 II is directly associated with the number of autophagosomes, therefore, the results show that triptolide inhibits the cytotoxicity of differentiated PC12 cells induced by Aβ25–35 via the autophagy pathway.
3-MA is an inhibitor of the class I phosphatidylinositol 3-kinase (PI3K) [56]. Further in vitro enzymatic assays show that 3-methyladenine also inhibits class III PI3K activity [57]. Recent studies indicate that PI3K, especially class III PI3K, is essential in the regulation of autophagy. 3-MA inhibits autophagy by inhibition of these enzymes. Rapamycin is commonly used as a specific activator of autophagic sequestration. The literature observes that the increase is accompanied by a significant increase in autophagy due to the mammalian target of the rapamycin (mTOR) pathway inhibition [58]. As a result, cell viability was increased by 3-MA, and there was a significant difference between the Aβ25–35 +3-MA-treated group and Aβ-treated group (P<0.01). 10 ng/mL of rapamycin could markedly reduce the viability compared with the triptolide-treated group (P<0.01) (Fig 9). These results further confirm that autophagy plays an important role in the protection of triptolide on differentiated PC12 cells.
In summary, we discovered that Aβ25–35 could induce cell death and cell apoptosis via the activation of autophagy in differentiated PC12 cells. Furthermore, triptolide has a protective effect against Aβ25–35-induced cytotoxicity in differentiated PC12 cells by inhibiting the autophagy pathway. In our further experiments, we will detect the molecular signaling mechanism of oxidative stress (because of the generation of ROS in triptolide group) and investigate whether triptolide inhibits autophagy in an mTOR-dependent manner (because of the function of rapamycin), and we will also check the effect of triptolide in primary cells and in in vivo models to compare the difference of the molecular signaling mechanism of autophagy in pathogenesis of AD between in vivo and in vitro. These results may suggest that triptolide will be a promising tool for AD research. It will be helpful to provide an interesting view of the potential application of triptolide or TWHF in the future study of AD.
Supporting Information
Fig a was the expression of LC3 I and LC3 II. Fig b was the expression of β-actin on the same Western blot sample.
(TIF)
For the quantitation analysis, red fluorescent intensity and green fluorescent intensity were quantified using IPP 6.0.
(DOCX)
For the quantitation analysis, fluorescent intensity was quantified using IPP 6.0.
(DOCX)
Data Availability
All relevant data are within the paper and its Supporting Information files.
Funding Statement
The authors have no support or funding to report.
References
- 1. Reitz C, Brayne C, Mayeux R. Epidemiology of Alzheimer disease. Nature Reviews Neurology. 2011;7(3):137–52. 10.1038/nrneurol.2011.2 [DOI] [PMC free article] [PubMed] [Google Scholar]
- 2. Mielke MM, Vemuri P, Rocca WA. Clinical epidemiology of Alzheimer’s disease: assessing sex and gender differences. Clinical Epidemiology. 2014;6:37 10.2147/CLEP.S37929 [DOI] [PMC free article] [PubMed] [Google Scholar]
- 3. Hardy J, Selkoe DJ. The amyloid hypothesis of Alzheimer's disease: progress and problems on the road to therapeutics. Science. 2002;297(5580):353–6. [DOI] [PubMed] [Google Scholar]
- 4. Adlard PA, James SA, Bush AI, Masters CL. beta-Amyloid as a molecular therapeutic target in Alzheimer's disease. Drugs of today (Barcelona, Spain: 1998). 2009;45(4):293–304. [DOI] [PubMed] [Google Scholar]
- 5. Bates K, Verdile G, Li Q, Ames D, Hudson P, Masters C, et al. Clearance mechanisms of Alzheimer's amyloid-β peptide: implications for therapeutic design and diagnostic tests. Molecular psychiatry. 2008;14(5):469–86. 10.1038/mp.2008.96 [DOI] [PubMed] [Google Scholar]
- 6. Hamaguchi T, Ono K, Yamada M. Anti-amyloidogenic therapies: strategies for prevention and treatment of Alzheimer’s disease. Cellular and Molecular Life Sciences CMLS. 2006;63(13):1538–52. [DOI] [PMC free article] [PubMed] [Google Scholar]
- 7. Ułamek-Kozioł M, Furmaga-Jabłońska W, Januszewski S, Brzozowska J, Ściślewska M, Jabłoński M, et al. Neuronal Autophagy: Self-eating or Self-cannibalism in Alzheimer’s Disease. Neurochemical research. 2013;38(9):1769–73. 10.1007/s11064-013-1082-4 [DOI] [PMC free article] [PubMed] [Google Scholar]
- 8. De Duve C, editor The lysosome concept Ciba Foundation Symposium-Lysosomes; 1963: Wiley Online Library. [Google Scholar]
- 9. Nelson MP, Shacka JJ. Autophagy Modulation in Disease Therapy: Where Do We Stand? Current Pathobiology Reports. 2013;1(4):239–45. [DOI] [PMC free article] [PubMed] [Google Scholar]
- 10. Martinez-Vicente M, Cuervo AM. Autophagy and neurodegeneration: when the cleaning crew goes on strike. Lancet Neurol. 2007. April;6(4):352–61. WOS:000245145000016. English. [DOI] [PubMed] [Google Scholar]
- 11. Nixon RA, Yang DS, Lee JH. Neurodegenerative lysosomal disorders—A continuum from development to late age. Autophagy. 2008. July 1;4(5):590–9. WOS:000257596600008. English. [DOI] [PubMed] [Google Scholar]
- 12. Tooze SA, Schiavo G. Liaisons dangereuses: autophagy, neuronal survival and neurodegeneration. Curr Opin Neurobiol. 2008. October;18(5):504–15. WOS:000261755000006. English. 10.1016/j.conb.2008.09.015 [DOI] [PubMed] [Google Scholar]
- 13. Ghavami S, Shojaei S, Yeganeh B, Ande SR, Jangamreddy JR, Mehrpour M, et al. Autophagy and apoptosis dysfunction in neurodegenerative disorders. Prog Neurobiol. 2014. January;112:24–49. 10.1016/j.pneurobio.2013.10.004 [DOI] [PubMed] [Google Scholar]
- 14. Banerjee R, Starkov AA, Beal MF, Thomas B. Mitochondrial dysfunction in the limelight of Parkinson's disease pathogenesis. Biochimica et biophysica acta. 2009. July;1792(7):651–63. PMCID: 2867353. 10.1016/j.bbadis.2008.11.007 [DOI] [PMC free article] [PubMed] [Google Scholar]
- 15. Tellez-Nagel I, Johnson AB, Terry RD. Studies on brain biopsies of patients with Huntington's chorea. J Neuropathol Exp Neurol. 1974. April;33(2):308–32. . [DOI] [PubMed] [Google Scholar]
- 16. Sawa A, Nagata E, Sutcliffe S, Dulloor P, Cascio MB, Ozeki Y, et al. Huntingtin is cleaved by caspases in the cytoplasm and translocated to the nucleus via perinuclear sites in Huntington's disease patient lymphoblasts. Neurobiol Dis. 2005. November;20(2):267–74. . [DOI] [PubMed] [Google Scholar]
- 17. Caccamo A, Majumder S, Richardson A, Strong R, Oddo S. Molecular Interplay between Mammalian Target of Rapamycin (mTOR), Amyloid-β, and Tau EFFECTS ON COGNITIVE IMPAIRMENTS. Journal of Biological Chemistry. 2010;285(17):13107–20. 10.1074/jbc.M110.100420 [DOI] [PMC free article] [PubMed] [Google Scholar]
- 18. Hung S-Y, Huang W-P, Liou H-C, Fu W-M. Autophagy protects neuron from Abeta-induced cytotoxicity. Autophagy. 2009;5(4):502–10. [DOI] [PubMed] [Google Scholar]
- 19. Banerjee R, Beal MF, Thomas B. Autophagy in neurodegenerative disorders: pathogenic roles and therapeutic implications. Trends in neurosciences. 2010;33(12):541–9. 10.1016/j.tins.2010.09.001 [DOI] [PMC free article] [PubMed] [Google Scholar]
- 20. Jaeger PA, Wyss-Coray T. All-you-can-eat: autophagy in neurodegeneration and neuroprotection. Mol Neurodegener. 2009;4(1):16. [DOI] [PMC free article] [PubMed] [Google Scholar]
- 21. Nixon RA, Wegiel J, Kumar A, Yu WH, Peterhoff C, Cataldo A, et al. Extensive involvement of autophagy in Alzheimer disease: an immuno-electron microscopy study. Journal of Neuropathology & Experimental Neurology. 2005;64(2):113–22. [DOI] [PubMed] [Google Scholar]
- 22. Pickford F, Masliah E, Britschgi M, Lucin K, Narasimhan R, Jaeger PA, et al. The autophagy-related protein beclin 1 shows reduced expression in early Alzheimer disease and regulates amyloid β accumulation in mice. The Journal of clinical investigation. 2008;118(6):2190–9. 10.1172/JCI33585 [DOI] [PMC free article] [PubMed] [Google Scholar]
- 23. Han YG, Xu J, Li ZG, Yang Z. Neuroprotective Effect of Leukemia Inhibitory Factor on Antimycin A-Induced Oxidative Injury in Differentiated PC12 Cells. Journal of Molecular Neuroscience. 2013. July;50(3):577–85. WOS:000320048400021. English. 10.1007/s12031-013-0004-x [DOI] [PubMed] [Google Scholar]
- 24. Kirkland RA, Adibhatla RM, Hatcher JF, Franklin JL. Loss of cardiolipin and mitochondria during programmed neuronal death: Evidence of a role for lipid peroxidation and autophagy. Neuroscience. 2002;115(2):587–602. WOS:000179370600026. English. [DOI] [PubMed] [Google Scholar]
- 25. Xue LZ, Fletcher GC, Tolkovsky AM. Autophagy is activated by apoptotic signalling in sympathetic neurons: An alternative mechanism of death execution. Mol Cell Neurosci. 1999. September;14(3):180–98. WOS:000082633900002. English. [DOI] [PubMed] [Google Scholar]
- 26. Zheng Y, Zhang WJ, Wang XM. Triptolide with potential medicinal value for diseases of the central nervous system. CNS neuroscience & therapeutics. 2013;19(2):76–82. [DOI] [PMC free article] [PubMed] [Google Scholar]
- 27. Tao X, Davis LS, Lipsky PE. Effect of an extract of the Chinese herbal remedy Tripterygium wilfordii Hook F on human immune responsiveness. Arthritis & Rheumatism. 1991;34(10):1274–81. [DOI] [PubMed] [Google Scholar]
- 28. Tao X, Lipsky PE. The Chinese anti-inflammatory and immunosuppressive herbal remedy Tripterygium wilfordii Hook F. Rheumatic Disease Clinics of North America. 2000;26(1):29–50. [DOI] [PubMed] [Google Scholar]
- 29. Brinker AM, Ma J, Lipsky PE, Raskin I. Medicinal chemistry and pharmacology of genus Tripterygium (Celastraceae). Phytochemistry. 2007;68(6):732–66. [DOI] [PMC free article] [PubMed] [Google Scholar]
- 30. Kupchan SM C W, Dailey RG Jr, Gilmore CJ, Bryan RF. Triptolide and tripdiolide, novel anti-leukemic diterpenoid triepoxides from Tripterygium wilfordii. J Amer Chem Soc. 1972;95:7194–5. [DOI] [PubMed] [Google Scholar]
- 31. Lin N, Sato T, Ito A. Triptolide, a novel diterpenoid triepoxide from Tripterygium wilfordii Hook. f., suppresses the production and gene expression of pro–matrix metalloproteinases 1 and 3 and augments those of tissue inhibitors of metalloproteinases 1 and 2 in human synovial fibroblasts. Arthritis & Rheumatism. 2001;44(9):2193–200. [DOI] [PubMed] [Google Scholar]
- 32. Abbott NJ, Patabendige AAK, Dolman DEM, Yusof SR, Begley DJ. Structure and function of the blood-brain barrier. Neurobiol Dis. 2010. January;37(1):13–25. WOS:000272533000003. English. 10.1016/j.nbd.2009.07.030 [DOI] [PubMed] [Google Scholar]
- 33. Geng Y, Fang MR, Wang J, Yu HY, Hu ZY, Yew DT, et al. Triptolide Down-regulates COX-2 Expression and PGE2 Release by Suppressing the Activity of NF-?B and MAP kinases in Lipopolysaccharide-treated PC12 Cells. Phytotherapy Research. 2012. March;26(3):337–43. WOS:000301179300004. English. 10.1002/ptr.3538 [DOI] [PubMed] [Google Scholar]
- 34. Gu M, Zhou H, Xue B, Niu D, He Q, Wang X. Effect of Chinese herb Tripterygium wilfordii Hook F monomer triptolide on apoptosis of PC12 cells induced by Abeta1-42. Sheng li xue bao:[Acta physiologica Sinica]. 2004;56(1):73–8. [PubMed] [Google Scholar]
- 35. He Q, Zhou H, Xue B, Niu D, Wang X. Neuroprotective effects of Tripterygium Wilforddi Hook F monomer T10 on glutamate induced PC12 cell line damage and its mechanism. Beijing da xue xue bao Yi xue ban = Journal of Peking University Health sciences. 2003;35(3):252–5. [PubMed] [Google Scholar]
- 36. Xu P, Xu J, Liu S, Ren G, Yang Z. In vitro toxicity of nanosized copper particles in PC12 cells induced by oxidative stress. Journal of Nanoparticle Research. 2012;14(6):1–9.22448125 [Google Scholar]
- 37. AS T. Chromaffin cells as models of endocrine cells and neurons. Ann N Y Acad Sci 2002;971:366–70. PMCID: 12438154. [DOI] [PubMed] [Google Scholar]
- 38. Chen T, Wang C, Wu F, Zhang X, Yang H, Deng X, et al. Altered localization of p120 catenin in the cytoplasm rather than the membrane correlates with poor prognosis in esophageal squamous cell carcinoma. PLoS One. 2015;10(3):e0118645 PMCID: 4364898. 10.1371/journal.pone.0118645 [DOI] [PMC free article] [PubMed] [Google Scholar]
- 39. Wang H, Gao N, Li Z, Yang Z, Zhang T. Autophagy Alleviates Melamine-Induced Cell Death in PC12 Cells Via Decreasing ROS Level. Molecular neurobiology. 2015. March 1 . [DOI] [PubMed] [Google Scholar]
- 40. Gao J-P, Sun S, Li W-W, Chen Y-P, Cai D-F. Triptolide protects against 1-methyl-4-phenyl pyridinium-induced dopaminergic neurotoxicity in rats: implication for immunosuppressive therapy in Parkinson’s disease. Neuroscience bulletin. 2008;24(3):133–42. 10.1007/s12264-008-1225-9 [DOI] [PMC free article] [PubMed] [Google Scholar]
- 41. Huang D, Khoe M, Befekadu M, Chung S, Takata Y, Ilic D, et al. Focal adhesion kinase mediates cell survival via NF-κB and ERK signaling pathways. American Journal of Physiology-Cell Physiology. 2007;292(4):C1339–C52. [DOI] [PubMed] [Google Scholar]
- 42. Zhang R, Xu J, Liu Y-y, Zuo P-p, Yang N, Ji C, et al. Propofol may protect PC12 cells from β-amyloid25–35 induced apoptosis through the GSK-3β signaling pathway. Chinese medical journal. 2013;126(10):1884–9. [PubMed] [Google Scholar]
- 43. Chen Y, Klionsky DJ. The regulation of autophagy–unanswered questions. Journal of cell science. 2011;124(2):161–70. [DOI] [PMC free article] [PubMed] [Google Scholar]
- 44. Lee EA, Seo JY, Jiang Z, Yu MR, Kwon MK, Ha H, et al. Reactive oxygen species mediate high glucose–induced plasminogen activator inhibitor-1 up-regulation in mesangial cells and in diabetic kidney. Kidney international. 2005;67(5):1762–71. [DOI] [PubMed] [Google Scholar]
- 45. Chen Y, Gibson SB. Is mitochondrial generation of reactive oxygen species a trigger for autophagy? Autophagy. 2007;4(2):246–8. [DOI] [PubMed] [Google Scholar]
- 46. Lin M-H, Hsieh W-F, Chiang W-F, Hong W-Z, Hsu Y-R, Cheng Y-C, et al. Autophagy induction by the 30–100kDa fraction of areca nut in both normal and malignant cells through reactive oxygen species. Oral oncology. 2010;46(11):822–8. 10.1016/j.oraloncology.2010.08.002 [DOI] [PubMed] [Google Scholar]
- 47. Xu Y-N, Cui X-S, Sun S-C, Lee S-E, Li Y-H, Kwon J-S, et al. Mitochondrial dysfunction influences apoptosis and autophagy in porcine parthenotes developing in vitro. Journal of Reproduction and Development. 2011;57(1):143–50. [DOI] [PubMed] [Google Scholar]
- 48. Baregamian N, Song J, Bailey CE, Papaconstantinou J, Evers BM, Chung DH. Tumor necrosis factor-α and apoptosis signal-regulating kinase 1 control reactive oxygen species release, mitochondrial autophagy and c-Jun N-terminal kinase/p38 phosphorylation during necrotizing enterocolitis. Oxidative medicine and cellular longevity. 2009;2(5):297–306. 10.4161/oxim.2.5.9541 [DOI] [PMC free article] [PubMed] [Google Scholar]
- 49. Luo TF, Liu GY, Ma HX, Lu B, Xu HY, Wang YJ, et al. Inhibition of Autophagy via Activation of PI3K/Akt Pathway Contributes to the Protection of Ginsenoside Rb1 against Neuronal Death Caused by Ischemic Insults. International journal of molecular sciences. 2014. September;15(9):15426–42. WOS:000343109700033. English. 10.3390/ijms150915426 [DOI] [PMC free article] [PubMed] [Google Scholar]
- 50. Wei MM, Li ZG, Yang Z. Crosstalk between protective autophagy and NF-kappa B signal in high glucose-induced podocytes. Mol Cell Biochem. 2014. September;394(1–2):261–73. WOS:000340489800027. English. 10.1007/s11010-014-2102-7 [DOI] [PubMed] [Google Scholar]
- 51. Mizushima N, Yoshimori T, Levine B. Methods in mammalian autophagy research. Cell. 2010;140(3):313–26. 10.1016/j.cell.2010.01.028 [DOI] [PMC free article] [PubMed] [Google Scholar]
- 52. Tanida I, Minematsu-Ikeguchi N, Ueno T, Kominami E. Research Paper Lysosomal Turnover, but Not a Cellular Level, of Endogenous LC3 is a Marker for Autophagy. Autophagy. 2005;1(2):84–91. [DOI] [PubMed] [Google Scholar]
- 53. Kabeya Y, Mizushima N, Ueno T, Yamamoto A, Kirisako T, Noda T, et al. LC3, a mammalian homologue of yeast Apg8p, is localized in autophagosome membranes after processing. The EMBO journal. 2000;19(21):5720–8. [DOI] [PMC free article] [PubMed] [Google Scholar]
- 54. Kabeya Y, Mizushima N, Yamamoto A, Oshitani-Okamoto S, Ohsumi Y, Yoshimori T. LC3, GABARAP and GATE16 localize to autophagosomal membrane depending on form-II formation. Journal of cell science. 2004;117(13):2805–12. [DOI] [PubMed] [Google Scholar]
- 55. Tanida I, Ueno T, Kominami E. LC3 and Autophagy. Autophagosome and Phagosome Methods in Molecular Biology™: Springer; 2008. p. 77–88. [DOI] [PubMed] [Google Scholar]
- 56. Blommaart EF, Krause U, Schellens JP, Vreeling‐Sindelárová H, Meijer AJ. The phosphatidylinositol 3‐kinase inhibitors wortmannin and LY294002 inhibit autophagy in isolated rat hepatocytes. European Journal of Biochemistry. 1997;243(1–2):240–6. [DOI] [PubMed] [Google Scholar]
- 57. Petiot A, Ogier-Denis E, Blommaart EF, Meijer AJ, Codogno P. Distinct classes of phosphatidylinositol 3′-kinases are involved in signaling pathways that control macroautophagy in HT-29 cells. Journal of Biological Chemistry. 2000;275(2):992–8. [DOI] [PubMed] [Google Scholar]
- 58. Ristic B, Bosnjak M, Arsikin K, Mircic A, Suzin-Zivkovic V, Bogdanovic A, et al. Idarubicin induces mTOR-dependent cytotoxic autophagy in leukemic cells. Experimental Cell Research. 2014;326(1):90–102. 10.1016/j.yexcr.2014.05.021 [DOI] [PubMed] [Google Scholar]
Associated Data
This section collects any data citations, data availability statements, or supplementary materials included in this article.
Supplementary Materials
Fig a was the expression of LC3 I and LC3 II. Fig b was the expression of β-actin on the same Western blot sample.
(TIF)
For the quantitation analysis, red fluorescent intensity and green fluorescent intensity were quantified using IPP 6.0.
(DOCX)
For the quantitation analysis, fluorescent intensity was quantified using IPP 6.0.
(DOCX)
Data Availability Statement
All relevant data are within the paper and its Supporting Information files.


