Abstract
The high concentration of N-acetylaspartate (NAA) in neurons of the central nervous system and its growing clinical use as an indicator of neuronal viability has intensified interest in the biological function of this amino acid derivative. The biomedical relevance of such inquiries is highlighted by the myelin-associated pathology of Canavan disease, an inherited childhood disorder resulting from mutation of aspartoacylase (ASPA), the NAA-hydrolyzing enzyme. This enzyme is known to be localized in oligodendrocytes with bimodal distribution in cytosol and the myelin sheath, and to produce acetyl groups utilized in myelin lipid synthesis. Loss of this acetyl source in Canavan disease and rodent models such as the tremor rat are thought to account for the observed myelin deficit. This study was undertaken to further define and quantify the specific lipid abnormalities that occur as a result of ASPA deficit in the tremor rat. Employing mass spectrometry together with high performance thin-layer chromatography, we found that myelin from 28-day-old animals showed major reduction in cerebrosides (CB) and sulfatides (Sulf) with unsubstituted fatty acids, and equal if not greater changes in myelin from 7-month-old tremors. Cerebrosides with 2-hydroxyfatty acids showed little if any change at either age; Sulf with 2-hydroxyfatty acids showed no significant change at 28 days, but surprisingly a major increase at 7 months. Two species of phosphatidylcholine, 32:0 and 34:1, also showed significant increase, but only at 28 days. One form of phosphatidylethanolamine, PE36:1, was reduced a modest amount at both ages, whereas the plasmalogen form did not change. The dysmyelination that results from inactivation of ASPA is thus characterized by selective decreases as well as some increases in specific lipids.
Keywords: Tremor rat, Myelin lipids, N-acetylaspartate, Axon-myelin interaction, Myelin-localized enzymes, Aspartoacylase
Introduction
The tremor rat (tm/tm) was first discovered as a genetic mutant in the inbred colony of Kyoto:Wistar rats and was shown to experience spontaneous seizures plus spongiform degeneration in the central nervous system (CNS) [1, 2]. The genetic defect in these animals involves deletion of the aspartoacylase (ASPA; N-acetyl-L-aspartate amidohydrolase) gene, a feature that has made it a naturally occurring model of Canavan disease. This autosomal recessive childhood disorder is characterized by CNS swelling and spongy degeneration of white matter, along with accumulation of N-acetylaspartate (NAA) in brain and urine [3, 4]. White matter pathology in rodent models, such as the ASPA-null knockout mouse, was shown to involve myelin vacuolization as a feature of dysmyelination and/or demyelination [5]. Those findings were consistent with previous reports suggesting a vital role for ASPA and its NAA substrate in myelination, including the finding of incorporation of the acetyl component of NAA into brain-and myelin lipids [6–8]. This concept was extended in a subsequent study showing that NAA localized in the neuron/axon contributed acetyl groups that were incorporated into ensheathing myelin lipids [9]. These findings served to provide a rationale for the unusual metabolic compartmentalization, according to which NAA is synthesized and localized in the neuron [10, 11], but metabolized by ASPA in the oligodendrocyte where this enzyme is localized [12, 13]. A recent study demonstrated bimodal distribution of ASPA between cytosol and myelin [14]. Utilization of liberated acetyl groups in this manner is consistent with the large number of lipid-synthesizing enzymes shown by several groups to be present in the myelin membrane (for review: [15, 16]), including fatty acid synthase and acetyl-CoA carboxylase [17]. N-Acetylaspartate is thus viewed as undergoing axon-to-myelin transfer by an as yet undetermined mechanism, as one form of neuronal support of myelination.
The fact that CNS myelin, albeit abnormal, is produced in the CNS of Canavan patients and rodent models indicates that NAA is not the sole or even primary source of acetyl groups for that purpose; these likely arise from carbohydrate and lipid metabolism in the oligodendrocyte cell body followed by translocation to myelin. However, the observed deficits in total myelin suggest a substantial contribution from NAA and raise the question of possible specificity in regard to lipid changes. A partial answer was provided in the recent observation that cerebrosides (CB) and sulfatides (Sulf), characteristic lipids of myelin, showed marked depletion in the human disorder [18] as well as a mouse mutant [19]. The present study provides a more detailed examination of this question based on matrix-assisted laser desorption/ionization—time of flight mass spectrometry (MALDI-TOFMS) in conjunction with high performance thin layer chromatography (HPTLC). MALDI-TOFMS permitted identification of specific molecular species of myelin lipids that are depleted and revealed the unexpected finding that certain lipids are elevated in tremor myelin. We also show that the nature and magnitude of lipid changes are age dependent.
Methods
Animals and Materials
Brains from tremor rats of two ages, 28 days (28d) and 7 months (7 m), were used in this study. Controls for the 28d tremors were heterozygote (HT) and wild-type (WT) littermates, while for 7-month-old tremors we employed 7 month-old WT rats from Charles River Laboratories. Other substances were obtained from the following sources: lipid standards, including brain lipids and synthetic phosphatidylcholine (PC with fatty acids 13:0 and 12:0 = PC25), from Avanti Polar Lipids, (Alabaster, AL); protease inhibitor cocktails from Sigma (St. Louis, MO, USA) and Roche (Mannheim, Germany); HPTLC, silica gel 60 coated plates, from EM Scientific (Gibbstown, NJ, USA); chemicals from Sigma (St. Louis, MO, USA) and solvents from J.T. Baker (Phillipsburg, NJ, USA).
Sample Preparations
Three pairs of animals, tremor (TM) and normal (WT), were the sources of rat brain samples. Hemispheres were each homogenized in 20 volumes of 20 mM Tris buffer (pH 7.8) containing 1 mM dithiothreitol and centrifuged at 18,000 g for 30 min. The resulting pellet was subjected to myelin purification as previously described, employing discontinuous sucrose gradient centrifugation [17]. Prote-ase inhibitor cocktail was present in all operations, which were carried out in the cold. Protein was assayed by the method of Lees and Paxman [20], designed for difficultly soluble proteins such as those found in CNS myelin.
For lipid extraction, samples of myelin or tissue homogenate were extracted with 10 volumes of chloroform/methanol (C/M) (1/1) by vortexing and sonicating for 5 min; after brief centrifugation the supernatant was removed and the resulting pellet re-extracted with C/M (2/1). The combined supernatants were evaporated to dryness with an N2 stream and the solid residue solubilized with a small volume of C/M (1/1). This was transferred to a siliconized glass vial, dried with an N2 steam and redissolved in an amount of C/M (1/1) to a concentration of 1 mg protein/ml. To protect the lipids from oxidation, the organic solvents contained 100 μg/ml of 2,6-di-tert-butyl-4-methylphenol (BHT).
Lipid Analysis
Lipids were analyzed by one- and two-dimensional HPTLC on silica gel 60 plates, the applied sample sizes corresponding to equal amounts of tissue protein in each run (whole brain, 20–40 μg; myelin, 10–20 μg). The following solvent systems were employed: system I = C/M/acetic acid/formic acid/water (35/15/6/2/1, by vol.); system II = hexane/ethyl acetate (7/3, v/v); system III = C/M/aq. KCl, 0.25% (30/20/1, by vol.); system IV = C/M/water (85/15/0.5, by vol.). One-dimensional HPTLC (1D-TLC) of total myelin lipids was carried out with solvent system I. The dried plate was sprayed with 3% cupric acetate in 8% phosphoric acid and heated at 150°C for 10 min to visualize the lipid bands. A FluoChem TM digital imaging system was used to determine band densities, which were quantified by comparing to standard curves obtained with bovine brain lipids on the same plate. Validity of the densitometric analyses was established by showing linearity of imaging-determined band densities with amount of lipid applied to the HTPLC plate. At least three plates were run for each sample, and the results averaged. Statistical significance of differences between TM and WT lipids were calculated by the unpaired Student’s t-test.
With 1D-TLC there was overlap between phosphatidylcholine (PC) and two acidic phospholipids: phosphatidylserine (PS) and phosphatidylinositol (PI). These acidic lipids, together with Sulf, were removed in some runs by passing the myelin lipids through a DEAE-Sephadex column [21]; the resulting effluent contained only uncharged and zwitterionic lipids which were separated by sequential use of solvent systems I and II in the same direction. For separation of myelin lipids by 2D-TLC, the plate was developed with solvent system I ascending 10 cm. After drying, the plate was redeveloped with solvent system III perpendicular to the first run. The plate was dried and the lipids revealed and quantified as above.
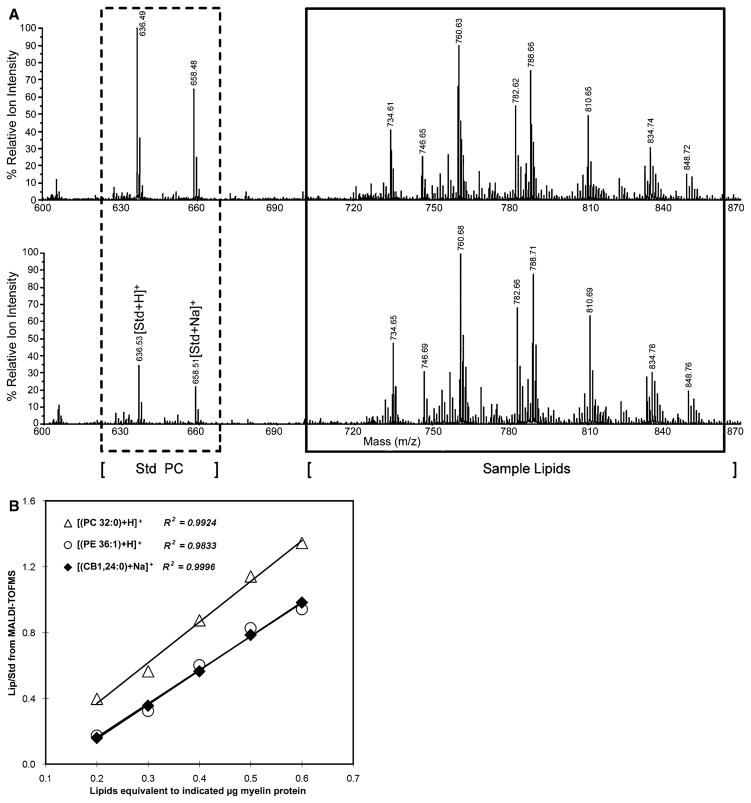
MALDI-TOFMS analysis of lipids was carried out by mixing one volume of the above C/M (1/1) solution of myelin Iipids (corresponding to 1 mg protein/ml) with an equal volume of matrix solution containing 77 mg/ml 2,5-dihydroxybenzoic acid and 0.1% trifluoroacetic acid in methanol. This was spotted onto a MALDI plate and analyzed with a 4700 Proteomics Analyzer tandem mass spectrometer (Applied Biosystem Inc., Framingham, MA, USA). Mass spectra (m/z: 300–1000) were acquired in positive ion reflector mode. Assignment of lipid species was based on monoisotopic molecular masses with comparison to lipid standards. To quantify individual lipids, we employed as internal standard (Std) synthetic PC with fatty acids 12:0–13:0 (PC25) which gave ion peaks at 636.50 [M + H]+ and 658.49 [M + Na]+ whose intensities were added. These were compared to summed peaks obtained for individual lipids (Lip). To determine linearity between the ratio of Lip/Std and sample amounts, 100 ng Std was mixed with variable amounts of WT myelin lipid standards, corresponding to 0.2, 0.3, 0.4, 0.5 and 0.6 μg myelin protein and subjected to MALDI-TOFMS analysis. Each sample was loaded to three different spots of the MALDI plate and each spot was ionized and the spectra recorded at least three times. Figure 1a indicates the kind of mass spectral data that was used to generate standard curves. The intensities of the monoisotopic peaks corresponding to protonated and sodiated species were added and Lip/Std ratios used for quantification. Linearity of response was obtained for each of the lipids analyzed (Fig. 1b). Percentage changes were calculated and statistical significance estimated by the unpaired Student’s t-test.
Fig. 1.
Use of internal standard with MALDI-TOFMS. (a) A fixed amount (100 ng) of Internal standard (Std), consisting of synthetic PC25 (12:0 and 13:0 fatty acids), was added to variable amounts of lipid (Lip) from WT rat myelin, corresponding to 0.2 μg (top) and 0.6 μg (bottom) of myelin protein. (b) Linear relation of Lip/Std to amount of analyzed myelin lipid, using fixed amount (100 ng) of PC25 internal standard
Results
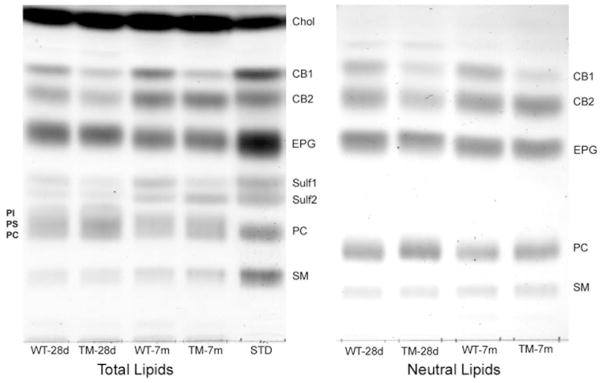
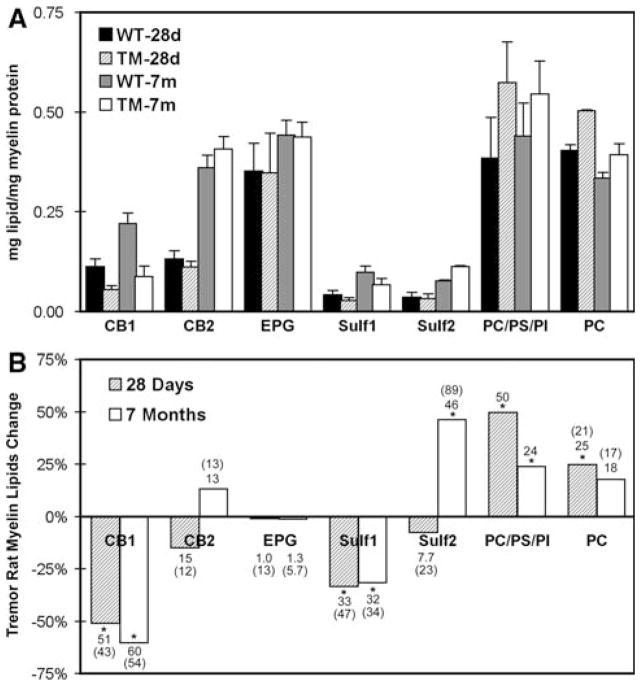
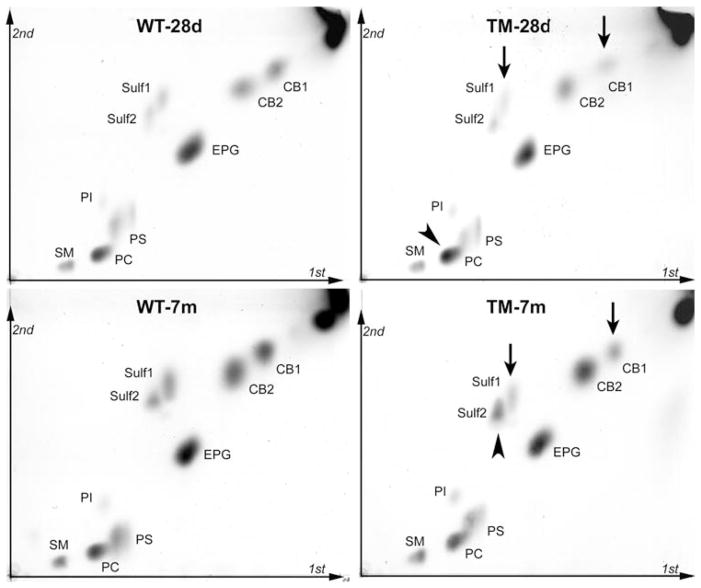
Specific lipids in purified myelin from TM and WT rats were quantified by a combination of HPTLC and MALDI-TOFMS. Whereas cholesterol showed no change relative to myelin protein in mutant myelin, the lipids for which we were able to observe significant changes included CB, Sulf, PC, and PE. The direction and magnitude of change differed between young (28d) and mature (7 m) animals. One-dimensional HPTLC was applied to two different preparations: total myelin lipids, and myelin lipids from which acidic lipid components were removed by chromatography on DEAE-Sephadex; the latter step was necessary for accurate determination of PC since this lipid overlapped on 1D-TLC with PS and PI (Fig. 2). Using these 1D-TLC methods, we observed the most dramatic change in the faster migrating band of the cerebroside doublet (CB1), which contains unsubstituted fatty acids in the ceramide unit; this amounted to decreases of 51% and 60% for 28d- and 7 m-myelin, respectively (Fig. 3). The slower migrating cerebroside band, CB2, which contains 2-OH substituted fatty acids, showed a modest and apparently insignificant decrease at 28d and no significant change at 7 m. Sulfatides, closely related structurally to CB, showed significant decreases at both 28d (33%) and 7 m (31%) in the case of Sulf1, the faster-migrating species with unsubstituted fatty acids; Sulf2, the slower migrating form containing 2-OH substituted fatty acids, showed no significant change at 28d but, surprisingly, a substantial increase (46%) at 7 m. This increase appeared even greater (89%) on 2D-TLC; in addition the other changes observed with 1D-TLC received qualitative confirmation with 2D-TLC (Fig. 4, numerical values indicated in () in Fig. 3).
Fig. 2.
One-dimensional HPTLC of myelin lipids. Left: total myelin lipids from 28 day-old tremor brain (TM-28d), 7-month-old tremor brain (TM-7 m) and samples from corresponding WT myelin were separated in solvent system I. STD = standard lipids for comparison. Lipids corresponding to equal amounts of myelin protein were applied for each WT-TM pair. Most lipids were well separated, except for PC which overlapped with PS and PI. Right: uncharged and zwitterionic myelin lipids, obtained by removing acidic lipids (PS, PI, Sulf) from myelin lipid samples with DEAE-Sephadex. These were subjected to 1D-HPTLC with solvent system I, followed by drying of the plate and rechromatography in the same direction with solvent system II. Note that EPG refers to both the di-acyl and plasmalogen forms of ethanolamine phosphoglycerides
Fig. 3.
Quantification of myelin lipid changes, based on HPTLC. Upper panel: lipid levels in myelin from normal (WT) and tremor (TM) rats 28 days (28d) and 7 months (7 m) of age, quantified by densitometry of 1D-TLC shown in Fig. 2. Bottom panel: % changes of TM myelin lipids compared to WT. Values for PC were obtained from right panel of Fig. 2, while values for unresolved PC + PS + PI were quantified from left panel of Fig. 2. The other lipids were quantified from both panels. Values in () refer to 2D-TLC (Fig. 4). * P < 0.05. Note that EPG refers to both the di-acyl and plasmalogen forms of ethanolamine phosphoglycerides
Fig. 4.
Two-dimensional TLC (2D-TLC), providing quantitative comparison of lipids from WT and TM myelin. Lipids corresponding to 20 μg myelin protein were applied at origin (lower left). First dimension was run with solvent system I, and second dimension with solvent system III. Plates were sprayed and heated as described, and components quantified by densitometry. Percentage changes are indicated in () in Fig. 3. Arrows pointing downward indicate lipids that decreased and arrowheads those that increased in TM compared to WT. Note that EPG refers to both the di-acyl and plasmalogen forms of ethanolamine phosphoglycerides
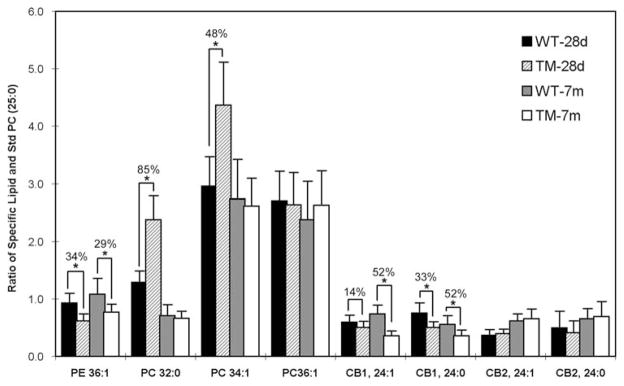
More detailed information on individual molecular species within each lipid class was obtained by MALDI-TOFMS. Since we employed positive ion reflector mode, negatively charged lipids were not included in this part of the study; as indicated, Sulf was successfully analyzed by HPTLC (see above). By comparing the mass spectra of sample lipids with standard lipids we acquired characteristic peaks for the following lipid species: cholesterol, PC, PE, CB1, CB2 (Table 1). For cholesterol, we observed a dominant ion peak with m/z of 369.3, corresponding to [M + H–H2O]+; this showed no change in tremor myelin. For PE and PC two types of molecular ions, [M + H]+ and [M + Na]+, were clearly detectable and these were added; for CBs, only protonated ions were observed. For the lipids of interest the dominant peaks were those with m/z of 700–900. Linearity between Lip/Std ratios and the lipid amount in a given sample was established as described (see ‘‘Methods’’ section and Fig. 1). Cerebrosides, although major lipids of myelin [15], gave lower Ion peak intensities than phospholipids, but could still be quantitatively compared (e.g., WT versus TM at each age). The results (Figs. 5 and 6) showed CB changes in basic agreement with HPTLC: significant decrease of CB1 in tremor myelin at both 28d and 7 m, in contrast to CB2 which showed no significant change at either age. MALDI-TOFMS provided additional data in showing this decrease applied to CB1 species with 24:0 and 24:1, the two major unsubstituted fatty acid components of CNS myelin CB [22]. As with HPTLC, the decrease for CB1 was greater at 7 m than at 28d. MALDI-TOFMS indicated no significant change for those forms of CB2 containing 24:0 and 24:1 fatty acids with 2-OH substituents, also in agreement with HPTLC.
Table 1.
m/z Assignments of peaks detected in the positive ion reflector mode of MALDI-TOF
| m/z | Peak assignment | |
|---|---|---|
| 369.37 | Cholesterol | [M + H–H2O]+ |
| 636.50 | PC 25:0 (Std) | [M + H]+ |
| 658.49 | PC 25:0 (Std) | [M + Na]+ |
| 734.62 | PC 32:0 | [M + H]+ |
| 756.61 | PC 32:0 | [M + Na]+ |
| 746.66 | PE 36:1 | [M + H]+ |
| 768.64 | PE 36:1 | [M + Na]+ |
| 760.64 | PC 34:1 | [M + H]+ |
| 782.63 | PC 34:1 | [M + Na]+ |
| 788.67 | PC 36:1 | [M + H]+ |
| 810.66 | PC 36:1 | [M + Na]+ |
| 832.73 | CB1, 24:1 | [M + Na]+ |
| 834.74 | CB1, 24:0 | [M + Na]+ |
| 848.73 | CB2, 24:1 | [M + Na]+ |
| 850.74 | CB2, 24:0 | [M +Na]+ |
Fig. 5.
MALDI-TOFMS of lipids from 28d WT and TM myelin. Internal standard of PC25 was added to each lipid sample, representing equivalent amounts of myelin protein. Comparison of Lip/Std ratios provided quantitation (Fig. 6). For phospholipids, the total intensity of protonated plus sodiated peaks were used; for cerebrosides, only protonated peaks were detected. Arrows indicate those that changed and the direction of change. A similar pair of spectra was obtained for 7 m myelin lipids (not shown)
Fig. 6.
Percentage changes in TM myelin lipids, determined by MALDI-TOFMS (see Fig. 5). PC32:0 and PC34:1 increased in 28d (but not 7 m) tremor myelin; other lipids decreased or did not change. * P < 0.05. Note that PE refers to the di-acyl form of ethanolamine phosphoglycerides
The two phospholipids that were analyzed showed changes that were distinguished from the above galactolipids; HPTLC showed PC en toto (after removal of PS and PI) to increase 25% with 1D-TLC and 21% with 2D-TLC in 28d myelin, whereas the unresolved mixture of PC/PS/PI (of which PC comprises >80%) increased by 50% with 1D-TLC; although the unresolved mixture did increase by a significant 24% in 7 m myelin, the lesser increase of PC freed of PS/PI (17%, 18%) did not reach significance (Figs. 2–4). This may be accounted for by an increase of PS in TM myelin, as revealed in our preliminary finding (not shown). MALDI-TOFMS analysis (Figs. 5 and 6) revealed the PC increase at 28d as due to specific molecular species: PC 32:0 (two palmitates) and PC 34:1 (one palmitate, one oleate) but not PC 36:1 (one stearate, one oleate). Mass spectrometry confirmed the HPTLC finding of no change for these molecular forms at 7 m.
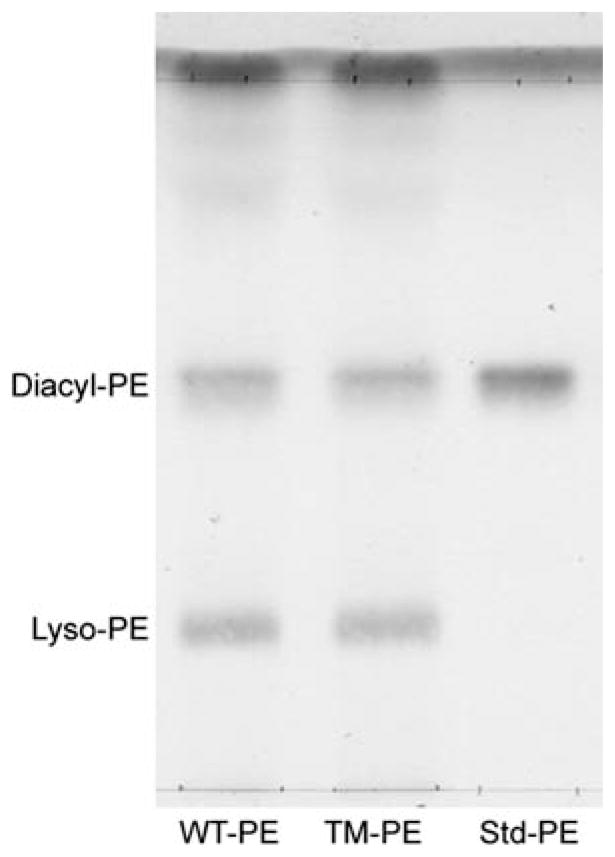
HPTLC showed that ethanolamine phosphoglycerides (EPG, including diacyl-PE and plasmalogen) showed no significant change at either age (Figs. 2–4). However, MALDI-TOFMS revealed a decrease in PE 36:1 in TM myelin, 34% at 28d, 29% at 7 m. Although this appears to be the major molecular species in the diacyl form of myelin PE in mammals [22], failure to detect this change on TLC likely reflected the presence of other diacyl forms in addition to the plasmalogen form of EPG which did not change. The plasmalogen form is abundant in EPG of myelin [23], and although MALDI-TOFMS did not provide data on plasmalogens in these experiments due to low ion intensity, HPTLC of lyso-PE following mild acid treatment, which selectively hydrolyzed plasmalogen, indicated no change in plasmalogen (Fig. 7).
Fig. 7.
Plasmalogen analysis in myelin from 7 m WT and TM rats. Ethanolamine phosphoglycerides were isolated by 1D-TLC with solvent system III, eluted from the silica gel and treated briefly with dilute acid as described. Products resolved by 1D-TLC (solvent system I) revealed the lyso-PE product and unreacted diacyl-PE. Quantification by densitometry revealed no change
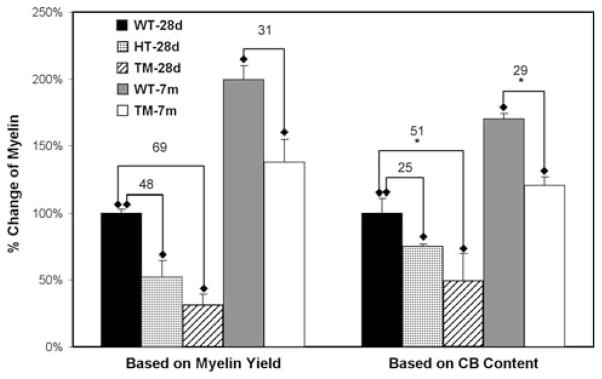
The above myelin lipid changes were calculated relative to protein content of myelin from each source, independent of myelin content in brain. Because Canavan disease is characterized by significant decrease in CNS myelin (see below), it was of interest to determine whether the same was true of the TM rat. This was determined in two ways: (a) measurement of myelin yield, based on protein assay in isolated myelin; (b) measurement of CB in myelin and in whole brain homogenate; these galactolipids are uniquely present and greatly enriched in myelin [24]. Myelin was isolated from hemispheres of TM, heterozygotic (HT), and WT rats of comparable ages and the CB separated by TLC with solvent system IV for densitometric quantification; this included the sum of CB1 and CB2. Myelin protein levels were determined as described [20]. Prior to myelin isolation, aliquots of the homogenized tissues were taken for similar CB quantification and protein determination. The μg of brain CB per mg brain protein was divided by μg of myelin CB per mg myelin protein to give mg myelin protein per mg brain protein. The first method, which is less accurate because it assumes myelin yields to be constant, nevertheless gave a value for TM myelin loss at 28d (69%) that was not too dissimilar from the more accurate CB-based method (51%) (Fig. 8). The corresponding values for 7 m myelin were 31% and 29%. Interestingly, similar determinations for heterozygotic myelin at 28d revealed decreases of 48% based on myelin yield and 25% according to CB measurement, suggesting that mutation of a single allele of ASPA myelin may cause moderate loss of CNS myelin. However, this is a tentative finding due to limited number of independent determinations and requires verification.
Fig. 8.
Changes in quantity of tremor myelin compared to WT. Left: quantification based on measurement of protein content of isolated myelin. Since myelin recovery is not quantitative, results are normalized in comparison to protein value obtained for 28d WT myelin. Sample number (two) was too small for statistical evaluation. Right: myelin content based on determination of CB1 + CB2 in myelin and whole brain tissue. Results are again normalized in comparison to value obtained for 28d WT myelin. Numbers refer to % decrease of myelin in brain. * P < 0.05. For heterozygotic (HT) myelin, the number of independent samples analyzed (two) was insufficient for statistical analysis
Discussion
N-Acetylaspartate is a specific amino acid derivative unique to the CNS which, despite it’s primary localization in neurons, has been shown to have an important role in myelin formation and/or maintenance. This is based on studies showing incorporation of the acetyl group of NAA into brain lipids [6–8] and in particular into lipids of myelin itself from intraneuronal NAA [9]. The latter report also demonstrated the presence of ASPA in highly purified myelin, and a subsequent study showed bimodal occurrence of this enzyme in myelin and cytosol [14]. These findings suggested that NAA behaves in a manner similar to that of other lipid precursors which undergo axon-to-myelin transfer followed by incorporation into several lipids via myelin-localized enzymes; a large number of such enzymes have been reported [15, 16]. These phenomena are in accord with the well-demonstrated metabolic interaction between axons and myelin, parallel to the strong physical association demonstrated by DeVries and coworkers [25].
The importance of NAA and its metabolism in CNS function is highlighted by the eventually fatal outcome of Canavan disease in most infants afflicted with mutation of one type or another in the ASPA gene. In addition to causing accumulation of NAA in brain and other tissues, loss of ASPA activity leads to spongy degeneration of white matter associated with progressive loss of myelin [3, 4]. Animal models with inactivated ASPA have proved useful in the study of this condition, as with the knockout mouse that was shown to have morphologically abnormal myelin [5]. Similarly, the tremor rat, employed in this study, which possesses a natural ASPA mutation, was shown to have hypomyelination, vacuolation along with spongy degeneration of white matter [26], and in addition loss of oligodendrocytes [27]. Use of these animals as research tools has opened a valuable window for study of the specific contributions of ASPA-mediated acetyl formation to myelin lipid synthesis.
The present study points to NAA-acetyl as a major precursor for synthesis of myelin cerebrosides (CB1) and sulfatides (Sulf1) with unsubstituted fatty acids. That this relationship persists well into adulthood was indicated by the fact that the deficits at 7 m for CB1 and Sulf1 were roughly the same as for 28d myelin (Fig. 3). A myelin locus for such synthesis is supported by the demonstration that fatty acid synthase and acetyl-CoA carboxylase, enzymes that utilize acetyl groups for synthesis of long chain fatty acids, are present in purified myelin at surprisingly high levels of activity [17]. Moreover, UDP-galactose:ceramide galacto-syltransferase (CGT), the enzyme that catalyzes the final step in CB synthesis, is present in myelin [28]. There is the additional evidence that radiolabeled acetyl of NAA originating in neurons/axons of the optic system was incorporated into myelin CB of optic nerve/tract [9]. The fact that the deficit of those two groups was only partial indicated that myelin CB are also synthesized within and transported from the oligodendrocyte cell body. This was especially true for CB containing 2-OH fatty acids (CB2), which did not change significantly in this study, although a moderate (21%) decrease for this lipid group (which may have had borderline significance) was noted in an earlier study of myelin from the above knockout mouse [19]. The latter study also showed a drastic decrease of CB1 (~65%), comparable to that in TM myelin. In the present study Sulf2, which is derived bio-synthetically from CB2, resembled the latter in showing no significant change at 28d, but departed significantly from the negligible change of CB2 at 7 m in showing major increase (46%, 89%) above WT at 7 m (Fig. 3). This was not the only myelin lipid to show an increase (see below). These observed changes for CB and Sulf were indicated by both 1D-TLC and 2D-TLC (Figs. 2–4). A previous study of white matter from a human Canavan patient showed substantial deficits of CB1, CB2 and Sulf1 [18].
MALDI-TOF mass spectrometry of myelin lipids con-firmed the selective loss of CB1 in TM myelin and further showed that this involved molecular species of CB1 containing 24:0 and 24:1 fatty acids. These are the major fatty acids in CB1 of mammalian myelin, accounting for approximately half of total fatty acids [22]. CB2, which contains the 2-OH forms of 24:0 and 24:1 as the major fatty acids, did not show significant change by MALDI-TOFMS (Fig. 6), in agreement with HPTLC. Mass spectrometry also supported the HPTLC finding that the decreases in CB1 were somewhat greater in the older animals and that CB2 showed little or no change. MALDI-TOFMS was shown useful for direct profiling of lipid distribution in brain tissue [29] and has been applied specifically to CB [30]. These results are of particular interest because of the prominence and specificity of CB, and the closely related Sulf, in myelin [15, 24]. Study of mice with mutated CGT, the above-mentioned enzyme that completes the synthesis of CB, demonstrated an important role for these galactolipids in formation of structurally normal CNS myelin and normal development of axoglial interactions at nodes of Ranvier [24]. Knockout mice deficient in Sulf only, due to disrupted galactosylceramide sulfotransferase gene, displayed abnormal paranodal junctions and decrease in Na+ and K+ channel clusters [31].
The two phospholipids we analyzed in this study showed changes that differed significantly from the galactolipids. Ethanolamine phosphoglycerides, one of the more abundant lipid groups of myelin [15], showed no change at either age according to HPTLC (Fig. 3), despite the significant reduction of one molecular form, PE36:1, according to MALDI-TOFMS (Fig. 6). However, the latter diacyl form of PE, containing oleate and stearate, has limited concentration in myelin [22] due to the presence of other diacyl forms and the relatively abundant plasmalogens [23]. Plasmalogens, which we showed do not change (Fig. 7), undergo partial synthesis in peroxisomes [32], which were not reported to occur in myelin; this may explain the lack of dependence on NAA-acetyl, use of which might be restricted to myelin-localized enzymes. Phosphatidylcholine, on the other hand, showed significant increase of two molecular forms in 28d TM myelin (Fig. 6): PC32:0 (85%) and PC34:1 (48%). These components returned to normal in TM myelin at 7 m. The reason for the temporary increase of these abundant forms of myelin PC [22] is not known, but may represent a compensatory effort by the regulatory mechanisms that govern myelin lipid synthesis to maintain the properties necessary for physiological functioning of this diverse membrane. The same may be true for the above-noted elevation of Sulf2 in 7 m myelin. This may be analogous to substitution of glucosylceramide for galactosylceramide in myelin of animals with mutated CGT [24]. It may be noted that the study of white matter from a human Canavan patient [18] revealed marked elevation of an unidentified component on 2D-TLC (referred to as ‘‘anomalous lipid band’’) whose location appeared to be that of PC. Selectivity was also of some interest in the present study because PC36:1 did not show change at either age (Fig. 6).
The above-mentioned reduction of myelin content in the brain of Canavan patients was replicated in the knockout mouse [19] and in the TM rat as shown here (Fig. 8). This reduction was statistically significant at 28d as determined by the more accurate method based on CB levels; the same appeared true when determined by myelin (protein) recovery, based on two independent determinations. Both methods also indicated lesser, but still significant reductions at 7 m. This age-related difference could have reflected more dependence of myelination on NAA-acetyl at the younger age, and/or delayed myelination in the latter. Of some interest was the finding, based on a limited number of determinations, that HTs showed modest myelin loss; further work will be needed to determine the validity and significance of that result.
The findings of this study support the proposed mechanism for lipid synthesis in CNS myelin involving coordinated contributions by the oligodendrocyte cell body and enzymatic systems within the myelin sheath itself [9, 16]. The latter enzymes utilize acetyl groups liberated from NAA which is transferred from the axon by an as yet undetermined mechanism. Both sources of lipid are apparently necessary for achieving the highly regulated lipid composition of myelin upon which optimal function depends. Additional evidence for NAA/ASPA participation in CNS myelinogenesis came from a recent study [33] showing that aralar (−/−) mice lacking the mitochondrial Asp-glutamate carrier have marked reduction of brain NAA along with reduced myelinogenesis. It will be of interest to explore how NAA deficits of the kind reported in several other neurological disorders [34] affect the chemical composition and fine structure of CNS myelin over time.
Acknowledgments
This work was supported by grants from the National Multiple Sclerosis Society, PP1008 (RWL), Jacob’s Cure: A Fight Against Canavan Disease (RWL), and The National Institutes of Health, USA, NS046593 (HL). We are grateful to the National BioResource Project for the Rat in Japan (http://www.anim.med.kyoto-u.ac.jp/NBR/) for providing tremor rats.
Abbreviations
- ASPA
Aspartoacylase
- BHT
2,6-di-tert-butyl-4-methylphenol
- C
Chloroform
- CB
Cerebrosides
- CNS
Central nervous system
- EPG
Ethanolamine phosphoglyceride
- HT
Heterozygote
- HPTLC
High performance thin-layer chromatography
- MALDI-TOFMS
Matrix-assisted laser desorption/ ionization—time of flight mass spectrometry
- M
Methanol
- NAA
N-acetylaspartate
- PC
Phosphatidylcholine
- PE
Phosphatidylethanolamine
- PI
Phosphatidylinositol
- PS
Phosphatidylserine
- Sulf
Sulfatide
- TM
Tremor rat
- WT
Wild type
Footnotes
Special issue article in honor of Dr. George DeVries.
Fatty acid designations (e.g. 18:1) indicate carbon number and number of double bonds.
Contributor Information
Jianfeng Wang, Department of Neurology and Neurosciences, New Jersey Medical School, UMDNJ, 185 So. Orange Ave., MSB-H506, Newark, NJ 07103, USA.
Paola Leone, Department of Surgery, Robert Wood Johnson Medical School, UMDNJ, Camden, NJ 08103, USA, Department of Molecular Genetics, Robert Wood Johnson Medical School, UMDNJ, Camden, NJ 08103, USA.
Gusheng Wu, Department of Neurology and Neurosciences, New Jersey Medical School, UMDNJ, 185 So. Orange Ave., MSB-H506, Newark, NJ 07103, USA.
Jeremy S. Francis, Department of Molecular Genetics, Robert Wood Johnson Medical School, UMDNJ, Camden, NJ 08103, USA
Hong Li, Department of Biochemistry and Molecular Biology, New Jersey Medical School, UMDNJ, 185 So. Orange Ave., Newark, NJ 07103, USA.
Mohit Raja Jain, Department of Biochemistry and Molecular Biology, New Jersey Medical School, UMDNJ, 185 So. Orange Ave., Newark, NJ 07103, USA.
Tadao Serikawa, Institute of Laboratory Animals, Graduate School of Medicine, Kyoto University, Kyoto 606-8501, Japan.
Robert W. Ledeen, Email: ledeenro@umdnj.edu, Department of Neurology and Neurosciences, New Jersey Medical School, UMDNJ, 185 So. Orange Ave., MSB-H506, Newark, NJ 07103, USA
References
- 1.Yamada J, Serikawa T, Ishiko J, et al. Rats with congenital tremor and curled whiskers and hair. Jikken Dobutsu. 1985;34:183–188. doi: 10.1538/expanim1978.34.2_183. [DOI] [PubMed] [Google Scholar]
- 2.Kitada K, Akimitsu T, Shigematsu Y, et al. Accumulation of N-acetyl-L-aspartate in the brain of the tremor rat, a mutant exhibiting absence-like seizure and spongiform degeneration in the central nervous system. J Neurochem. 2000;74:2512–2519. doi: 10.1046/j.1471-4159.2000.0742512.x. [DOI] [PubMed] [Google Scholar]
- 3.Matalon R, Michals K, Kaul R. Canavan disease: from spongy degeneration to molecular analysis. J Pediat. 1995;127:511–517. doi: 10.1016/s0022-3476(95)70105-2. [DOI] [PubMed] [Google Scholar]
- 4.Janson CG, McPhee SW, Francis J, et al. Natural history of Canavan disease revealed by proton magnetic resonance spectroscopy (1H-MRS) and diffusion-weighted MRI. Neuropediatr. 2006;37:209–221. doi: 10.1055/s-2006-924734. [DOI] [PubMed] [Google Scholar]
- 5.Matalon R, Rady PL, Platt KA, et al. Knock-out mouse for Canavan disease: a model for gene transfer to the central nervous system. J Gene Med. 2000;2:165–175. doi: 10.1002/(SICI)1521-2254(200005/06)2:3<165::AID-JGM107>3.0.CO;2-R. [DOI] [PubMed] [Google Scholar]
- 6.D’Adamo AF, Yatsu FM. Acetate metabolism in the nervous system. N-Acetyl-l-aspartic acid and the biosynthesis of brain lipids. J Neurochem. 1966;13:961–963. doi: 10.1111/j.1471-4159.1966.tb10292.x. [DOI] [PubMed] [Google Scholar]
- 7.Burri R, Steffen C, Herschkowitz N. N-Acetyl-L-aspartate is a major source of acetyl groups for lipid lsynthesis during rat brain development. Dev Neurosci. 1991;13:403–411. doi: 10.1159/000112191. [DOI] [PubMed] [Google Scholar]
- 8.Mehta V, Namboodiri MAA. N-Acetylaspartate as an acetyl source in the nervous system. Mol Brain Res. 1995;31:151–157. doi: 10.1016/0169-328x(95)00044-s. [DOI] [PubMed] [Google Scholar]
- 9.Chakraborty G, Mekala P, Yahya D, et al. Intraneuronal N-acetylaspartate supplies acetyl groups for myelin lipid synthesis: evidence for myelin-associated aspartoacylase. J Neurochem. 2001;78:736–745. doi: 10.1046/j.1471-4159.2001.00456.x. [DOI] [PubMed] [Google Scholar]
- 10.Patel TB, Clark JB. Synthesis of N-acetyl-L-aspartate by rat brain mitochondria and its involvement in mitochondrial/cytosolic carbon transport. Biochem J. 1979;184:539–546. doi: 10.1042/bj1840539. [DOI] [PMC free article] [PubMed] [Google Scholar]
- 11.Truckenmiller ME, Namboodiri MA, Brownstein MJ, Neale JH. N-Acetylation of L-aspartate in the nervous system: differential distribution of a specific enzyme. J Neurochem. 1985;45:1658–1662. doi: 10.1111/j.1471-4159.1985.tb07240.x. [DOI] [PubMed] [Google Scholar]
- 12.Baslow MH, Suckow RF, Sapirstein V, Hungund BL. Expression of aspartoacylase activity in cultured rat macroglial cells is limited to oligodendrocytes. J Mol Neurosci. 1999;13:47–53. doi: 10.1385/JMN:13:1-2:47. [DOI] [PubMed] [Google Scholar]
- 13.Kirmani BF, Jacobowitz DM, Namboodiri MAA. Developmental increase of aspartoacylase in oligodendrocytes parallels CNS myelination. Dev Brain Res. 2003;140:105–115. doi: 10.1016/s0165-3806(02)00592-8. [DOI] [PubMed] [Google Scholar]
- 14.Wang J, Matalon R, Bhatia G, et al. Bimodal occurrence of aspartoacylase in myelin and cytosol of brain. J Neurochem. 2007;101:448–457. doi: 10.1111/j.1471-4159.2006.04380.x. [DOI] [PubMed] [Google Scholar]
- 15.Norton WT, Cammer W. Isolation and characterization of myelin. In: Morell P, editor. myelin. Plenum Press; New York: 1984. pp. 147–195. [Google Scholar]
- 16.Ledeen RW. Enzymes and receptors of myelin. In: Martensen RE, editor. Myelin: biology and chemistry. CRC Press; Boca Raton: 1992. pp. 527–566. [Google Scholar]
- 17.Chakraborty G, Ledeen RW. Fatty acid synthesizing enzymes intrinsic to myelin. Brain Res Mol Brain Res. 2003;112:46–52. doi: 10.1016/s0169-328x(03)00033-0. [DOI] [PubMed] [Google Scholar]
- 18.Madhavarao CN, Arun P, Moffett JR, et al. Defective N-acetylaspartate catabolism reduces brain acetate levels and myelin lipid synthesis in Canavan’s disease. Proc Natl Acad Sci USA. 2005;102:5221–5226. doi: 10.1073/pnas.0409184102. [DOI] [PMC free article] [PubMed] [Google Scholar]
- 19.Ledeen RW, Wang J, Wu G, et al. Physiological role of N-acetylaspartate: contribution to myelinogenesis. Adv Experim Med Biol. 2006;576:131–143. doi: 10.1007/0-387-30172-0_9. [DOI] [PubMed] [Google Scholar]
- 20.Lees M, Paxman S. Modification of the Lowry procedure for analysis of proteolipid protein. Anal Biochem. 1972;47:184–192. doi: 10.1016/0003-2697(72)90291-6. [DOI] [PubMed] [Google Scholar]
- 21.Ledeen RW, Yu RK. Gangliosides: structure, isolation, and analysis. Methods Enzymol. 1982;83:139–192. doi: 10.1016/0076-6879(82)83012-7. [DOI] [PubMed] [Google Scholar]
- 22.O’Brien JS, Sampson EL. Fatty acid and fatty aldehyde composition of the major brain lipids in normal human gray matter, white matter, and myelin. J Lipid Res. 1965;6:545–551. [PubMed] [Google Scholar]
- 23.O’Brien JS, Sampson EL. Lipid composition of the normal human brain: gray matter, white matter, and myelin. J Lipid Res. 1965;6:537–544. [PubMed] [Google Scholar]
- 24.Marcus J, Popko B. Galactolipids are molecular determinants of myelin development and axoglial organization. Biochim Biophys Acta. 2002;1573:406–413. doi: 10.1016/s0304-4165(02)00410-5. [DOI] [PubMed] [Google Scholar]
- 25.DeVries GH, Norton WT, Raine CS. Axons: isolation from mammalian central nervous system. Science. 1972;172:1370–1372. doi: 10.1126/science.175.4028.1370. [DOI] [PubMed] [Google Scholar]
- 26.Kondo A, Nagara H, Akazawa K, et al. CNS pathology in the neurological mutant rats zitter, tremor and zitter-tremor double mutant (spontaneously epilelptic rat, SER) Brain. 1991;114:979–999. doi: 10.1093/brain/114.2.979. [DOI] [PubMed] [Google Scholar]
- 27.Francis JS, Olariu A, McPhee SW, Leone P. Novel role for aspartoacylase in regulation of BDNF and timing of postnatal oligodendrogenesis. J Neurosci Res. 2006;84:151–169. doi: 10.1002/jnr.20866. [DOI] [PubMed] [Google Scholar]
- 28.Costantino-Ceccarini E, Suzuki K. Evidence for the presence of UDP-galactose: ceramide galactosyltransferase in rat myelin. Brain Res. 1975;93:358–362. doi: 10.1016/0006-8993(75)90359-5. [DOI] [PubMed] [Google Scholar]
- 29.Jackson SN, Wang HY, Woods AS. Direct profiling of lipids distribution in brain tissue using MALDI-TOFMS. Anal Chem. 2005;77:4523–4527. doi: 10.1021/ac050276v. [DOI] [PubMed] [Google Scholar]
- 30.Yurkova I, Kisel M, Arnhold J, Shadyro O. Free-radical fragmentation of galactocerebrosides: a MALDI-TOF mass spectrometry study. Chem Phys Lipids. 2005;134:41–49. doi: 10.1016/j.chemphyslip.2004.11.002. [DOI] [PubMed] [Google Scholar]
- 31.Ishibashi T, Dupree JL, Ikenaka K, et al. A myelin galactolipid, sulfatide, is essential for maintenance of ion channels on myelinated axon but not essential for initial cluster formation. J Neurosci. 2002;22:6507–6514. doi: 10.1523/JNEUROSCI.22-15-06507.2002. [DOI] [PMC free article] [PubMed] [Google Scholar]
- 32.Farooqui AA, Horrocks LA. Plasmalogens: workhorse lipids of membranes in normal and injured neurons and glia. The Neuroscientist. 2001;7:232–245. doi: 10.1177/107385840100700308. [DOI] [PubMed] [Google Scholar]
- 33.Jalil MA, Begum L, Contreras L, et al. Reduced N-acetylaspartate levels in mice lacking aralar, a brain- and muscle-type mitochondrial aspartate-glutamate carrier. J Biol Chem. 2005;280:31333–31339. doi: 10.1074/jbc.M505286200. [DOI] [PubMed] [Google Scholar]
- 34.Tsai G, Coyle JT. N-acetylaspartate in neuropsychiatric disorders. Prog Neurobiol. 1995;46:531–540. doi: 10.1016/0301-0082(95)00014-m. [DOI] [PubMed] [Google Scholar]


