Significance
The protein-coding exome of a patient with a monogenic disease contains about 20,000 variations, of which only one or two are disease causing. When attempting to select disease-causing candidate mutation(s), a challenge is to filter out as many false-positive (FP) variants as possible. In this study, we describe the gene damage index (GDI), a metric for the nonsynonymous mutational load in each protein-coding gene in the general population. We show that the GDI is an efficient gene-level method for filtering out FP variants in genes that are highly damaged in the general population.
Keywords: mutational damage, gene-level, gene prioritization, variant prioritization, next generation sequencing
Abstract
The protein-coding exome of a patient with a monogenic disease contains about 20,000 variants, only one or two of which are disease causing. We found that 58% of rare variants in the protein-coding exome of the general population are located in only 2% of the genes. Prompted by this observation, we aimed to develop a gene-level approach for predicting whether a given human protein-coding gene is likely to harbor disease-causing mutations. To this end, we derived the gene damage index (GDI): a genome-wide, gene-level metric of the mutational damage that has accumulated in the general population. We found that the GDI was correlated with selective evolutionary pressure, protein complexity, coding sequence length, and the number of paralogs. We compared GDI with the leading gene-level approaches, genic intolerance, and de novo excess, and demonstrated that GDI performed best for the detection of false positives (i.e., removing exome variants in genes irrelevant to disease), whereas genic intolerance and de novo excess performed better for the detection of true positives (i.e., assessing de novo mutations in genes likely to be disease causing). The GDI server, data, and software are freely available to noncommercial users from lab.rockefeller.edu/casanova/GDI.
Germ-line mutations can contribute to the long-term adaptation of humans, but at the expense of causing a large number of genetic diseases (1). The advent of next-generation sequencing (NGS)-based approaches, including whole-exome sequencing (WES), whole-genome sequencing (WGS), and RNA-Seq, has facilitated the large-scale detection of gene variants at both the individual and population levels (2–6). In patients suffering from a monogenic disease, at most two variants are disease causing [true positives (TP)], and the other 20,000 or so protein-coding exome variants are false positives (FP; type I error). Several variant-level metrics predicting the biochemical impact of DNA mutations (7–9) can be used to prioritize candidate variants for a phenotype of interest (10, 11). Gene-level metrics aim to prioritize the genes themselves, providing information that can be used for the further prioritization of variants. There are currently fewer gene-level than variant-level computational methods. They provide complementary information, as it is best to predict the impact of a variant by also taking into account population genetics data for its locus. Current gene-level methods include genic intolerance, as measured by the residual variation intolerance score (RVIS) (12) and de novo excess (DNE) (13). These metrics are particularly useful for determining whether a given gene (and, by inference, its variants) is a plausible candidate for involvement in a particular genetic disease (i.e., for the selection of a short list of candidate genes and variants, which include the TPs). However, owing to the large number and diversity of variants, the selection of a single candidate gene from the NGS data for a given patient with a specific disease remains challenging.
We reasoned that genes frequently mutated in healthy populations would be unlikely to cause inherited and rare diseases, but would probably make a disproportionate contribution to the variant calls observed in any given patient. Conversely, mutations in genes that are never or only rarely mutated under normal circumstances are more likely to be disease-causing. Leading gene-level strategies are based on selective pressure (12) and de novo mutation rate estimates (13). These methods are tailored to detect genes likely to harbor TPs. However, these methods do not directly calculate quantitatively the mutational load for human genes in the general (i.e., “healthy”) population or the frequencies of mutant alleles. These methods may, therefore, not be optimal for filtering out highly mutated genes, which are likely to harbor many FPs. Moreover, there has been no formal comparison of the power of these gene-level methods and their combinations for maximizing the discovery of FPs and TPs by NGS. We therefore aimed to generate a robust metric of the cumulative mutational damage to each human protein-coding gene, to make it easier to distinguish the FP variants harbored by highly damaged genes (e.g., under relaxed constraint or positive selection) from potential candidate genes and variants, including the TPs. By damaged genes, we refer to genes displaying many nonsynonymous mutations, which are not necessarily damaging biochemically or evolutionarily. We developed the gene damage index (GDI), which defines, in silico, the mutational damage accumulated by each protein-coding human gene in the general population, and reflecting the combined influences of drifts and selections. We then tested this approach with the WES data for 84 patients in our in-house database, each of these patients having a known primary immunodeficiency (PID). Finally, we used receiver operating characteristic (ROC) curves for formal comparisons of performance between GDI and the existing gene-level RVIS and DNE approaches, and to assess the power of the gene-level methods for detecting enrichment in de novo mutations in cases versus controls. We also tested whether these methods could act in synergy to filter out FPs and select TPs.
Results
Genes Found to Be Highly Mutated in Patients with Monogenic Diseases.
We hypothesized that the genes most frequently mutated in the general population would also probably be the genes most frequently mutated in patients with monogenic diseases. They would therefore be unlikely to cause disease, despite contributing a large proportion of the variants harbored by patients. As highly mutated genes form a large proportion of the total number of variants present in patients, they would also be expected to account for a large proportion of the FP variants in patients. We therefore set out to identify a set of highly mutated FP genes from the WES data derived from 84 patients with monogenic PIDs for whom the true disease-causing mutation had already been experimentally validated and reported (1). We used standard variant filtering methods for rare diseases, retaining only those with a minor allele frequency (MAF) <0.01 in the 1,000 Genomes Project, together with missense, nonsense, and frameshift variants (including start-loss and stop-loss), and in-frame indels and splice variants for which sequencing quality was high (see Materials and Methods for further details) (4, 14). We then determined the frequency of the remaining 44,668 variants among the 11,190 genes harboring them. By an analysis of outliers based on modified Z-score, we identified 496 genes carrying significantly larger numbers of variants than expected (≥10 per gene). Despite accounting for only 2.42% of all human protein-coding genes, these 496 genes harbored 58.32% of all of the rare variants found in patients. An approach that efficiently filters out highly damaged human genes should therefore efficiently eliminate a large proportion of the FP variants in patients. We would expect to obtain similar results with patients suffering from more common monogenic disorders, because the number of disease-causing mutations would remain negligible with respect to the total number of variants in these patients. Fig. S1 shows the patients’ WES genes scaled by the number of variants they harbor.
Fig. S1.
Word cloud of human genes with variants in patients. The genes present in the WES data for patients are represented. The size of the gene name reflects the total number of missense/nonsense/frameshift/in-frame indels/splice variants in the genes with an MAF < 0.01 and a high sequencing quality (i.e., candidate variants in patients, retained after standard rigorous filtering).
The Human GDI.
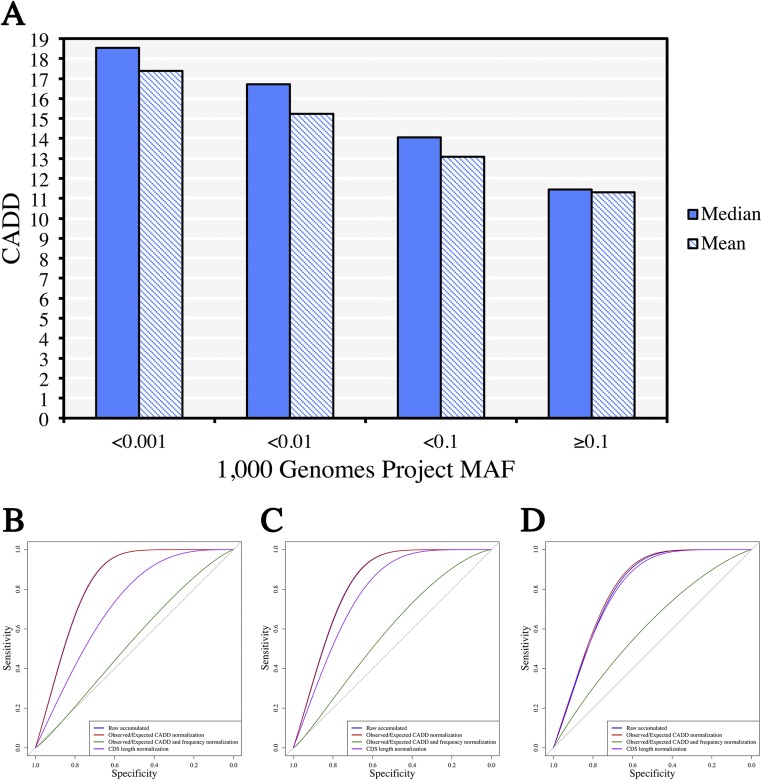
Following up on this observation, we defined the GDI as the cumulative mutational damage to a given human gene in the general population (the 1,000 Genomes Project). We chose to use the combined annotation dependent depletion (CADD) score as the variant-level damage prediction metric (9), because (i) it has been shown to be the best method for distinguishing between deleterious and benign variants and (ii) unlike methods such as PolyPhen-2 and SIFT, which predict only missense variants (7, 8), it can be used to assess the impact of most types of variant (9). We showed an inverse relationship between MAF and the CADD damage prediction value: rare variants tended to have higher CADD scores than common variants from the 1,000 Genomes Project (Fig. S2A). We then compared the performance of four heuristic gene-level GDI models, with the purpose of maximizing the differentiation of FPs from TPs (see the section on ROC curves and the Materials and Methods for further details and equations): (i) “raw” GDI, calculated for each human gene by first multiplying each variant’s CADD score by the corresponding variant’s number of alleles in the 1,000 Genomes Project (a total of 610,160 missense/nonsense/frameshift/in-frame indels/splice variants, with a MAF < 0.5, from a total of 20,243,313 alleles), then summing up all (CADD × allele count) products for one gene; (ii) the “CADD-normalized” gene-level model of accumulated mutational damage, calculated as in i, with each CADD score divided by the expected (median) CADD score of a variant with a similar allele frequency (Fig. S2A); (iii) the observed/expected GDI-normalized GDI model, in which the observed GDI was calculated as in i and then divided by the expected raw GDI, calculated as in i and using the expected CADD as in ii; and (iv) the “gene size-normalized” GDI model, calculated as in ref. 1 and divided by the length of the coding sequence (CDS) of the canonical transcript of the gene. We found that the GDI models that performed best under a general, autosomal dominant (AD), or autosomal recessive (AR) mode of inheritance were i and ii, with model ii outperforming i in all cases, as shown by calculations of the area under the curve (AUC; Fig. S2 B–D). We therefore used model ii, representing accumulated mutational damage normalized by dividing by the expected CADD score for this study. The GDI scores and their Phred-scaled GDI scores for 19,558 human protein genes are summarized in Dataset S1, Tab S1.
Fig. S2.
Correlating CADD scores with MAF results. (A) Histograms showing the mean and median CADD scores for missense/nonsense/frameshift/in-frame indels/splice variants in the 1,000 Genomes Project Phase 3, with an MAF < 0.5, in four frequency slots, determined by a log10 scale. (B) ROC curve comparisons for all Mendelian disease-causing genes and all variants from patients. (C) ROC curve comparisons for autosomal recessive disease-causing genes and homozygous variants from patients. (D) ROC curve comparisons for autosomal dominant disease-causing genes and heterozygous variants from patients.
Definition of the Most and Least Damaged Human Genes.
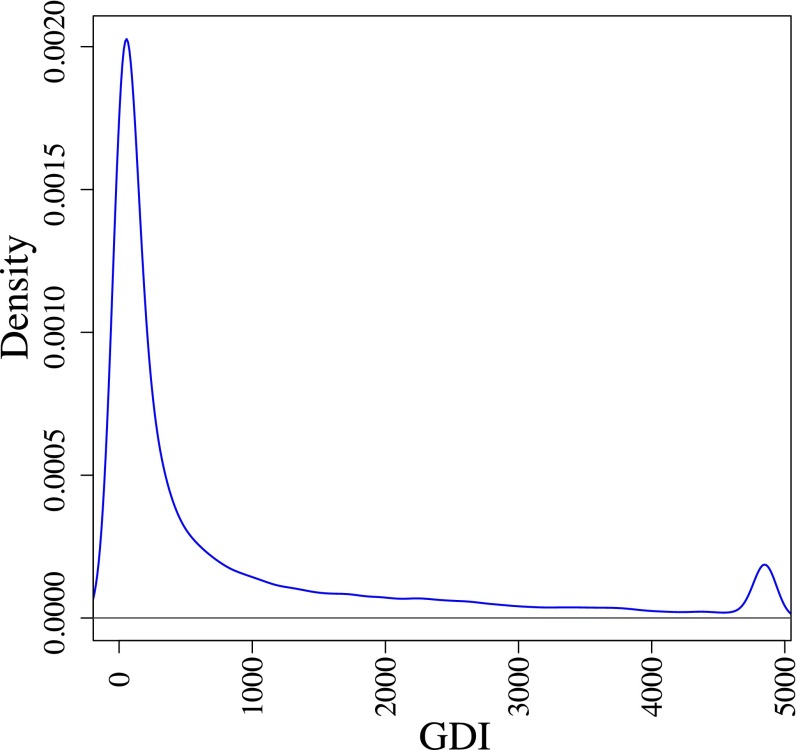
We hypothesized that mutations in the genes most damaged in healthy individuals are unlikely to be responsible for monogenic diseases, whereas mutations in the least damaged genes are more likely to be associated with the most severe monogenic disorders (or, alternatively, would be embryo-lethal). We therefore characterized the functional attributes of the human genes with the highest and lowest GDI values. By calculating the outliers from the gene damage data for all 19,558 protein-coding human genes, we defined the 751 human genes with the highest GDI values, on the basis of modified Z-score outliers for GDI. The 977 genes with the lowest GDI values were defined as those not displaying any nonsynonymous variation in healthy individuals from the 1,000 Genomes Project (although some will probably have nonsynonymous variants in larger databases such as ExAC (exac.broadinstitute.org), or when different annotation software was used. Owing to the gamma distribution of the data, there are no trivial statistical outliers at the lower end of the range (Fig. S3).
Fig. S3.
Density of GDI for all human genes. Density plot of the raw GDI values for protein-coding human genes. The upper threshold for outliers, with a modified Z-score of M > 3.5 (GDI = 4,853.33, similar to the cutoff used in this study to determine “high GDI”/highly damaged human genes), was used to cap the maximum raw GDI value for clearer visualization.
Characterization of the Most and Least Damaged Genes.
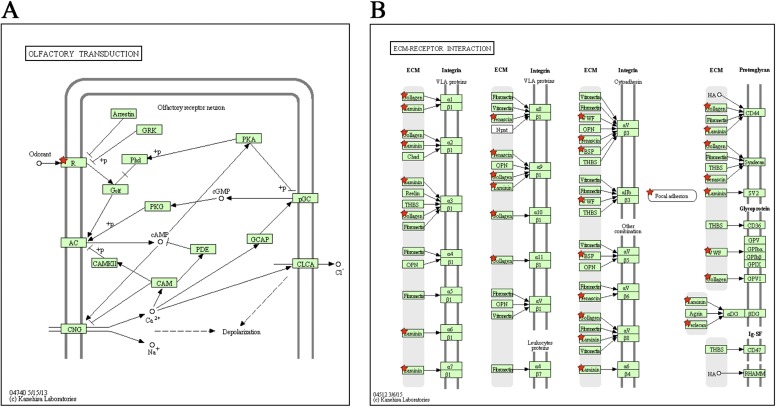
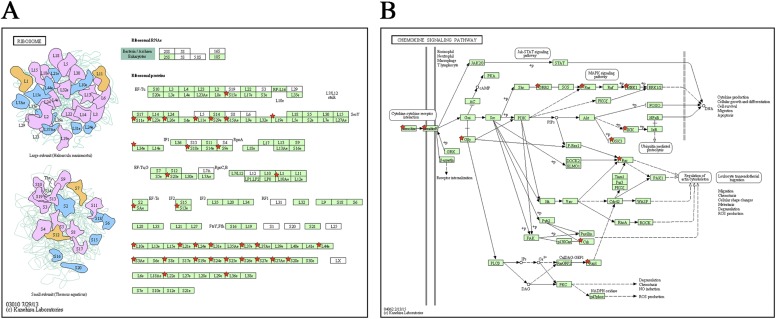
We found that biological proximity, as predicted by the human gene connectome, was greater among high-GDI genes and among low-GDI genes than for randomly selected human genes (P < 1.0 × 10⁻⁵ for both sets) (15–17). This biological proximity suggests that high-GDI genes are functionally related to each other, as are low-GDI genes. We further performed biological ontology and Kyoto Encyclopedia of Genes and Genomes (KEGG) pathway functional enrichment analyses for the human genes with the highest and lowest GDI values (18–20). We found that the list of genes with the highest GDI values was strongly enriched in sensory perception genes (P = 1.00 × 10⁻²³), including, in particular, the genes of the olfactory receptor superfamily (∼400 protein-coding genes), which has been shown to be under positive selection constraints in the human lineage (21, 22). The list of genes with the lowest GDI values was enriched in ribosome, chemokine signaling, proteasome, and spliceosome genes, all of which are highly conserved in species lineages predating the emergence of vertebrates (23–26) (Dataset S1, Tab S2 and Figs. S4 and S5). The GDI can therefore be considered to be a surrogate indicator of the relative biological indispensability (low GDI) or redundancy (high GDI) of a given human gene.
Fig. S4.
KEGG pathway enrichment for the most damaged human genes. Networks of KEGG pathways enriched in high-GDI genes, including (A) the olfactory transduction pathway, where the “R” component represents the extended set of olfactory receptor genes; and (B) the ECM-receptor interaction pathway. The red stars indicate individual genes or sets of genes from the high-GDI gene set.
Fig. S5.
KEGG pathway enrichment for the least damaged human genes. Networks of KEGG pathways enriched in high-GDI genes, including (A) the ribosome pathway and (B) the chemokine signaling pathway. Red stars represent individual genes or sets of genes from the low-GDI gene set.
Correlation of GDI with Selective Pressure and Number of Paralogs.
We found that genes with a low GDI tended to be under purifying selection stronger than the median selective pressure acting on human genes, as ascertained by the estimated McDonald–Kreitman neutrality index (NI; P = 1.79 × 10−36), whereas genes with a high GDI tended to be under less purifying selective pressure than the median human gene (P = 3.14 × 10−74). These results are plausible, because CADD score (used here as the basic metric for GDI calculation) is strongly dependent on evolutionary conservation (9). We also demonstrated a strong association between gene damage and the number of paralogs (27, 28): genes with high GDI had significantly larger numbers of paralogs than human genes generally (P = 3.96 × 10⁻¹¹), whereas genes with low GDI had significantly smaller numbers of paralogs than human genes generally (P = 2.98 × 10⁻²¹) (21, 29). These results lend support to Ohno’s neo/pseudofunctionalization hypothesis, according to which, following a gene duplication event, one copy is freed from evolutionary constraints and can therefore evolve a new function (or alternatively become a pseudogene) through the accumulation of mutations (30–32).
Correlation of GDI with Protein Complexity and Coding Sequence Length.
We then investigated the possible association between the complexity of protein amino acid composition D and GDI. Low D values are associated with proteins with an amino acid composition similar to that of the average human protein, whereas high D values suggest a biased amino acid composition in the protein concerned, generally a disordered low-complexity protein. We found that genes with a low GDI had a significantly higher than normal D (i.e., low complexity, biased amino acid composition with respect to the median composition of human proteins; P = 2.80 × 10−54), whereas genes with a high GDI had low D values (i.e., a relatively unbiased amino acid composition; P = 0.04). These results are consistent with previous studies reporting a correlation between positive selection and protein disorder/complexity bias (33, 34). As expected, we found that genes with a low GDI had significantly shorter CDS than the median value for all genes (P = 4.19 × 10−152), whereas genes with a high GDI had significantly longer CDS (P = 5.25 × 10⁻³⁵). Overall, these correlations reveal the existence of significant associations between GDI and various molecular properties of human genes and proteins.
Genes Carrying FP Variants Have Higher Than Normal GDI.
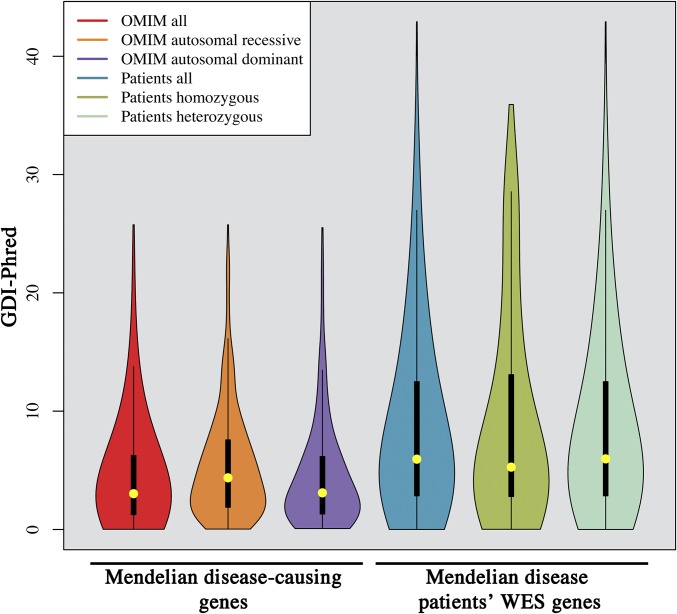
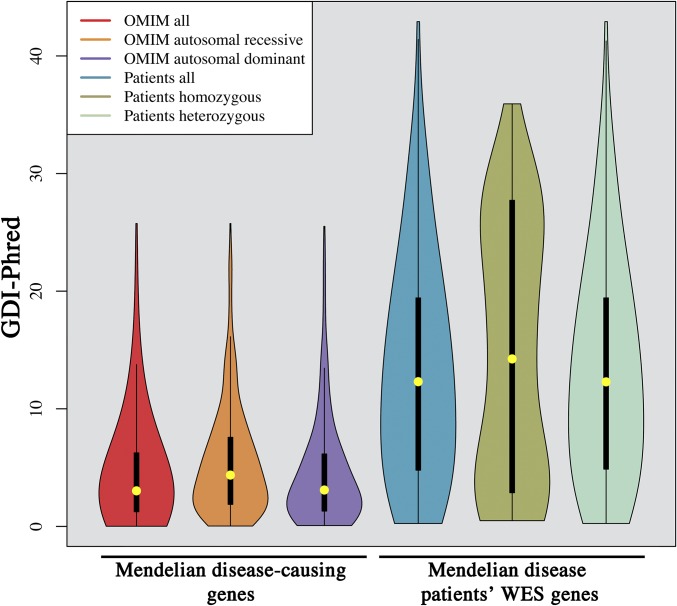
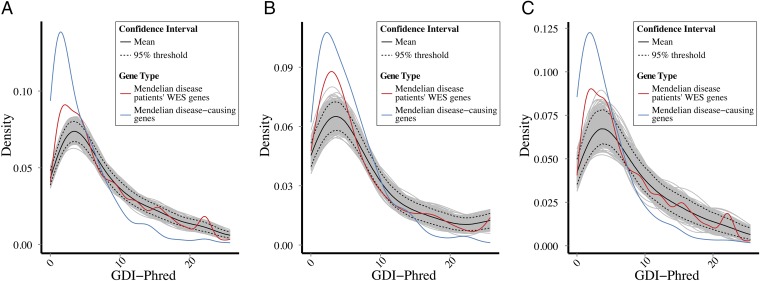
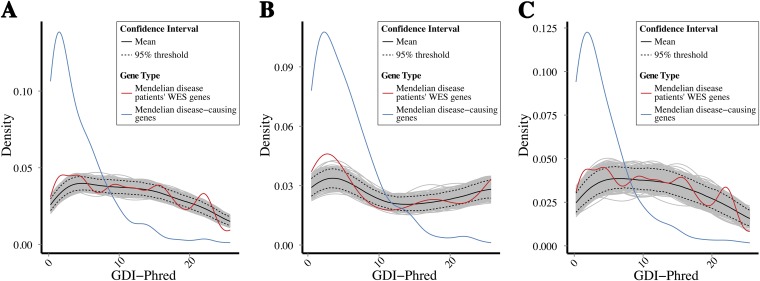
We next assessed whether the GDI was an appropriate tool for filtering out genes with abundant FP variants. We first compared the GDI values of known Mendelian disease-causing genes (TP) defined by OMIM (35), for which the mode of inheritance was unambiguous, with those of genes harboring FP variants from the WES for the 84 PID patients described above. We performed three types of comparison with account for the different modes of inheritance and the corresponding candidate variants in patients: (i) all 1,217 Mendelian disease-causing genes vs. the genes harboring all 44,668 FP variants in patients; (ii) 375 AD Mendelian disease-causing genes vs. genes harboring 42,863 heterozygous FP variants in patients; and (iii) 585 AR Mendelian disease-causing genes vs. genes harboring 1,805 homozygous FP variants in the patients. We used one gene instance for each gene containing one or more variants in a patient (for example, a gene harboring 27 variants in 25 patients under a specific model had 25 instances of its GDI value in the specific analysis). We did not perform comparisons with X-linked genes, due to overall poor coverage in the WES data for the patients. We found that, in each of the three comparisons, the GDI values for genes with FP variants were significantly higher than those for the corresponding TP OMIM genes, both when comparing TPs with all FPs (Fig. 1; P < 1.0 × 10−200, P = 2.08 × 10−101, and P = 4.68 × 10−197 for tests i, ii, and iii, respectively) and then comparing TPs with FPs for the 58.32% of rare FP variants harbored by the 2.42% most mutated genes (Fig. S6; P < 1.0 × 10−200, P = 7.44 × 10−92, and P = 3.75 × 10−155 for the above tests i, ii, and iii, respectively). We did not exclude OMIM genes that were not validated as disease causing in the specific patients from the FP sets in any of the tests. We performed bootstrap simulations for comparisons of TPs and FPs (Fig. 2 and Fig. S7), with random sampling from the TP set to assess its validity as a predictor. We confirmed that the GDI of genes containing FPs in the patients was much higher than the GDI of disease-causing genes, for both highly mutated genes and for all genes. These results suggested that the GDI might be useful for filtering out a large proportion of the variants in genes that are unlikely to be disease causing.
Fig. 1.
GDI scores of disease-causing genes and of all of the patients’ genes with variants. (Left) Violin plots of GDI values for true Mendelian disease-causing genes (all, AR, and AD). (Right) Violin plots of the corresponding GDI values (all, homozygous, and heterozygous) for the observed WES variant data from patients: missense/nonsense/frameshift/in-frame indels/splice variants in the genes with a MAF < 0.01 and a high sequencing quality, in 84 PID patients with known disease-causing mutations, after removal of the disease-causing mutation, for all of the patients’ genes.
Fig. S6.
GDI scores of disease-causing genes and genes frequently mutated in patients. (Left) Violin plots of GDI values for true Mendelian disease-causing genes (all, AR, and AD). (Right) Violin plots of the corresponding GDI values (all, homozygous, and heterozygous) for the observed patients’ WES variant data: missense/nonsense/frameshift/in-frame indels/splice variants in the genes with an MAF < 0.01 and a high sequencing quality, in 84 PID patients with known disease-causing mutations, after removal of the disease-causing mutation, for the most frequently mutated genes.
Fig. 2.
Bootstrapping of GDI values: Mendelian genes vs. variants from patients. Bootstrapping simulation plots of the Mendelian disease-causing genes, together with the observed GDI values for WES rare variant data (MAF < 0.01) from patients, demonstrating a difference in the densities of the observed and expected sets. (A) All Mendelian disease-causing genes and all of the patients’ variants. (B) Autosomal recessive disease-causing genes and homozygous variants from patients. (C) Autosomal dominant disease-causing genes and heterozygous variants from the patients.
Fig. S7.
Bootstrapping of GDI values: Mendelian genes vs. genes frequently mutated in patients. Bootstrapping simulation plots of the Mendelian disease-causing genes, together with the observed GDI values for WES rare variant data (MAF < 0.01) from patients, for the most frequently mutated genes, demonstrating a difference in the densities of the observed and expected sets. (A) All Mendelian disease-causing genes and all variants from patients. (B) Autosomal recessive disease-causing genes and homozygous variants from patients. (C) Autosomal dominant disease-causing genes and heterozygous variants from patients.
Performance Assessment by ROC Curve Analysis.
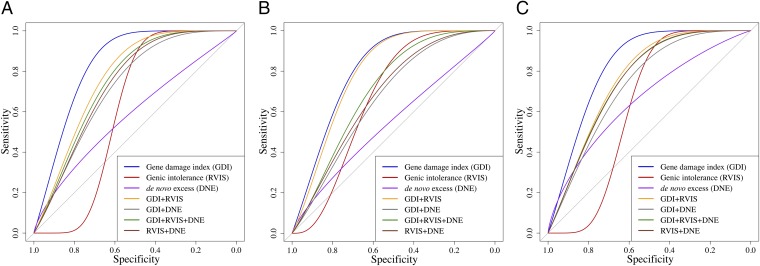
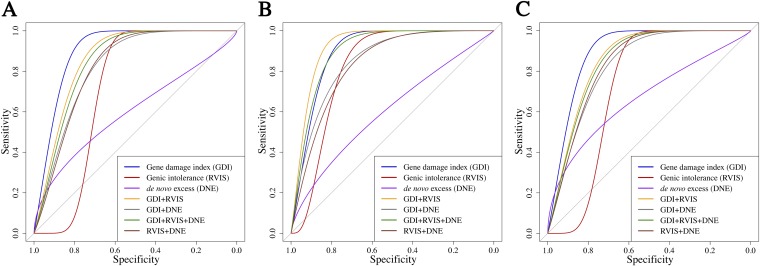
We assessed the performance of GDI for differentiating between disease-causing genes (TP, see above) and non–disease-causing genes (FPs, genes harboring variants detected in the patients but not responsible for disease; see above), by formally comparing the GDI with the raw scores obtained by two state-of-the-art gene-level approaches: genic intolerance (RVIS) (12) and DNE (13). Briefly, the RVIS approach ranks human genes in terms of the strength and consistency of the purifying selection acting against functional variation of the gene, whereas DNE estimates the rate of de novo mutation on a per-gene basis, globally and per gene set. With the aim of maximizing performance, we also tested the four possible combinations, GDI+RVIS, GDI+DNE, GDI+RVIS+DNE, and RVIS+DNE (see Materials and Methods for details regarding the integration of the methods into single scores). Using ROC curves, we demonstrated that GDI had the best performance of the three standalone methods under a general model and under models of AD or AR inheritance, for comparisons both of TPs with FPs for the 58.32% FP variants present in the 2.42% most mutated genes, and of TPs with all FPs (sensitivity and specificity, respectively; Fig. 3 and Fig. S8; see Dataset S1, Tab S3 for all AUC values). GDI+RVIS had the best performance of the four combinations of methods for all modes of inheritance. Of the six conditions tested, GDI+RVIS also outperformed GDI as a standalone method for the set of AR variants in frequently mutated genes. This analysis suggested that GDI and RVIS captured different sets of complementary information from the population genetics data.
Fig. 3.
Comparing GDI with state-of-the-art gene-level methods: Mendelian genes vs. rare variants in patients. ROC curve comparisons between GDI and two state-of-the-art gene-level methods (genic intolerance and de novo excess) and combinations of these methods. (A) All Mendelian disease-causing genes and all patients’ variants. (B) Autosomal recessive disease-causing genes and homozygous variants from patients. (C) Autosomal dominant disease-causing genes and heterozygous variants from patients.
Fig. S8.
Comparing GDI with state-of-the-art gene-level methods: Mendelian genes vs. genes frequently mutated in patients. ROC curve comparisons between GDI and two state-of-the-art gene-level methods (genic intolerance and de novo excess) and combinations of methods. (A) All Mendelian disease-causing genes and all of the patients’ variants. (B) Autosomal recessive disease-causing genes and homozygous variants from patients. (C) Autosomal dominant disease-causing genes and heterozygous variants from patients.
Performance Assessment by Hot Zone Analyses.
We then tested the performance of GDI and the combinations presented above to estimate enrichment in de novo mutations hypothesized as damaging in cases vs. controls by the hot zone approach (12, 36, 37). A combination of fixed gene-level and variant-level cutoffs was used to estimate a variant as a candidate to be damaging (see Materials and Methods for further details). In this test, RVIS and DNE outperformed GDI as standalone methods (all combined with a similar PolyPhen-2 cutoff, P = 2.28 × 10−07, P = 5.41 × 10⁻¹⁰, and P = 5.48 × 10−05, respectively). Interestingly, the highest overall performance (P = 2.75 × 10⁻¹⁰) was achieved with the combination of GDI+RVIS+DNE (Dataset S1, Tab S4). This analysis further suggests that the three methods capture different sets of complementary information from the available population genetic data. Altogether, these results suggest that, among the standalone methods, GDI is preferable for WES FP detection and filtration, whereas RVIS and DNE are better for TP detection of enrichment in de novo mutations. Moreover, combinations of these methods can optimize performance for TP (and potentially FP) detection.
Use of the GDI for Filtering Out False-Positive Variants in PID NGS Data.
We then assessed the utility of the GDI for filtering out FP variants in the WES data for patients in a specific disease group. We used the PID disease group described above as a case study (38–40). We first estimated the GDI cutoff above which a gene is unlikely to be disease causing (PID causing in this case). For this purpose, we first summarized all currently known 229 PID genes (39, 40) and estimated their GDI scores (Dataset S1, Tab S5). We then adopted the standard assumption of experimental biologists that the maximum tolerable false-negative (FN) rate is 5% (i.e., 5% probability that the true disease-causing gene would be filtered out if the specific cutoff were applied). We therefore estimated the 95% CI for the GDI scores of AD and AR PID genes. The upper limit of this confidence interval was defined as the GDI cutoff above which a gene was considered to be a FP (i.e., having a GDI too high for it to be PID causing), with an estimated FN rate that should be <5%. We were able to filter out 60.62% of heterozygous variants under a model of AD inheritance (i.e., using the cutoff based on all AD PID genes), and 53.30% of homozygous variants under an AR model of inheritance (i.e., using the cutoff based on all AR PID genes) in the 469 most highly mutated genes in patients. The GDI was therefore highly effective for detecting FP variants of highly mutated genes.
GDI Cutoffs for All, Mendelian, PID, and Cancer Disease-Causing Genes.
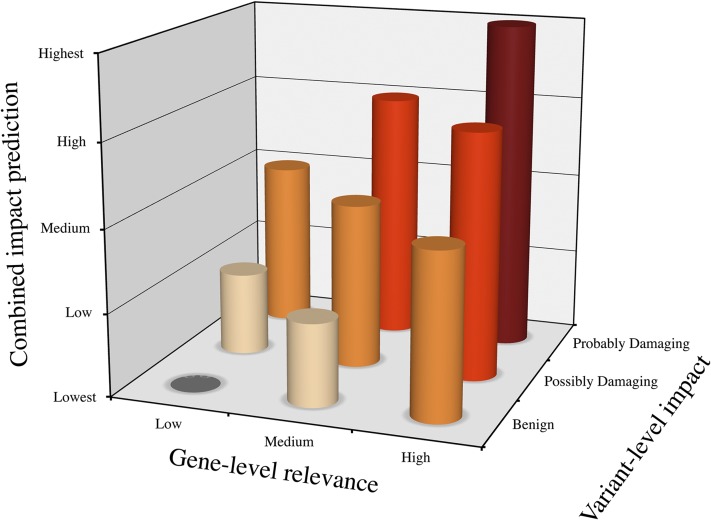
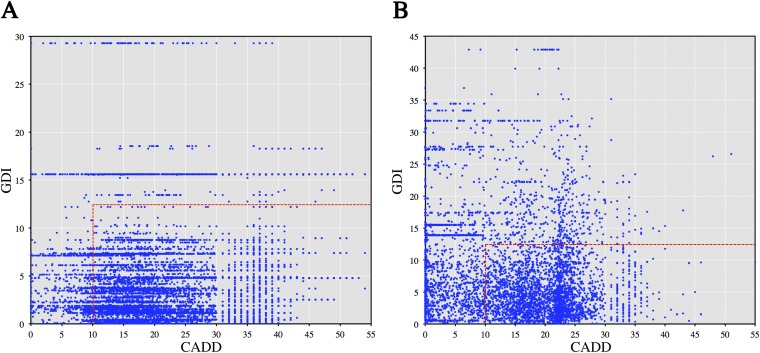
Following the same principle as above, we then proposed GDI cutoffs and estimated FP prediction rates for various diseases (Dataset S1, Tab S6), including a general hypothetical cutoff generated from all 3,490 Human Gene Mutation Database (HGMD) (41) genes with strong experimental evidence for disease causality, 1,207 Mendelian disease-causing genes from OMIM (all, 375 distinctively AD, and 585 distinctively AR) (35), 229 PID genes (all, 42 distinctively AD, and 168 distinctively AR) (39), and 498 cancer genes (involving both germ-line and somatic mutations) extracted from the COSMIC project (all, 120 distinctively recessive, and 360 distinctively dominant) (42). For each human gene, we determined, under the FN <5% model, a low/medium/high damage prediction for the all/Mendelian/PID/cancer disease groups and the different modes of inheritance (Dataset S1, Tab S1). Finally, we suggest that the variant- and gene-level approaches could be used in synergy to create a phenotypic impact gradient (Fig. 4, also demonstrated in Fig. S9 for PID TP/FP differentiation with the hot zone approach using both CADD and GDI) (12), in which benign variants of highly damaged genes have the lowest predicted impact, and putatively damaging variants of genes with low levels of damage are predicted to have the highest impact.
Fig. 4.
Phenotypic impact predicted by a combination of variant-level and gene-level approaches. The hypothesis of combined variant- and gene-level metrics: a benign variant (variant-level) of a highly damaged gene (gene-level) would be expected to have the lowest phenotypic impact, whereas a damaging variant of a gene displaying low levels of damage would be expected to have the greatest phenotypic impact.
Fig. S9.
CADD vs. GDI for true positives and false positives. Comparison of CADD and GDI by the “hot zone” approach, with the cutoffs of GDI < 12.41 combined with CADD > 10 to define a TP (i.e., a candidate disease-causing mutation). Overall, the TP set was much more strongly enriched in TPs than the FP set (P < 1.0 × 10−200). (A) TPs (all HGMD PID disease-causing mutations), with 8,235 candidates within the hot zone and 984 excluded. (B) Randomly sampled FPs (from the set of Fig. S1), with 5,721 candidates within the hot zone and 3,424 excluded.
Discussion
We describe here a genome-wide, population-based metric for mutational damage in all known human protein-coding genes (Dataset S1, Tab S1). We identified and characterized the most and least damaged human genes and calculated an associated GDI with various molecular genetic properties (Dataset S1, Tab S7). We demonstrated that genes highly damaged in the general population are unlikely to cause monogenic disorders. We suggest that the GDI is currently the best performing method (at least as a standalone method) for detecting FPs in patients’ NGS data, whereas RVIS and DNE are better at detecting TPs. The combination of these methods, particularly for the selection of de novo mutations (TPs), appears to be synergistic. The three methods thus appear to capture different and complementary sets of population genetic information. We calculated the power of the GDI for identifying the abundant FP alleles unlikely to be responsible for PIDs in the WES data of patients. We propose GDI cutoff values for different disease groups under a general model or models of AD or AR inheritance. See lab.rockefeller.edu/casanova/GDI for programs and an easy-to-use web server providing GDI and selective pressure predictions for sets of genes.
One advantage of GDI in particular, and of gene-level metrics in general, over the more commonly used variant-level metrics is that GDI information is available for all human genes. By contrast, damage predictions are not always available for variant-level metrics, even with the CADD score, particularly for large insertions/deletions and copy number variation. Furthermore, although variant-level methods are probably best used for predicting a high impact of disruptive mutations, GDI is better suited to the prediction of low impact for variants in highly mutated genes. The two approaches are complementary. Another important and often neglected issue in the selection of an in silico approach is the FN rate. This rate should be considered carefully, and we suggest that 5% is a plausible FN rate for determining the cutoffs of GDI (and other metrics). However, the GDI cutoff could be tailored by the use of different FN rates (such as 1% or 10%), according to the nature of the study. Further studies of mutational damage to human genes should include population-specific analyses, as the GDI probably varies with ethnic background and the demographic history of the population (43). It will also be interesting to extend the GDI to the different isoforms of protein-coding genes (44–46) and noncoding RNAs (47) and to take regulatory variants into account (48). Finally, a consideration of copy number variation would also refine the calculation of the GDI (49). The rigorous study of mutational damage across human genes, at the genome-wide and population levels, together with other genome-wide approaches (11, 15, 50, 51), should facilitate studies of human genetics, particularly for monogenic disorders.
Materials and Methods
A detailed description of the methods applied can be found in SI Materials and Methods. Briefly, we first annotated all alleles with a global MAF <0.5 in the 1,000 Genomes Project (52, 53). We then attributed a predicted damage impact score, C, to each variant with CADD (9). We extracted WES data for 84 patients suffering from PIDs from our in-house database and analyzed in a bioinformatics pipeline described in our previous WES studies (54). For each human gene, we calculated GDI with four different models, and each was Phred homogenized. We compared the performance of GDI with that of state-of-the-art gene-level methods (including all possible combinations between the methods) for detecting FP variants in patients’ WES data with ROC curves and AUCs, using TP sets of known disease-causing genes from OMIM and corresponding FP sets of rare variants from the WES data for 84 PID patients as above (55, 56). We then estimated the power of the above methods (as standalone methods and in combination) to detect TPs in patients (36), identifying a hot zone for each patient and control set separately for each method and combination. We estimated the selective pressure acting on each human gene by the neutrality index (NI) (57–59) at the population level (1,000 Genomes Project). We identified the outliers of the GDI metric (following a gamma distribution) with a modified Z-score (60). We determined the statistical significance of various correlations between GDI and other gene properties and of GDI signature differences between FPs and TPs by Mood’s median test. We used the sets of all known Mendelian PID genes (for which information about AD and AR inheritance was available) to estimate gene-level GDI upper cutoff values, whereas we used HGMD (41) to extract all known human disease-causing genes. We determined the GDI cutoff as the upper limit of the 95% CI for the known disease-causing genes of the disease group (61). We also performed bootstrapping simulations (1,000 iterations each) by Gaussian kernel density random sampling (61, 62). We calculated proteins complexity by first extracting the amino acid sequences corresponding to the proteins (27, 28) and then estimating the relative amino acid composition complexity using Clark’s distance (63, 64).
SI Materials and Methods
Genetic Variant Data Collection and Annotation.
We used ANNOVAR to annotate the associated gene and exonic functions of all alleles with a global MAF < 0.5 in the 1,000 Genomes Project database Phase 3, the largest publicly available whole-genome database containing data from individuals of diverse ethnic backgrounds not suffering from any severe disease at the time of sampling (52, 53). We then attributed a predicted damage impact score, C, to each variant with CADD, a state-of-the-art method combining several leading platforms for assessment of the degree to which a single variant is deleterious (9). We retained only missense, nonsense, and frameshift variants that passed the 1,000 Genomes Project database Phase 3 sequencing quality test.
Extraction and Analysis of the Patients’ WES Data.
We extracted whole-exome sequencing data for 84 patients suffering from rare, severe, and monogenic PID disease from our in-house database. This curated set includes only patients for whom a known (experimentally validated) single disease-causing gene and mutation have been identified. The WES data were generated by the Rockefeller University Genomics Resource Center and by the New York Genome Center and analyzed in a bioinformatics pipeline (including alignment, the removal of duplicated reads, read realignment, and functional annotation) described in our previous WES studies (54). We retained only missense, nonsense, and frameshift variants with an MAF < 0.01 in the 1,000 Genomes Project database Phase 3, and applied the GATK variant quality score recalibration (VQSRT) to sequencing quality, with a threshold of >99.00% (14).
Calculation of Gene Damage Metrics.
For each human gene g with n minor alleles (missense/nonsense/frameshift/in-frame indels/splice, with MAF < 0.5), we calculated GDIg, the cumulative predicted damage to the exonic regions of the gene, by multiplying the CADD raw C score by the count f of each allele A and dividing the expected CE score for a variant with a corresponding allele frequency (calculated by the 1,000 Genomes Project Phase 3 median C score for each allele frequency slot; Fig. S2A) and then summing the results: . We calculated a homogenized Phred I-score for each metric, indicating the ranking of the gene of interest i relative to all other human genes (T = 19,558 genes in our analyses), with values ranging from 0 (lowest Phred score: human gene with lowest GDI) to 42.91 (highest Phred score: most damaged human gene): . The GDI model described had the highest performance, in three alternative forms: (i) raw GDI, as above but without expected CADD score normalization: ; (ii) observed/expected GDI-normalized model, with raw GDI calculated by dividing the observed CADD score values CO by the expected CADD score CE, determined by calculating the 1,000 Genomes Project Phase 3 median C score for each allele frequency slot: ; and (iii) gene size-normalized GDI, where the raw GDI score was normalized by dividing by the CDS length L of the gene’s canonical transcript: .
Performance Estimates by ROC Curve Analysis.
For comparison of the performance of GDI with that of state-of-the-art gene-level approaches for detecting FP variants in patients’ WES data, we first acquired TP sets of known disease-causing genes from OMIM for different Mendelian diseases and modes of inheritance (1,217 in total including 257 X-linked, 585 AR, and 375 AD), and corresponding FP sets of rare (MAF < 0.01 in 1,000 Genomes Project) missense/nonsense/frameshift variants from the WES data for 84 PID patients with known disease-causing mutations, from which the disease-causing mutation was removed (44,668 for all, 1,805 homozygous, and 42,863 heterozygous). For each gene in the FP and TP sets, we determined the raw GDI, RVIS, and DNE scores. We then identified the 14,297 genes for which there were scores available for all methods tested. For these genes, we Phred-scaled the raw scores for each method, as described above. With these similarly scaled scores, we applied a similar weight for each method and calculated an average score for the following combinations: GDI+RVIS, GDI+DNE, GDI+RVIS+DNE, and RVIS+DNE. For the TP and FP sets, we plotted ROC curves for the methods used alone and in combination, testing the general, AD, and AR models separately (55). We smoothed the ROC curves by the maximum-likelihood fitting of univariate distribution smoothing as the main estimate, due to the different score ranges for the different methods, the difference in sample size between FPs and TPs (although in most cases, ROC curves would be expected to cope with that) and because smoothing was shown to yield better estimates than the raw data (56). We estimated the AUC for each method to assess its performance for differentiating TPs from FPs. We compared GDI, the state-of-the-art methods, and their combinations (55). We repeated the same ROC curve plots and AUC calculations for the raw ROC curve estimates (Dataset S1, Tab S3). We then performed a comparison similar to that described above, between the four GDI models described, with the R language pROC package (55).
Estimation of Performance by Hot Zone Analysis.
We estimated the power of the above methods (as standalone methods and in combination) to detect TPs in patients. We used the sets of patients and controls described in previous studies (36, 37), with similar gene-level and variant-level cutoffs to identify a hot zone for each patient and control set, separately for each method and combination. The hot zone was defined at the gene level as being in the top 25% of all genes (i.e., most intolerant by RVIS/least damaged by GDI, etc.) and having a damaging PolyPhen-2 score >0.95. We then determined whether patients had a greater enrichment in hot zone variants than controls, for each method and combination, in Fisher’s exact tests (Dataset S1, Tab S4).
Genome-Wide Selective Pressure Calculation.
We estimated the selective pressure acting on each human gene, by estimating the neutrality index (NI) (57–59) at the population level: , where PN and PS are the numbers of nonsynonymous and synonymous alleles, respectively, at the population level (1,000 Genomes Project) and DN and DS are the numbers of nonsynonymous and synonymous fixed sites, respectively, for the coding sequence of the gene. A summary of all human genes and their associated selection scores is provided in Dataset S1, Tab S7.
Statistical Analyses: Identification of Outliers, Correlation Significance Estimates, GDI Cutoffs, and Bootstrapping Simulations.
We identified the outliers of the GDI metric (following a gamma distribution) with a modified Z-score Mi: , where si is the score of the gene i for the specific metric, š is the median score for all genes in the category considered, and MAD is the median absolute deviation (60). Genes with an absolute M > 3.5 were considered to be outliers (60). We determined the statistical significance of various correlations between GDI and other gene properties and of GDI signature differences between FPs and TPs, by Mood’s median test. We used the sets of all known Mendelian PID genes (for which information about AD and AR inheritance was available) to estimate gene-level GDI upper cutoff values, whereas we used HGMD (41) (when information about AD and AR inheritance was not available) to estimate gene-level GDI upper cutoff values for all known disease-causing genes. We determined the GDI cutoff as the upper limit of the 95% CI for the known disease-causing genes of the disease group (61). We also performed bootstrapping simulations (1,000 iterations each) by Gaussian kernel density random sampling, using the Python programming language Scipy packages (61), plotted with the R programming language ggplot2 package (62).
Proteome-Wide Amino Acid Composition Complexity Prediction.
We extracted the amino acid sequences corresponding to the proteins encoded by the major transcripts of all human genes (27, 28). We then estimated the relative amino acid composition complexity of each protein from the amino acid composition of the average human protein, using Clark’s distance (63, 64) D: , where Pi is the number of residues of amino acid i in protein P with n amino acids, and Qi is the number of residues of amino acid i in the average human protein Q (i.e., the average count for amino acid i among all human proteins).
Programming and Computing Resources.
This project was performed on a Mac Pro machine with 12 cores and 128 GB RAM. Biological distances between genes were calculated with the human gene connectome and server (15, 17). Data extraction, gene damage calculation, network analysis and visualization, selection pressure determination, confidence interval calculation, bootstrapping, and protein composition complexity estimation were carried out with the NetworkX, BioPython, Scipy, Numpy, Rpy2, and standard packages in the Python programming language (16, 58, 61). Statistical analyses, word cloud, density plot, and violin plot analyses were performed with wordcloud (cran.r-project.org/web/packages/wordcloud) and standard R programming language (www.r-project.org). We extracted the CDS length and number of paralogs for all human genes via the Ensembl Biomart interface, version 75 (27, 28).
Data Availability.
The GDI data for all human genes and predicted damage cutoffs, as well as the computer programs for the NGS data analyses carried out here, are freely available to noncommercial users from lab.rockefeller.edu/casanova/GDI.
Supplementary Material
Acknowledgments
We thank Mark G. Thomas for providing insight into molecular evolution, Luis Barreiro for advice about estimating selective pressure, Martin Kircher for assistance with the CADD scoring algorithm, Avner Schlessinger for protein composition bias expertise, Slavé Petrovski for sharing de novo mutation data and gene-level metrics advice, and Yelena Nemirovskaya, Eric Anderson, and Mark Woollett for administrative support. This research was supported in part by March of Dimes Grant 1-FY12-440; National Institute of Allergy and Infectious Diseases Grants 5R37AI095983, 5R01AI088364, 5U01AI088685, and P01AI061093; the Rockefeller University; INSERM; University Paris Descartes; and the St. Giles Foundation. Y.I. was supported in part by Grant UL1 TR000043 from the National Center for Advancing Translational Sciences, National Institutes of Health Clinical and Translational Science Award program; F.G.L. by the New York Stem Cell Foundation; J.G.M. by the Canadian Institutes of Health Research; R.M.-B. by the European Molecular Biology Organization, S.J.d.J. by the German Research Foundation; and X.-F.K. by the Stony-Wold Herbert Fund. D.N.C. and P.D.S. received funding from Qiagen through a licensing agreement with Cardiff University. The laboratory of L.Q.-M. has received funding from the European Research Council under the European Union's Seventh Framework Programme (FP/2007–2013)/ERC Grant Agreement 281297.
Footnotes
The authors declare no conflict of interest.
This article contains supporting information online at www.pnas.org/lookup/suppl/doi:10.1073/pnas.1518646112/-/DCSupplemental.
References
- 1.Casanova JL, Conley ME, Seligman SJ, Abel L, Notarangelo LD. Guidelines for genetic studies in single patients: Lessons from primary immunodeficiencies. J Exp Med. 2014;211(11):2137–2149. doi: 10.1084/jem.20140520. [DOI] [PMC free article] [PubMed] [Google Scholar]
- 2.Bamshad MJ, et al. Exome sequencing as a tool for Mendelian disease gene discovery. Nat Rev Genet. 2011;12(11):745–755. doi: 10.1038/nrg3031. [DOI] [PubMed] [Google Scholar]
- 3.Gilissen C, Hoischen A, Brunner HG, Veltman JA. Disease gene identification strategies for exome sequencing. Eur J Hum Genet. 2012;20(5):490–497. doi: 10.1038/ejhg.2011.258. [DOI] [PMC free article] [PubMed] [Google Scholar]
- 4.Goldstein DB, et al. Sequencing studies in human genetics: Design and interpretation. Nat Rev Genet. 2013;14(7):460–470. doi: 10.1038/nrg3455. [DOI] [PMC free article] [PubMed] [Google Scholar]
- 5.Metzker ML. Sequencing technologies: The next generation. Nat Rev Genet. 2010;11(1):31–46. doi: 10.1038/nrg2626. [DOI] [PubMed] [Google Scholar]
- 6.Belkadi A, et al. Whole-genome sequencing is more powerful than whole-exome sequencing for detecting exome variants. Proc Natl Acad Sci USA. 2015;112(17):5473–5478. doi: 10.1073/pnas.1418631112. [DOI] [PMC free article] [PubMed] [Google Scholar]
- 7.Kumar P, Henikoff S, Ng PC. Predicting the effects of coding non-synonymous variants on protein function using the SIFT algorithm. Nat Protoc. 2009;4(7):1073–1081. doi: 10.1038/nprot.2009.86. [DOI] [PubMed] [Google Scholar]
- 8.Adzhubei IA, et al. A method and server for predicting damaging missense mutations. Nat Methods. 2010;7(4):248–249. doi: 10.1038/nmeth0410-248. [DOI] [PMC free article] [PubMed] [Google Scholar]
- 9.Kircher M, et al. A general framework for estimating the relative pathogenicity of human genetic variants. Nat Genet. 2014;46(3):310–315. doi: 10.1038/ng.2892. [DOI] [PMC free article] [PubMed] [Google Scholar]
- 10.Miosge LA, et al. Comparison of predicted and actual consequences of missense mutations. Proc Natl Acad Sci USA. 2015;112(37):E5189–E5198. doi: 10.1073/pnas.1511585112. [DOI] [PMC free article] [PubMed] [Google Scholar]
- 11.Itan Y, Casanova JL. Can the impact of human genetic variations be predicted? Proc Natl Acad Sci USA. 2015;112(37):11426–11427. doi: 10.1073/pnas.1515057112. [DOI] [PMC free article] [PubMed] [Google Scholar]
- 12.Petrovski S, Wang Q, Heinzen EL, Allen AS, Goldstein DB. Genic intolerance to functional variation and the interpretation of personal genomes. PLoS Genet. 2013;9(8):e1003709. doi: 10.1371/journal.pgen.1003709. [DOI] [PMC free article] [PubMed] [Google Scholar]
- 13.Samocha KE, et al. A framework for the interpretation of de novo mutation in human disease. Nat Genet. 2014;46(9):944–950. doi: 10.1038/ng.3050. [DOI] [PMC free article] [PubMed] [Google Scholar]
- 14.McKenna A, et al. The Genome Analysis Toolkit: A MapReduce framework for analyzing next-generation DNA sequencing data. Genome Res. 2010;20(9):1297–1303. doi: 10.1101/gr.107524.110. [DOI] [PMC free article] [PubMed] [Google Scholar]
- 15.Itan Y, et al. The human gene connectome as a map of short cuts for morbid allele discovery. Proc Natl Acad Sci USA. 2013;110(14):5558–5563. doi: 10.1073/pnas.1218167110. [DOI] [PMC free article] [PubMed] [Google Scholar]
- 16.Hagberg AA, Schult DA, Swart PJ. Exploring network structure, dynamics, and function using NetworkX. In: Varoquaux G, Vaught T, Millman J, editors. Proceedings of the 7th Python in Science Conference (SciPy2008) SciPy2008, Pasadena; CA: 2008. pp. 11–15. [Google Scholar]
- 17.Itan Y, et al. HGCS: An online tool for prioritizing disease-causing gene variants by biological distance. BMC Genomics. 2014;15:256. doi: 10.1186/1471-2164-15-256. [DOI] [PMC free article] [PubMed] [Google Scholar]
- 18.Huang W, Sherman BT, Lempicki RA. Systematic and integrative analysis of large gene lists using DAVID bioinformatics resources. Nat Protoc. 2009;4(1):44–57. doi: 10.1038/nprot.2008.211. [DOI] [PubMed] [Google Scholar]
- 19.Ashburner M, et al. The Gene Ontology Consortium Gene ontology: Tool for the unification of biology. Nat Genet. 2000;25(1):25–29. doi: 10.1038/75556. [DOI] [PMC free article] [PubMed] [Google Scholar]
- 20.Kanehisa M, Goto S, Sato Y, Furumichi M, Tanabe M. KEGG for integration and interpretation of large-scale molecular data sets. Nucleic Acids Res. 2012;40(Database issue):D109–D114. doi: 10.1093/nar/gkr988. [DOI] [PMC free article] [PubMed] [Google Scholar]
- 21.Gilad Y, Lancet D. Population differences in the human functional olfactory repertoire. Mol Biol Evol. 2003;20(3):307–314. doi: 10.1093/molbev/msg013. [DOI] [PubMed] [Google Scholar]
- 22.Gilad Y, Man O, Glusman G. A comparison of the human and chimpanzee olfactory receptor gene repertoires. Genome Res. 2005;15(2):224–230. doi: 10.1101/gr.2846405. [DOI] [PMC free article] [PubMed] [Google Scholar]
- 23.Ast G. How did alternative splicing evolve? Nat Rev Genet. 2004;5(10):773–782. doi: 10.1038/nrg1451. [DOI] [PubMed] [Google Scholar]
- 24.Glickman MH, Ciechanover A. The ubiquitin-proteasome proteolytic pathway: Destruction for the sake of construction. Physiol Rev. 2002;82(2):373–428. doi: 10.1152/physrev.00027.2001. [DOI] [PubMed] [Google Scholar]
- 25.Smith E, Morowitz HJ. Universality in intermediary metabolism. Proc Natl Acad Sci USA. 2004;101(36):13168–13173. doi: 10.1073/pnas.0404922101. [DOI] [PMC free article] [PubMed] [Google Scholar]
- 26.Tomer R, Denes AS, Tessmar-Raible K, Arendt D. Profiling by image registration reveals common origin of annelid mushroom bodies and vertebrate pallium. Cell. 2010;142(5):800–809. doi: 10.1016/j.cell.2010.07.043. [DOI] [PubMed] [Google Scholar]
- 27.Flicek P, et al. Ensembl 2013. Nucleic Acids Res. 2013;41(Database issue):D48–D55. doi: 10.1093/nar/gks1236. [DOI] [PMC free article] [PubMed] [Google Scholar]
- 28.Haider S, et al. BioMart Central Portal–unified access to biological data. Nucleic Acids Res. 2009;37(Web Server issue):W23–W27. doi: 10.1093/nar/gkp265. [DOI] [PMC free article] [PubMed] [Google Scholar]
- 29.Manry J, et al. Evolutionary genetic dissection of human interferons. J Exp Med. 2011;208(13):2747–2759. doi: 10.1084/jem.20111680. [DOI] [PMC free article] [PubMed] [Google Scholar]
- 30.Ohno S. Evolution by Gene Duplication. Springer-Verlag; New York: 1970. [Google Scholar]
- 31.Koonin EV. Orthologs, paralogs, and evolutionary genomics. Annu Rev Genet. 2005;39:309–338. doi: 10.1146/annurev.genet.39.073003.114725. [DOI] [PubMed] [Google Scholar]
- 32.Itan Y, Bryson K, Thomas MG. Detecting gene duplications in the human lineage. Ann Hum Genet. 2010;74(6):555–565. doi: 10.1111/j.1469-1809.2010.00609.x. [DOI] [PubMed] [Google Scholar]
- 33.Brown CJ, Johnson AK, Dunker AK, Daughdrill GW. Evolution and disorder. Curr Opin Struct Biol. 2011;21(3):441–446. doi: 10.1016/j.sbi.2011.02.005. [DOI] [PMC free article] [PubMed] [Google Scholar]
- 34.Fuxreiter M, Tompa P, Simon I. Local structural disorder imparts plasticity on linear motifs. Bioinformatics. 2007;23(8):950–956. doi: 10.1093/bioinformatics/btm035. [DOI] [PubMed] [Google Scholar]
- 35.Hamosh A, Scott AF, Amberger JS, Bocchini CA, McKusick VA. Online Mendelian Inheritance in Man (OMIM), a knowledgebase of human genes and genetic disorders. Nucleic Acids Res. 2005;33(Database issue):D514–D517. doi: 10.1093/nar/gki033. [DOI] [PMC free article] [PubMed] [Google Scholar]
- 36.Zhu X, et al. Whole-exome sequencing in undiagnosed genetic diseases: interpreting 119 trios. Genet Med. January 15, 2015 doi: 10.1038/gim.2014.191. [DOI] [PMC free article] [PubMed] [Google Scholar]
- 37.Zhu X, Need AC, Petrovski S, Goldstein DB. One gene, many neuropsychiatric disorders: Lessons from Mendelian diseases. Nat Neurosci. 2014;17(6):773–781. doi: 10.1038/nn.3713. [DOI] [PubMed] [Google Scholar]
- 38.Conley ME, Casanova JL. Discovery of single-gene inborn errors of immunity by next generation sequencing. Curr Opin Immunol. 2014;30:17–23. doi: 10.1016/j.coi.2014.05.004. [DOI] [PMC free article] [PubMed] [Google Scholar]
- 39.Al-Herz W, et al. Primary immunodeficiency diseases: An update on the classification from the international union of immunological societies expert committee for primary immunodeficiency. Front Immunol. 2014;5:162. doi: 10.3389/fimmu.2014.00162. [DOI] [PMC free article] [PubMed] [Google Scholar]
- 40.Itan Y, Casanova JL. Novel primary immunodeficiency candidate genes predicted by the human gene connectome. Front Immunol. 2015;6:142. doi: 10.3389/fimmu.2015.00142. [DOI] [PMC free article] [PubMed] [Google Scholar]
- 41.Stenson PD, et al. The Human Gene Mutation Database: Building a comprehensive mutation repository for clinical and molecular genetics, diagnostic testing and personalized genomic medicine. Hum Genet. 2014;133(1):1–9. doi: 10.1007/s00439-013-1358-4. [DOI] [PMC free article] [PubMed] [Google Scholar]
- 42.Forbes SA, et al. COSMIC: exploring the world's knowledge of somatic mutations in human cancer. Nucleic Acids Res. 2015;43(Database issue):D805–811. doi: 10.1093/nar/gku1075. [DOI] [PMC free article] [PubMed] [Google Scholar]
- 43.Hussin JG, et al. Recombination affects accumulation of damaging and disease-associated mutations in human populations. Nat Genet. 2015;47(4):400–404. doi: 10.1038/ng.3216. [DOI] [PubMed] [Google Scholar]
- 44.Esteller M. Non-coding RNAs in human disease. Nat Rev Genet. 2011;12(12):861–874. doi: 10.1038/nrg3074. [DOI] [PubMed] [Google Scholar]
- 45.Zhang C, et al. Integrative modeling defines the Nova splicing-regulatory network and its combinatorial controls. Science. 2010;329(5990):439–443. doi: 10.1126/science.1191150. [DOI] [PMC free article] [PubMed] [Google Scholar]
- 46.Siddle KJ, et al. A genomic portrait of the genetic architecture and regulatory impact of microRNA expression in response to infection. Genome Res. 2014;24(5):850–859. doi: 10.1101/gr.161471.113. [DOI] [PMC free article] [PubMed] [Google Scholar]
- 47.Consortium EP. ENCODE Project Consortium An integrated encyclopedia of DNA elements in the human genome. Nature. 2012;489(7414):57–74. doi: 10.1038/nature11247. [DOI] [PMC free article] [PubMed] [Google Scholar]
- 48.Martin AR, et al. Transcriptome sequencing from diverse human populations reveals differentiated regulatory architecture. PLoS Genet. 2014;10(8):e1004549. doi: 10.1371/journal.pgen.1004549. [DOI] [PMC free article] [PubMed] [Google Scholar]
- 49.Stankiewicz P, Lupski JR. Structural variation in the human genome and its role in disease. Annu Rev Med. 2010;61:437–455. doi: 10.1146/annurev-med-100708-204735. [DOI] [PubMed] [Google Scholar]
- 50.Snyder MW, Adey A, Kitzman JO, Shendure J. Haplotype-resolved genome sequencing: Experimental methods and applications. Nat Rev Genet. 2015;16(6):344–358. doi: 10.1038/nrg3903. [DOI] [PubMed] [Google Scholar]
- 51.Heinzen EL, Neale BM, Traynelis SF, Allen AS, Goldstein DB. The genetics of neuropsychiatric diseases: Looking in and beyond the exome. Annu Rev Neurosci. 2015;38:47–68. doi: 10.1146/annurev-neuro-071714-034136. [DOI] [PubMed] [Google Scholar]
- 52.Abecasis GR, et al. 1000 Genomes Project Consortium An integrated map of genetic variation from 1,092 human genomes. Nature. 2012;491(7422):56–65. doi: 10.1038/nature11632. [DOI] [PMC free article] [PubMed] [Google Scholar]
- 53.Wang K, Li M, Hakonarson H. ANNOVAR: Functional annotation of genetic variants from high-throughput sequencing data. Nucleic Acids Res. 2010;38(16):e164. doi: 10.1093/nar/gkq603. [DOI] [PMC free article] [PubMed] [Google Scholar]
- 54.Bolze A, et al. Ribosomal protein SA haploinsufficiency in humans with isolated congenital asplenia. Science. 2013;340(6135):976–978. doi: 10.1126/science.1234864. [DOI] [PMC free article] [PubMed] [Google Scholar]
- 55.Robin X, et al. pROC: An open-source package for R and S+ to analyze and compare ROC curves. BMC Bioinformatics. 2011;12:77. doi: 10.1186/1471-2105-12-77. [DOI] [PMC free article] [PubMed] [Google Scholar]
- 56.Lloyd CJ, Yong Z. Kernel estimators of the ROC curve are better than empirical. Stat Probab Lett. 1999;44(3):221–228. [Google Scholar]
- 57.Rand DM, Kann LM. Excess amino acid polymorphism in mitochondrial DNA: contrasts among genes from Drosophila, mice, and humans. Mol Biol Evol. 1996;13(6):735–748. doi: 10.1093/oxfordjournals.molbev.a025634. [DOI] [PubMed] [Google Scholar]
- 58.Cock PJ, et al. Biopython: Freely available Python tools for computational molecular biology and bioinformatics. Bioinformatics. 2009;25(11):1422–1423. doi: 10.1093/bioinformatics/btp163. [DOI] [PMC free article] [PubMed] [Google Scholar]
- 59.Stoletzki N, Eyre-Walker A. Estimation of the neutrality index. Mol Biol Evol. 2011;28(1):63–70. doi: 10.1093/molbev/msq249. [DOI] [PubMed] [Google Scholar]
- 60.Iglewicz B, Hoaglin D. How to Detect and Handle Outliers. ASQC Quality Press; Milwaukee: 1993. p. 87. [Google Scholar]
- 61.Oliphant TE. Python for scientific computing. Comput Sci Eng. 2007;9(3):10–20. [Google Scholar]
- 62.Wickham H. ggplot2: Elegant Graphics for Data Analysis. Springer; New York: 2009. [Google Scholar]
- 63.Cha S. Comprehensive survey on distance/similarity measures between probability density functions. Int J Math Models Methods Appl Sci. 2007;1(4):300–307. [Google Scholar]
- 64.Wootton JC, Federhen S. Statistics of local complexity in amino acid sequences and sequence databases. Comput Chem. 1993;17(2):149–163. [Google Scholar]
Associated Data
This section collects any data citations, data availability statements, or supplementary materials included in this article.
Supplementary Materials
Data Availability Statement
The GDI data for all human genes and predicted damage cutoffs, as well as the computer programs for the NGS data analyses carried out here, are freely available to noncommercial users from lab.rockefeller.edu/casanova/GDI.


