Significance
We report the characterization of two novel glutamate receptor subunits from recently sequenced ctenophore genomes. The origin of vertebrate NMDA subtype ionotropic glutamate receptors (iGluRs), which play a major role in synaptic plasticity and which require both glutamate and glycine for activation of ion channel gating, is not well understood. Using X-ray crystallography of the ligand binding domains of iGluRs from the comb jelly Mnemiopsis leidyi and the sea gooseberry Pleurobrachia bachei, candidates for the earliest lineage metazoans, we discovered that a large subset of these iGluR subunits form glycine receptors. Similarities to modern-day NMDA receptors suggest NMDA and ctenophore receptors may provide clues to the role of iGluRs in the evolution of neural systems in metazoa.
Keywords: NMDA receptors, ctenophores, crystal structures, evolution
Abstract
Recent genome projects for ctenophores have revealed the presence of numerous ionotropic glutamate receptors (iGluRs) in Mnemiopsis leidyi and Pleurobrachia bachei, among our earliest metazoan ancestors. Sequence alignments and phylogenetic analysis show that these form a distinct clade from the well-characterized AMPA, kainate, and NMDA iGluR subtypes found in vertebrates. Although annotated as glutamate and kainate receptors, crystal structures of the ML032222a and PbiGluR3 ligand-binding domains (LBDs) reveal endogenous glycine in the binding pocket, whereas ligand-binding assays show that glycine binds with nanomolar affinity; biochemical assays and structural analysis establish that glutamate is occluded from the binding cavity. Further analysis reveals ctenophore-specific features, such as an interdomain Arg-Glu salt bridge, present only in subunits that bind glycine, but also a conserved disulfide in loop 1 of the LBD that is found in all vertebrate NMDA but not AMPA or kainate receptors. We hypothesize that ctenophore iGluRs are related to an early ancestor of NMDA receptors, suggesting a common evolutionary path for ctenophores and bilaterian species, and suggest that future work should consider both glycine and glutamate as candidate neurotransmitters in ctenophore species.
In the nervous system and neuromuscular junction of many animal species, the amino acid l-glutamate acts as an excitatory neurotransmitter. The molecular organization of glutamate receptor ion channel (iGluR) subunits into an amino terminal domain (ATD), and a ligand binding domain (LBD) bisected by insertion of a pore loop ion channel generates a unique structural signature, distinct from that for other neurotransmitter receptors, that is easily identified by sequence analysis. Using this approach, hundreds of iGluR homologs are emerging from genome sequencing projects (1–5). Virtually all of these are glutamate receptors in name only; their functional properties, physiological function, and the ligands they bind have yet to be determined. Recent large-scale sequencing projects, which place ctenophores as candidates for the earliest metazoan lineage, reveal that iGluR homologs are abundantly represented in the genomes of the comb jelly Mnemiopsis leidyi and the sea gooseberry Pleurobrachia bachei, suggesting that glutamate was selected to act as a neurotransmitter very early in evolution (4, 5). The muscle cells of P. bachei respond to application of glutamate with action potential generation and both species have neural networks and exhibit complex predatory behaviors that might also be generated by iGluR activity (4, 5). However, as for most species studied in sequencing projects, ctenophore iGluRs have yet to be characterized.
By contrast to our primitive state of knowledge for iGluRs recently discovered by genome sequencing projects, the iGluRs of vertebrate species have been extensively characterized, and based on their ligand binding properties, amino acid sequences, functional properties, and structures, have been classified into AMPA, kainate, NMDA, and delta receptors (6–14). Of these, NMDA receptors are unique in that they form heteromeric assemblies that require binding of both glycine to GluN1 or GluN3 subunits and glutamate to GluN2 subunits for activation of ion channel gating (12, 14–17), as well as depolarization to relieve ion channel block by extracellular Mg2+ (18, 19). The initial annotation of the M. leidyi genome identified 16 candidate iGluR genes (4), whereas in the draft genome of P. bachei, 14 iGluRs were annotated as kainate-like receptors (5). In view of growing interest in the molecular evolution of ion channels and receptors, and the pivotal role that ctenophores play in our current understanding of nervous system development (20), we initiated a structural and functional characterization of glutamate receptors expressed in both species. To our surprise, we identified a large subset of ctenophore iGluRs from both M. leidyi and P. bachei that bind glycine but not glutamate with nanomolar affinity; one of these, ML03222a, forms homomeric glycine activated ion channels when expressed in Xenopus oocytes. By contrast, a second M. leidyi iGluR subunit, ML05909a, forms homomeric ion channels that are activated by millimolar concentrations of glutamate, while by contrast glycine acts as a very weak partial agonist that inhibits responses to glutamate. Comparison of the LBD crystal structures of two ctenophore iGluRs that bind glycine with nanomolar affinity, with the crystal structures of glutamate and glycine binding subunits of classical NMDA receptors, reveals a conserved disulfide in loop 1 of the LBD found in all ctenophore iGluRs, and also in NMDA but not AMPA or kainate receptors; however, the mechanisms underlying selectivity for glycine are distinct in vertebrate and ctenophore iGluRs, suggesting that NMDA receptors evolved from an ancestral protein, further modification of which occurred after bilaterians split from ctenophores during the evolution of metazoan species.
Results
Crystal Structures of the M. leidyi ML032222a and P. bachei iGluR3 LBDs.
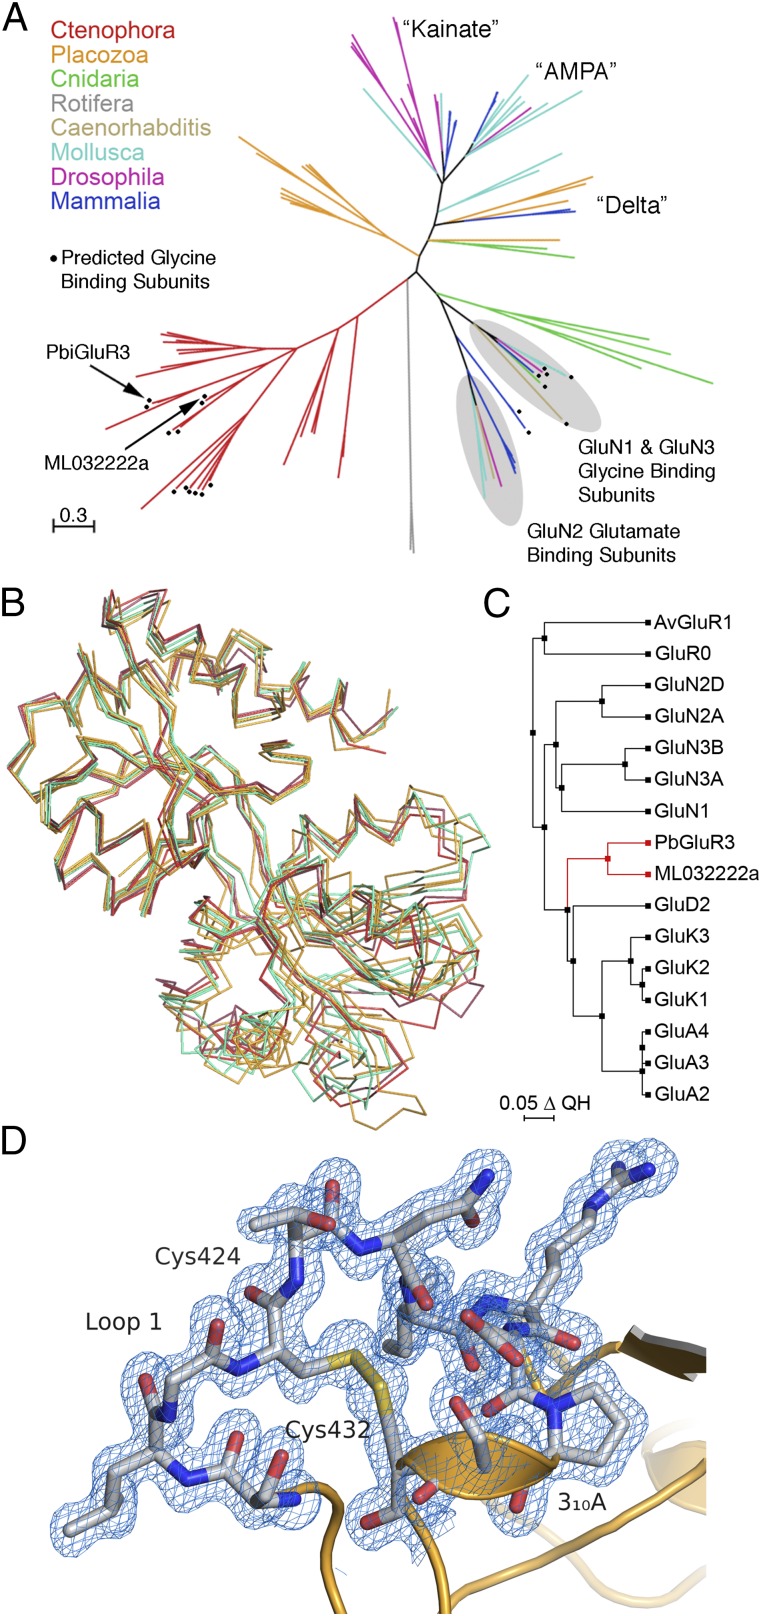
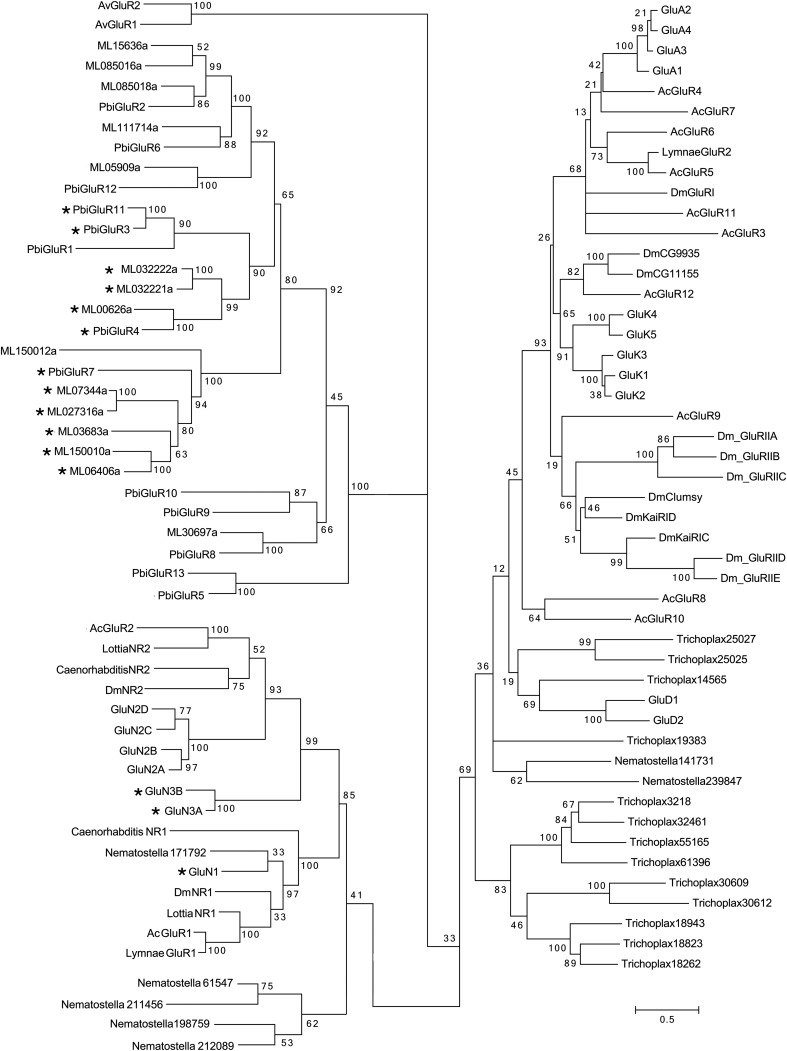
Sequence analysis reveals that ctenophore iGluRs cluster in a unique clade, distinct from AMPA, kainate, and NMDA receptor subtypes found in arthropods, cnidarians, molluscs, placozoans, and vertebrates (Fig. 1A and Fig. S1). Based on alignments of M. leidyi and P. bachei iGluR amino acid sequences with representative AMPA (GluA2), kainate (GluK2), and NMDA (GluN1, GluN2A, and GluN3A) subunits, we selected seven M. leidyi and two P. bachei iGluRs for study based on the following criteria: the presence of a signal peptide predicted by the Signal P 4.1 server (21); an ATD of length ∼380 residues, with a conserved disulfide bond between α-helix 2 and the “flap loop” found in ATD crystal structures (22, 23); an ∼260 residue S1S2 LBD containing a conserved disulfide bond in domain 2 (24–26); a four-helix pore loop ion channel domain with conserved sequence elements in the pre-M1, M3, and M4 α-helices (9, 12, 14); and a cytoplasmic C-terminal domain (Table S1 and Fig. S2). Most of the remaining ctenophore iGluR genes either lacked signal peptides or had deletions or insertions in the ATD, LBD, or ion channel (Table S1), perhaps due to genome assembly errors. LBD S1S2 constructs for the selected iGluR subunits were screened for expression as soluble proteins in Escherichia coli and subsequently purified in the presence of 2 mM glutamate for crystallization trials. Of the nine S1S2 constructs tested, M. leidyi ML032222a and P. bachei iGluR3 gave crystals that diffracted X-rays to high resolution; we solved structures for these ctenophore LBDs at resolutions of 1.21 and 1.50 Å, respectively, by molecular replacement using the GluK2 kainate receptor LBD crystal structure as a search probe (Fig. 1B and Table S2).
Fig. 1.
Evolutionary analysis of ctenophore glutamate receptors. (A) Phylogenetic analysis for 100 iGluRs from a diverse range of animal species reveals clustering of ctenophore iGluRs in a unique branch on the maximum likelihood topology tree; black circles indicate ctenophore iGluRs predicted to bind glycine; the remaining ctenophore iGluRs likely bind glutamate; the branch length scale bar indicates the number of substitutions per site. (B) CA traces for which loop1 and loop 2 coordinates are not shown, following least squares superpositions using core domain 1 CA coordinates for the LBD crystal structures of ML032222a and PbiGluR3 (red); GluA2, GluK2 and GluN2A (orange); GluN1 and GluN3A (green). (C) Phylogenetic tree calculated using structural alignments for 16 iGluR LBD crystal structures. (D) Electron density map (1.5-Å resolution 2mFo-DFc contoured at 1 σ) for the disulfide bond in loop 1 of PbiGluR3.
Fig. S1.
Phyologenetic analysis with bootstrap values for 100 iGluRs from which the cladogram shown in Fig. 1A was generated. *Candidate glycine binding subunits.
Table S1.
Gene annotation for ctenophore ionotropic glutamate receptors
| Gene | Length | SP cut | ATD | LBD S1S2 | TMD | Salt bridge | Ligand |
| Conserved | |||||||
| ML032221a | 921 | T19-E20 | Normal | Normal | Normal | R704 | Gly |
| ML032222a | 912 | E20-T21 | Normal | Normal | Normal | R703 | Gly |
| ML03683a | 923 | C18-Y19 | Normal | Normal | Normal | R714 | Gly |
| PbiGluR3 | 915 | A17-K18 | Normal | Normal | Normal | R681 | Gly |
| PbiGluR4 | 938 | S15-L16 | Normal | Normal | Normal | R695 | Gly |
| ML05909a | 949 | S17-R18 | Normal | Normal | Normal | S736 | Glu |
| ML085016a | 951 | T16-Q17 | Normal | Normal | Normal | S728 | Glu |
| ML15636a | 956 | T19-E20 | Normal | Normal | Normal | S729 | Glu |
| PbiGluR2 | 948 | G23-R24 | Normal | Normal | Normal | S721 | Glu |
| PbiGluR6 | 973 | G18-L19 | Normal | Normal | Normal | S720 | Glu |
| ML150012a | 1,005 | G25-T26 | Normal | Normal | Normal | I705 | Not α-AA |
| ∆ Architecture | |||||||
| ML00626a | 961 | None | +50 | Normal | Normal | R753 | Gly |
| ML027316a | 739 | None | −105 | Normal | −55 | R574 | Gly |
| ML06406a | 709 | None | −225 | Normal | Normal | R491 | Gly |
| ML07344a | 1,473 | None | +570 | Normal | −36 | R1234 | Gly |
| ML085018a | 600 | None | −350 | Normal | Normal | S362 | Glu |
| ML111714a | 890 | None | −20 | Normal | −15 | S696 | Glu |
| ML150010a | 1,346 | None | +440 | Normal | −36 | R1122 | Gly |
| ML150013a | 474 | None | −50 | S2 Absent | — | — | — |
| ML30697a | 1,029 | G39-V40 | +55 | Normal | Normal | T822 | Glu |
| PbiGluR1 | 760 | None | −130 | Normal | Normal | G569 | Glu |
| PbiGluR5 | 1,077 | A15-Y16 | Normal | Normal | −50 | T676 | Not α-AA |
| PbiGluR7 | 848 | None | −70 | Normal | Normal | R636 | Gly |
| PbiGluR8 | 902 | None | −60 | Normal | Normal | T653 | Glu |
| PbiGluR9 | 1,049 | None | −60 | Normal | Normal | T660 | Glu |
| PbiGluR10 | 1,169 | I26-F27 | +250 | Normal | Normal | T936 | Glu |
| PbiGluR11 | 825 | T15-K16 | Normal | Normal | −90 | R594 | Gly |
| PbiGluR12 | 954 | G19-E20 | −15 | S2 −35 | Normal | G755 | Glu |
| PbiGluR13 | 1,563 | G20-Q21 | +365 | S1: +60 | Normal | T1160 | Not α-AA |
Length indicates the number of amino acids predicted by the cDNA ORF. Signal peptide cleavage sites (SP cut) were predicted by the Signal P 4.1 server. ATD, LBD S1S2, and TMD columns indicate additions or deletions of amino acids from the conserved iGluR architecture revealed by alignments with vertebrate iGluRs. Salt bridge indicates the residue present at the equivalent position to Arg-703 and Arg-681 in the interdomain salt bridges of ML032222a and PbiGluR3, respectively. The ligand column indicates putative ligand identification of either glycine or glutamate, except for ML032222a and PbiGluR3 (bold text), which were established by crystallographic analysis; not α-AA indicates loss of the conserved Glu/Asp residue, which binds the ligand α-amino group in other iGluRs (Fig. S4 and Fig. S8).
Fig. S2.
(A) Amino acid sequence alignments for representative vertebrate iGluR subunits and nine ctenophore iGluR subunits selected for expression of LBD S1S2 constructs. Key structural features include a conserved disulfide bond between α-helix 2 and the flap loop in the ATD; an Arg residue in α-helix D of the LBD that binds the ligand α-COOH group; and pre-M1 and M1 transmembrane α-helices. Also indicated is a Cys rich intracellular loop between ion channel α-helices M1 and M2 that is unique to ctenophore iGluRs, and the Glu residue (SB) that forms an interdomain salt bridge in a subset of ctenophore iGluRs. (B) Amino acid sequence alignments for the M2, M3, and M4 transmembrane α-helices and a conserved disulfide bond in domain 2 of the LBD after α-helix I. The RNA editing (Q/R) and +4 sites which are determinants of ion channel block by cytoplasmic polyamines are indicated.
Table S2.
Data collection and refinement statistics
| X-Ray analysis | ML032222a | ML032222a | ML032222a | ML032222a | PbGluR3 |
| Data collection | |||||
| Ligand | Glycine | Alanine | d-Serine | l-Serine | Glycine |
| Space group | P21 | P21 | P21 | P21 | P6522 |
| Unit cell a, b, c (Å) | 45.9, 123.3, 54.3 | 46.0, 123.9, 54.5 | 45.9, 123.8, 54.5 | 45.9, 123.4, 54.3 | 159.8, 159.8, 55.6 |
| α, β, γ | 90, 112.1, 90 | 90, 111.6, 90 | 90, 111.8, 90 | 90, 112.1, 90 | 90, 90, 120 |
| Number per a.u. | 2 | 2 | 2 | 2 | 1 |
| Wavelength (Å) | 1.0000 | 1.0000 | 1.0000 | 1.0000 | 1.000 |
| Resolution (Å)a | 40–1.21 (1.23) | 40.0–1.40 (1.42) | 40.0–1.38 (1.40) | 40.0–1.46 (1.49) | 30–1.50 (1.53) |
| Unique observations | 169396 | 110735 | 115480 | 92758 | 67058 |
| Mean redundancyb | 3.6 (2.9) | 3.7 (2.5) | 3.7 (2.9) | 3.5 (3.1) | 10.9 (8.9) |
| Completeness (%)b | 90.8 (64.8) | 99.1 (87.1) | 99.6 (95.6) | 95.0 (86.4) | 98.7 (97.6) |
| Rmergeb,c | 0.051 (0.41) | 0.062 (0.50) | 0.065 (0.61) | 0.061 (0.54) | 0.039 (0.94) |
| Rpimb,d | 0.033 (0.303) | 0.037 (0.376) | 0.039 (0.410) | 0.037 (0.344) | 0.012 (0.321) |
| I/σ (I)b | 20.8 (2.0) | 19.6 (1.9) | 19.5 (1.7) | 20.0 (2.2) | 59.4 (2.5) |
| Refinement | |||||
| Resolution (Å) | 31.8–1.21 | 39.2–1.40 | 35.1–1.38 | 39.0–1.46 | 29.4–1.50 |
| Protein atoms (AC)e | 4227 (227) | 4202 (196) | 4182 (172) | 4139 (133) | 2025 (82) |
| Ligand atoms | 10 | 22 | 24 | 24 | 5 |
| Ligand occupancyf | 1.0 | 0.74 (0.26) | 0.53 (0.47) | 0.31 (0.69) | 1.0 |
| Mg/Na/SO4 ions | 1/0/1 | 0/0/0 | 1/0/0 | 1/0/0 | 0/2/2 |
| Water atoms | 818 | 824 | 778 | 743 | 406 |
| Rwork/Rfree (%)g | 13.4/16.1 | 14.0/16.5 | 14.4/16.7 | 13.7/16.4 | 15.6/17.7 |
| RMS deviations | |||||
| Bond lengths (Å) | 0.008 | 0.009 | 0.009 | 0.009 | 0.015 |
| Bond angles (°) | 1.22 | 1.25 | 1.23 | 1.26 | 1.57 |
| Mean B-Values (Å2) | |||||
| Protein overall | 18.8 | 15.0 | 17.2 | 19.3 | 18.4 |
| MC/SCh | 17.2/20.3 | 13.0/17.0 | 15.0/19.4 | 17.3/21.4 | 15.9/21.0 |
| Ligand | 12.8 | 7.7 | 10.1 | 12.3 | 11.2 |
| Mg/Na/SO4 ions | 10.1/–/24.4 | –/–/– | 24.3/–/– | 13.3/–/– | –/40.5/22.7 |
| Water | 32.0 | 29.2 | 31.2 | 32.9 | 33.5 |
| Ramachandran %i | 97.8/0.2 | 97.7/0.8 | 97.5/0.8 | 97.3/0.4 | 98.0/0.0 |
| Molprobity scorej | 0.82 (100) | 1.11 (98) | 1.3 (93) | 1.14 (98) | 1.07 (99) |
Values in parentheses indicate the low-resolution limit for the highest-resolution shell of data.
Values in parentheses indicate statistics for the highest-resolution shell of data.
Rmerge = (Σ| II − <II>|)/ΣI |II |, where <II> is the mean II over symmetry–equivalent reflections.
Rpim = , where <II> is the mean II over symmetry–equivalent reflections.
Alternate conformations.
For the alanine, d-serine, and l-serine complexes, the occupancy of glycine given in parentheses.
Rwork = (Σ ||Fo| − |Fc||)/Σ |Fo|, where Fo and Fc denote observed and calculated structure factors, respectively; 5% of the reflections were set aside for the calculation of the Rfree value.
Main chain/side chain.
Preferred/disallowed conformations.
Molprobity score; values in parentheses, where 100 is the best, are percentile values compared with structures of similar resolution.
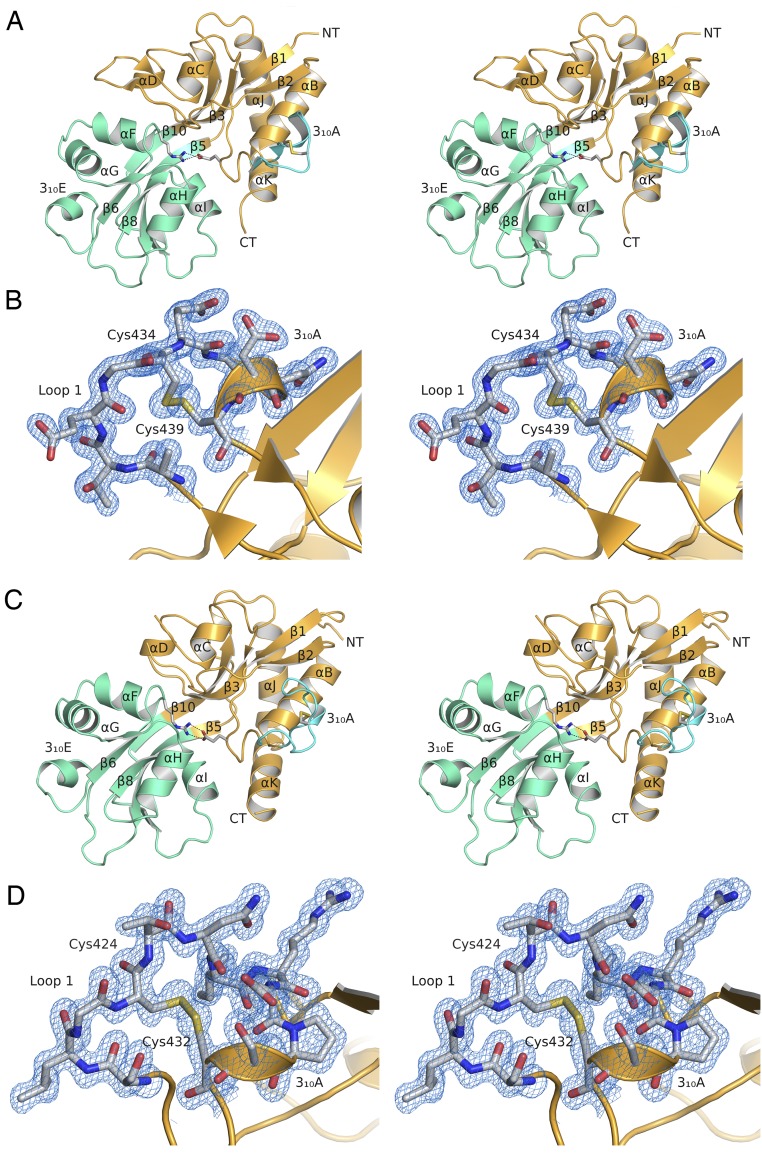
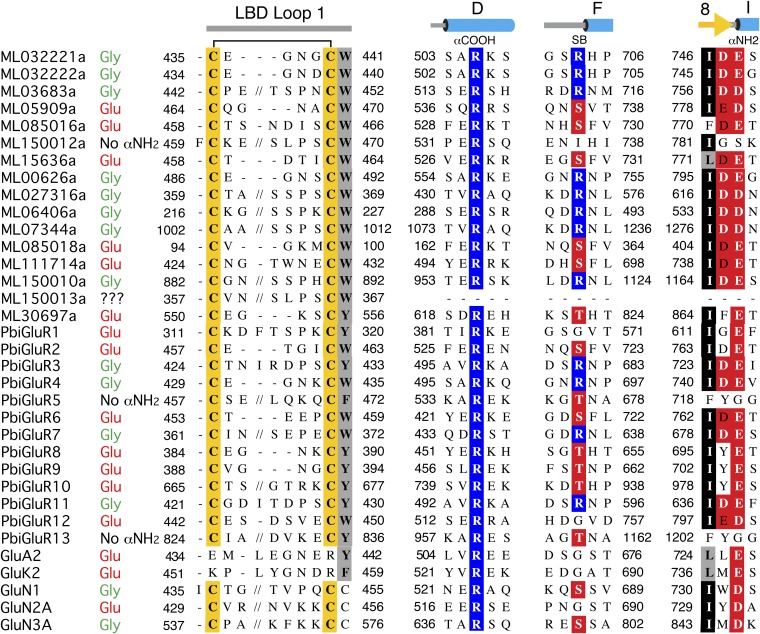
The ML032222a and PbiGluR3 LBDs share high structural similarity, with a 0.97-Å RMSD for least squares superposition using 237 CA atom coordinates; both have a 310 helix in loop 1 and an extended 310 helix in domain 2. Superposition of the ML032222a LBD on representative vertebrate iGluR LBD crystal structures (Fig. 1B) revealed highly conserved domain 1 secondary structures, with RMSDs for 119 residues of 1.11 (GluA2), 0.97 (GluK2), 0.93 (GluN1), 1.23 (GluN2A), and 0.88 Å (GluN3A). Domain 2 showed much greater variability (Fig. 1B), with RMSDs of 1.87 (GluA2), 1.64 (GluK2), 2.16 (GluN1), 2.54 (GluN2A), and 2.19 Å (GluN3A); however, this was largely due to conformational differences at the distal surface, away from the ligand binding pocket. By contrast, similar to domain 1, the core structure of domain 2, consisting of 50 residues forming β-strands 5, 6, 7, and 8 and the N-terminal halves of α-helices F, H, and I (Fig. S3), showed high structural similarity, with RMSDs of 0.99 (GluA2), 0.98 (GluK2), 0.98 (GluN1), 1.13 (GluN2A), and 0.99 Å (GluN3A). Consistent with the annotation of P. bachei iGluRs as kainate receptors, a structure-based phylogenetic analysis (27), which compared the ctenophore crystal structures with 14 prokaryotic, rotifer, and vertebrate iGluR LBD crystal structures, revealed that the ctenophore LBDs arise from a branch that leads to AMPA and kainate receptors, whereas NMDA receptors arise from a separate branch (Fig. 1C). However, both ML032222a and PbiGluR3 have a disulfide bond in loop 1 that is found in all seven vertebrate NMDA receptor subunits but not in AMPA or kainate receptors, and thus their classification is ambiguous from structural and sequence alignments alone (Fig. 1D and Figs. S3 and S4).
Fig. S3.
Stereoviews of ctenophore iGluR LBD crystal structures. (A) Ribbon diagram for ML032222a with domains 1 and 2 of the LBD colored gold and green, respectively; loop 1 is shown in cyan. Stick representation is used to show residues forming a disulfide bond in loop 1, and the salt bridge linking domains 1 and 2. (B) Stereoview of a ML032222a 2mFo-DFc electron density map at 1.21-Å resolution for the disulfide bond in loop 1 contoured at 1 σ. (C) Ribbon diagram for PbiGluR3 colored as described above. Note that in both structures domain 2 contains a six residue 310 helix. (D) Stereoview of a PbiGluR3 2mFo-DFc electron density map at 1.5-Å resolution for the disulfide bond in loop 1 contoured at 1 σ. funnel leading to the binding site.
Fig. S4.
Amino acid sequence alignments for the LBDs of 14 M. leidyi iGluR subunits, 13 P. bachei iGluR subunits, and 5 representative vertebrate iGluR subunits, showing conserved structural features including a conserved disulfide bond in loop 1 of ctenophore and NMDA receptors, but not AMPA or kainate receptors. Additional structural features include an Arg residue in α-helix D of the LBD that binds the ligand α-COOH group, and the acidic residue in β-strand 8 that forms an ion pair interaction with the ligand α-NH2 group; in the ligand column, no α-NH2 indicates that the ligand is unlikely to be an α-amino acid because these subunits lack the conserved acidic residue in β-strand 8 that binds the ligand α-NH2 group of Gly and Glu. The candidate ligand assigned based on the presence of an Arg residue at the N terminus of helix F that forms an interdomain salt bridge in ctenophore iGluRs with an Asp residue in β-strand 8 that is indicated in bold white type.
The M. leidyi ML032222a dimer assembly is specialized to function in a marine environment.
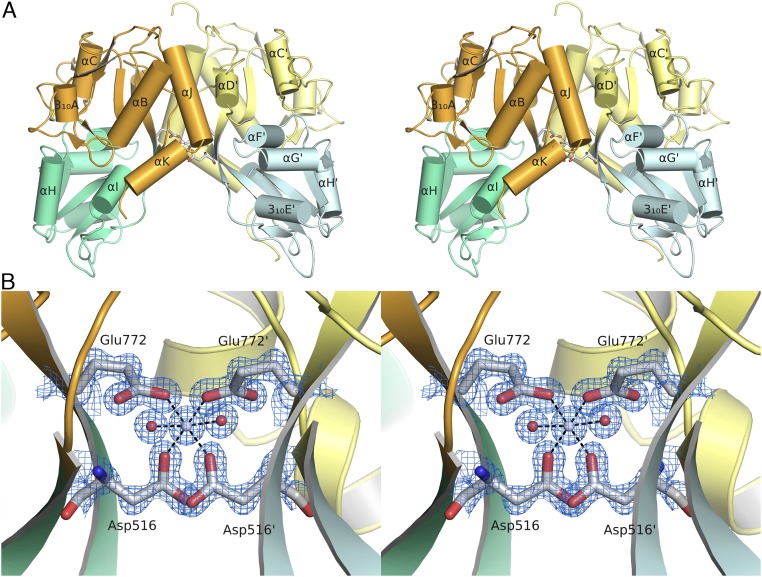
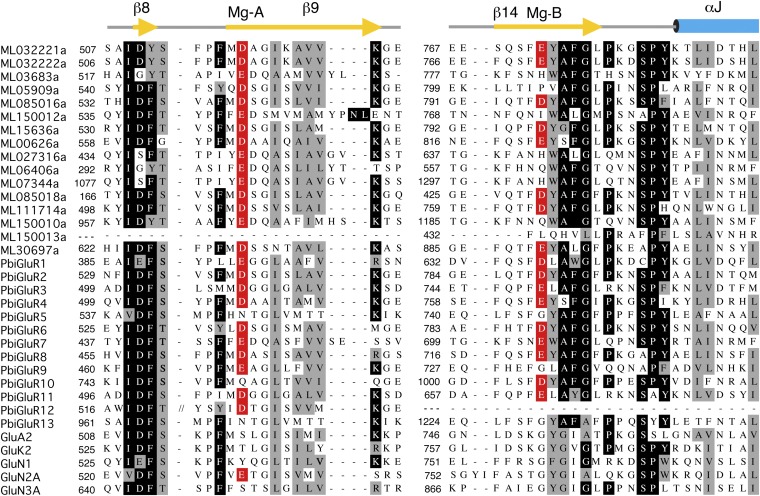
In full-length iGluRs, the LBDs form a dimer of dimers assembly (9–14), and frequently their LBD S1S2 constructs crystallize as dimers in the active conformation (17, 25, 26). The ML032222a LBD crystallized as a classical iGluR dimer assembly with a buried surface area of 1,030 Å2 per subunit; the lateral surface of the dimer interface is formed by contacts between α-helices D and J, with the central surface formed by the linker connecting β-strands 8 and 9 (Fig. 2A and Fig. S5). A variety of ambient ion species including Na+, Cl−, Ca2+, and Zn2+ bind in the LBD dimer interface of a subset of vertebrate iGluRs, where they stabilize the dimer assembly and act as allosteric modulators of receptor activity (28–32). Of interest, given that ctenophores have adapted to life in a marine environment, for which seawater contains 55 mM Mg2+ (33), we found that an Mg2+ ion is bound at the base of the ML032222a LBD dimer assembly, where it is coordinated by the side chains of Asp-516 and Glu772 (Fig. 2B and Fig. S5). The location of the Mg2+ binding site is distinct from that for Na+, Zn2+, and Ca2+ in kainate and delta subtype iGluRs (31, 32) and is generated by conserved amino acid substitutions unique to ctenophores (Fig. S6). Sequence alignments reveal that eight M. leidyi and eight P. bachei iGluR subunits contain acidic residues at both positions that coordinate Mg2+ in ML032222a, whereas in vertebrate iGluRs, the ion binding site is absent because Glu772 is replaced by a conserved glycine residue (Fig. S6). It is likely that similar to the role played by Na+, Cl−, Ca2+, and Zn2+ ions in vertebrate glutamate receptors (28–32), Mg2+ stabilizes the LBD dimer assembly in ctenophores.
Fig. 2.
The ML032222a LBD dimer assembly encodes a binding site for Mg2+. (A) Ribbon diagram for the ML032222a dimer crystal structure, with the upper lobes of the LBD colored gold and pale yellow, and the lower lobes colored green and pale cyan, respectively; at the base of the upper lobes side chains drawn in stick representation show the location of the Mg2+ binding site. (B) A 1.21-Å resolution mFo-DFc electron density glycine omit map contoured at 2 σ showing the twofold symmetric coordination of the bound Mg2+ ion by two water molecules and the side chains of Asp516 and Glu772.
Fig. S5.
The ML032222a LBD dimer assembly contains an Mg2+ binding site. (A) Stereoview of the LBD dimer assembly with domains 1 and 2 colored gold and green for subunit 1, and pale yellow and pale blue for subunit 2, respectively; the binding site for Mg2+ at the base of the dimer assembly is shown using stick representation. (B) Stereoview of a 2mFo-DFc electron density map contoured at 2.2 σ, showing coordination of the Mg2+ ion by the side chains of Asp516, Glu772, and two water molecules.
Fig. S6.
Amino acid sequence alignments for the LBDs of 14 M. leidyi iGluR subunits, 13 P. bachei iGluR subunits, and 5 representative vertebrate iGluR subunits, showing conservation of acidic residues that form an Mg2+ binding site in the LBD dimer assembly of a subset of ctenophore iGluRs. Site A is located at the start of β-strand 9; in site B, located in β-strand 14 the vertebrate iGluRs all contain a Gly residue.
Endogenous glycine is trapped in the ligand binding site.
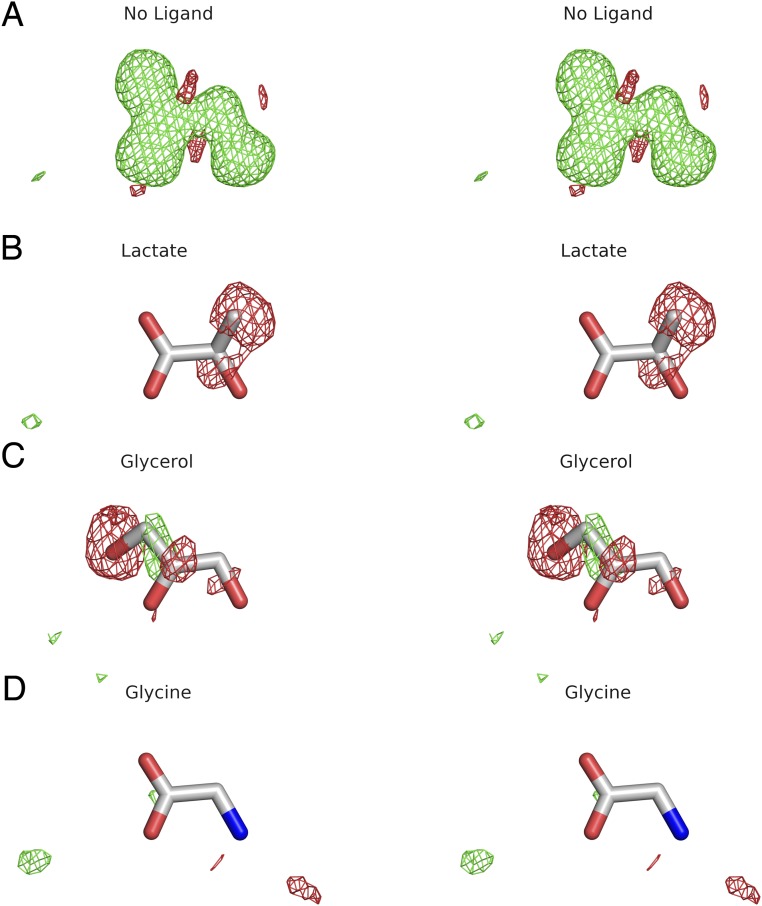
As expected for iGluR LBDs crystallized in the presence of glutamate, the ctenophore LBDs both adopt closed cleft conformations; using the GluA2 apo crystal structure as a reference, the extent of domain closure calculated using domain 1 and 2 core structures for ML032222a (26.6°) and P. bachei iGluR3 (25.4°) was greater than for the glutamate complexes of GluA2 (19.6°), GluK2 (19.5°), and GluN2A (19.8°) but similar to that for the glycine complexes of GluN1 (23.0°) and GluN3A (25.4°). To our surprise, although both the M. leidyi ML032222a and P. bachei iGluR3 LBDs were purified in the presence of 2 mM glutamate, inspection of electron density maps revealed a much smaller ligand with planar geometry, which we subsequently identified as glycine (Fig. 3). During the initial stages of model building and refinement, before the ligand was recognized as glycine, we considered several small molecule candidates including lactate, a common contaminant of PEG solutions used for crystallization (34), glycerol, and water molecules, but after refinement eliminated these by inspection of mFo-DFc maps (Fig. S7).
Fig. 3.
Unique structural elements in ctenophore iGluR glycine binding subunits. (A) Crystal structure of the ML032222a binding pocket, with a 1.21-Å resolution mFo-DFc electron density omit map for endogenous glycine contoured at 5 σ; secondary structure elements for the S1 and S2 segments are colored gold and green, respectively; side chains involved in ligand binding and interdomain contacts are drawn in stick representation, with ion pair and hydrogen bond contacts drawn as dashed lines. (B) Crystal structure of the PBiGluR3 binding pocket, colored as above, with a 1.53-Å resolution mFo-DFc electron density omit map for endogenous glycine contoured at 5 σ. (C) Sequence alignment for the nine ctenophore iGluRs selected for study and five representative vertebrate iGluRs highlighting interdomain salt bridge residues unique to ctenophore glycine binding subunits.
Fig. S7.
Stereoviews of mFo-DFc omit maps for the ligand binding site of ML032222a contoured at ±3 σ following refinement with (A) no ligand; (B) lactate; (C) glycerol; and (D) glycine.
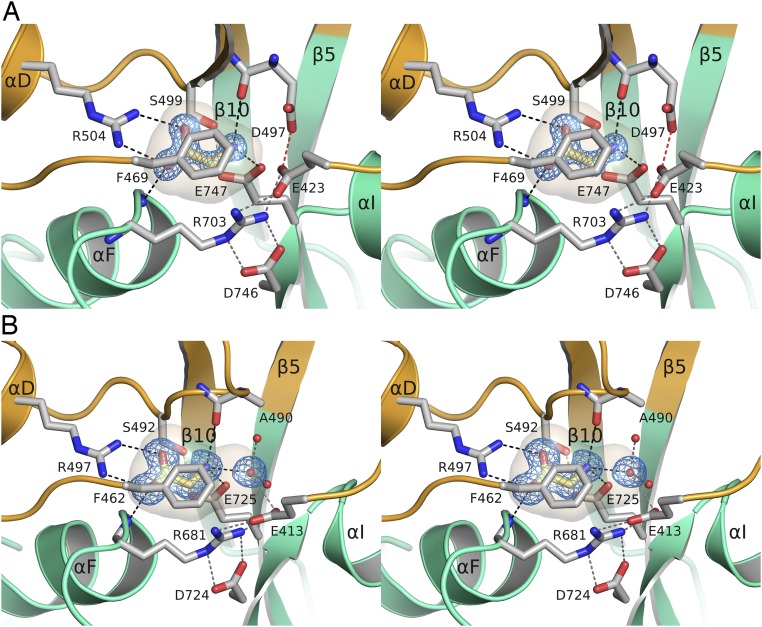
The glycine ligand is trapped in a cavity of volume 58 ± 1.0 and 69 ± 1.8 Å3 for ML032222a and PbiGluR3, respectively (Fig. S8), too small to accommodate glutamate and similar to the volume of the glycine binding site cavities for the NMDA receptor GluN1 (60 Å3), GluN3A (62 Å3), and GluN3B (63 Å3) subunits (35, 36). Binding of the glycine ligand α-carboxyl group is mediated by ion pair contacts with a conserved domain 1 Arg residue in α-helix D identified in amino acid sequence alignments (Fig. S4) as Arg-504 and Arg-497 for ML032222a and PbiGluR3, respectively (Fig. 3), and also by a hydrogen bond contact with a domain 2 main chain amide group in helix F (Fig. 3); the ligand α-amino group is bound by an ion pair contact with Glu-747 or Glu-725 in β-strand 8 preceding α-helix I for ML032222a and PbiGluR3, respectively, which in all NMDA receptor glycine binding subunits is replaced by an Asp residue (Fig. 3 and Fig. S4).
Fig. S8.
Stereoviews of ctenophore iGluR ligand binding sites showing the ligand binding cavity, the endogenous bound glycine ligand, and the interdomain salt bridge. (A) Ribbon diagram for ML032222a with domains 1 and 2 of the LBD colored gold and green, respectively; stick representation is used to show the bound glycine ligand, residues forming the binding site, and the salt bridge linking domains 1 and 2, with a 2mFo-DFc electron density map at 1.21-Å resolution contoured at 2 σ for the glycine ligand; the ligand binding cavity is shown as a transparent surface capped by Phe-469. (B) Ribbon diagram for PbiGluR3 colored as described above, showing a 2mFo-DFc electron density map at 1.5-Å resolution contoured at 1 σ for the glycine ligand and a water molecule at the entrance to the binding site, which is connected by hydrogen bonds to the side chain carboxyl group of Glu-413, and two water molecules in a funnel leading to the binding site.
An Interdomain Salt Bridge Closes the Entrance to the Binding Site for Glycine.
The top of the ligand binding cavity is capped by the side chains of Phe-469 or Phe-462 for ML032222a and PbiGluR3, respectively (Fig. S8), which together with an interdomain salt bridge unique to the ctenophore structures, forms a steric barrier preventing dissociation of glycine. The salt bridge in ML032222a is formed by contacts between Arg-703 located at the N terminus of α-helix F in domain 2 and Glu-423 in the loop following β-strand 1 in domain 1 (Fig. 3 and Fig. S8) and likely contributes to an unusually stable closed cleft conformation that traps endogenous glycine; in PbiGluR3, the corresponding residues are Arg-681 and Glu-413. The arginine side chain adopts an extended conformation, lying across the surface of domain 2 of the LBD, where it is held in place by an additional salt bridge formed with an acidic amino acid in the loop preceding α-helix I: Asp-746, or Asp-724 in ML032222a and PbiGluR3 respectively; this further stabilizes the extended conformation of Arg-703 and Arg-681.
In ML032222a, there is unambiguous electron density for a 2.5-Å contact between the side chains of Glu-423 and Asp-497. On the basis of calculations using PROPKA (37), this is likely mediated by a hydrogen bond between the protonated Asp-497 side chain and the negatively charged Glu-423 carboxyl group; this causes the side chain of Glu-423 to rotate 55° around χ2 toward Asp-497 compared with PbiGluR3, which has an Ala residue at the equivalent position (Fig. 3 and Fig. S8). There are no trapped water molecules in the ligand binding cavity for ML032222a, but for PbiGluR3, due to the replacement of Asp-497 by Ala-490, the entrance to the cavity is plugged by a water molecule connected via a narrow funnel to additional solvent molecules flanking the binding site (Fig. S8). Amino acid sequence alignments reveal that of the 29 ctenophore iGluR genes for which sequences are available, 40% (12/29) have both a conserved domain 1 Glu residue and a domain 2 Arg residue, located at the amino terminus of helix F, which forms the salt bridge seen in the ML032222a and PbiGluR3 LBD crystal structures (Fig. S4). Based on this signature, we propose that these subunits all bind glycine, whereas the majority of the remaining subunits that lack this motif likely bind glutamate; of note, this motif is not present in vertebrate AMPA, kainate, and NMDA receptors (Fig. S4), nor in any of the other iGluRs used for phylogenetic analysis (Fig. 1A and Fig. S1).
Ctenophore iGluRs Bind Glycine With Nanomolar Affinity.
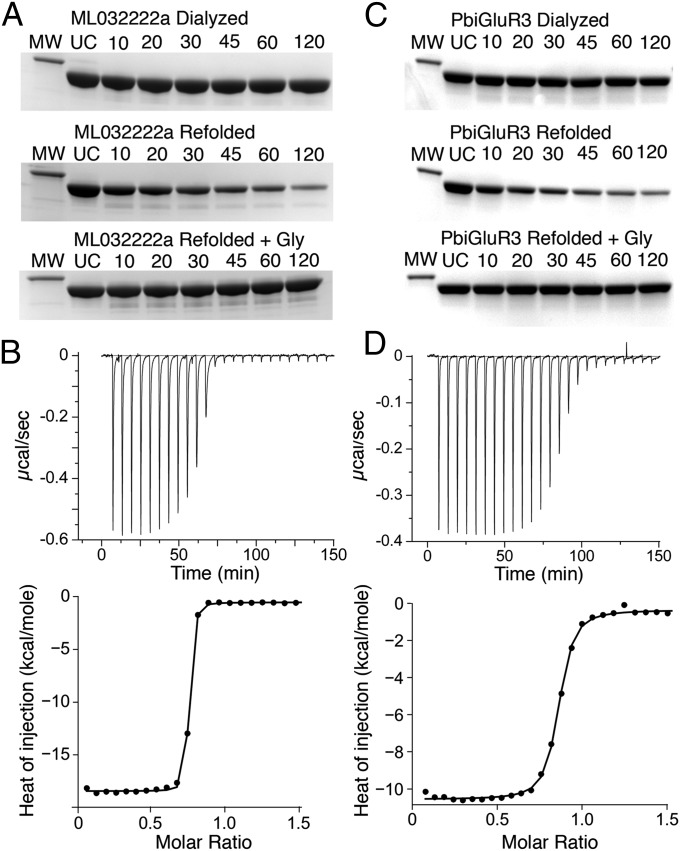
Proteolysis protection assays performed before we identified the presence of endogenous bound glycine revealed that, after exhaustive dialysis against ligand-free buffer, both ML032222a S1S2 and PbiGluR3 S1S2 were highly resistant to proteolysis by trypsin (Fig. 4). After identifying the presence of endogenous glycine in the ctenophore LBD crystal structures, we attempted to prepare apo proteins by unfolding both ML032222a S1S2 and PbiGluR3 S1S2 in a buffer containing 4 M guanidinium and then dialyzing the proteins in the unfolded state using solutions prepared with HPLC grade water to remove glycine. After refolding by rapid dilution, both proteins were now sensitive to digestion by trypsin, whereas subsequent addition of glycine restored resistance to proteolysis (Fig. 4A). Using refolded protein, we then performed isothermal titration calorimetry (ITC) to measure the thermodynamics of ligand binding; although ITC experiments consume large quantities of protein, they have the advantage that the measured Kd should be unaltered by the presence of ambient glycine, which experiments on NMDA receptors previously revealed to be a common contaminant present at nanomolar concentrations in experimental solutions (16, 38). For both ML032222a, Kd 2.7 nM, and PbiGluR3, Kd 31 nM, the binding of glycine was exothermic (Table 1).
Fig. 4.
Ctenophore iGluR subunits bind glycine with nM affinity. (A) Proteolysis protection assays for purified ML032222a S1S2; lanes show a 31-kDa marker (MW), uncut protein (UC), and samples at the indicated times in min after addition of trypsin, with exhaustively dialyzed protein (Top), refolded protein (Middle), and refolded protein with 1 mM glycine (Bottom). (B) Titration of refolded ML032222a by glycine analyzed by ITC, with raw (Upper) and integrated (Lower) data fit with a binding isotherm of Kd of 2.3 nM. (C) Proteolysis protection assays for purified PbiGluR3 S1S2 using the same loading protocols as for ML032222a. (D) Titration of refolded PbiGluR by glycine analyzed by ITC, with raw (Upper) and integrated (Lower) data fit with a binding isotherm of Kd of 31 nM.
Table 1.
Isothermal calorimetry results
| Sample | Kd (nM) | ∆G (kcal/mol) | ∆H (kcal/mol) | T∆S (kcal/mol) |
| ML032222a | 2.7 (1.03, 4.95) | −11.50 (12.05, −11.14) | −17.34 (−17.72, −16.95) | −5.84 |
| PbiGluR3 #1 | 31 (21, 44) | −10.07 (−10.30, −9.87) | −10.2 (−10.43, −9.96) | −0.1 |
| PbiGluR3 #2 | 57 (43, 74) | −9.72 (−9.88, −9.56) | −11.0 (11.23, −10.77) | −1.3 |
Values in parentheses are 95% CIs. For PbiGluR3, two titrations were performed.
Structures of the Alanine and d-Serine and l-Serine Complexes.
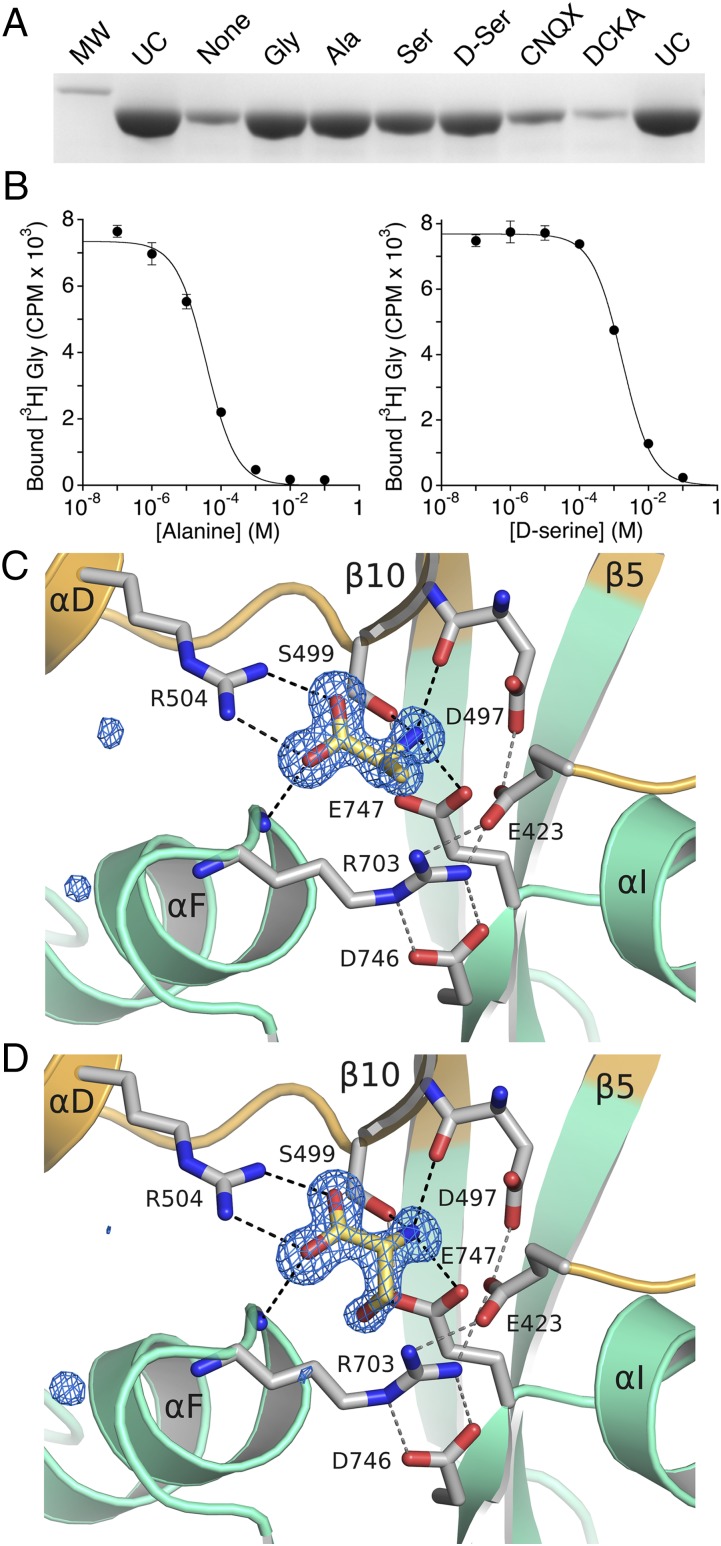
To determine whether the newly identified ctenophore iGluR subunits that bind glycine can interact with additional vertebrate NMDA receptor GluN1 subunit ligands, we performed proteolysis protection assays using refolded ML032222a S1S2 (Fig. 5A). These experiments revealed that at a concentration of 1 mM, alanine and both stereoisomers of serine protected against digestion by trypsin, whereas the competitive antagonists 6-cyano-7-nitroquinoxaline-2,3-dione (CNQX) and 5,7-dichlorokynurenic acid (DCKA) were inactive; densitometric analysis of proteolysis protection gels revealed a rank order for protection of glycine > alanine > d-serine > l-serine. To better determine the relative affinity of these ligands, we next measured equilibrium dose inhibition curves for displacement of [3H]-glycine using scintillation proximity assays instead of ITC to conserve protein, which yielded Ki values of 37 ± 0.1 µM and 1.7 ± 0.1 mM for alanine and d-serine, respectively (Fig. 5B); the Ki for l-serine was not determined, but is likely to be much larger. These experiments establish that ML032222a has much greater selectivity for glycine vs. d-serine and alanine than GluN1 and GluN3A (35, 39).
Fig. 5.
Ligand binding profile for ML032222a. (A) Proteolysis protection assays for refolded ML032222a S1S2 using a series of ligands that bind to vertebrate NMDA receptor glycine binding subunits; lanes show a 31-kDa marker (MW), uncut protein (UC), and samples with 1 mM concentrations of the indicated ligands. (B) Equilibrium dose inhibition curves for displacement of [3H]-glycine by l-alanine, Ki 37 µM, and d-Serine, Ki 1.7 mM. (C) Crystal structure of the ML032222a alanine complex, with a 1.4-Å resolution mFo-DFc electron density omit map contoured at 5 σ; secondary structure elements for the S1 and S2 segments are colored gold and green, respectively; the ligand and side chains involved in ligand binding and interdomain contacts are drawn in stick representation, with ion pair and hydrogen bond contacts drawn as dashed lines. (D) Crystal structure of the ML032222a d-serine complex, colored as above, with a 1.38-Å resolution mFo-DFc electron density omit map contoured at 5 σ.
Structures of the ML032222a S1S2 complexes with alanine (Fig. 5C), d-serine (Fig. 5D), and l-serine (Fig. S9) were determined using protein first purified in the presence of 100 mM l-serine, in an attempt to displace endogenous glycine without unfolding the protein, followed by extensive dialysis against 100 mM concentrations of the desired ligand and then crystallization also in 100 mM alanine, 100 mM d-serine, or 100 mM l-serine; the resulting complexes were solved to resolutions of 1.40, 1.38, and 1.46 Å, respectively (Table S2). Although mFo-DFc omit maps revealed electron density of the appropriate shape for each of these ligands, a careful inspection of electron density maps and of ligand atom B-factors suggested that glycine remained bound to some protomers in the crystal lattice. Occupancy refinement for glycine together with alanine, d-serine, or l-serine gave a rank order of Ala > d-Ser > l-Ser (Table S2), consistent with relative affinities estimated from proteolysis protection assays and [3H]-glycine displacement experiments. Similar to vertebrate NMDA receptor subunits, the structures of the alanine, d-serine, and l-serine complexes were nearly identical to that of the glycine complex, for which least squares superpositions using 238 CA coordinates gave RMSDs of 0.20, 0.21, and 0.08 Å, respectively. Small changes in the side chain conformations of Phe-469 and Arg-703 increased the volume of the ligand binding cavity from 57 ± 0.1 Å3 for the glycine complex to 79 ± 0.1 and 70 ± 0.2 Å3 for alanine and d-serine, respectively; for l-serine, the side chain of Arg-703 was refined in two conformations (Fig. S9), resulting in cavity volumes of 73 ± 2 and 62 ± 0.1 Å3 corresponding to the serine and glycine bound states. These changes are necessary to relieve close contacts between the serine CB and OG atoms with Phe-469 and Arg-703 that are absent in the glycine complex and due to their different stereochemistry require larger movements for l-serine than d-serine.
Fig. S9.
Stereoview of the ML032222a l-serine complex with domains 1 and 2 of the LBD colored gold and green, respectively; stick representation is used to show the bound l-serine ligand, residues forming the binding site, and the salt bridge linking domains 1 and 2, with the ligand binding cavity shown as a transparent surface; the 2mFo-DFc electron density map calculated following refinement with mixed occupancy by l-serine and glycine is contoured at 1.25 σ and shows weak density for the CB and OG atoms; the side chain of Arg703 was refined in two conformations, with that for the glycine complex shown using transparent shading. Below this are shown mFo-DFc electron density maps contoured at ±3 σ following refinement with no ligand (Top), l-serine (Middle), and glycine (Bottom), all at full occupancy.
ML032222a Forms Functional Homomeric Glycine Activated Ion Channels.
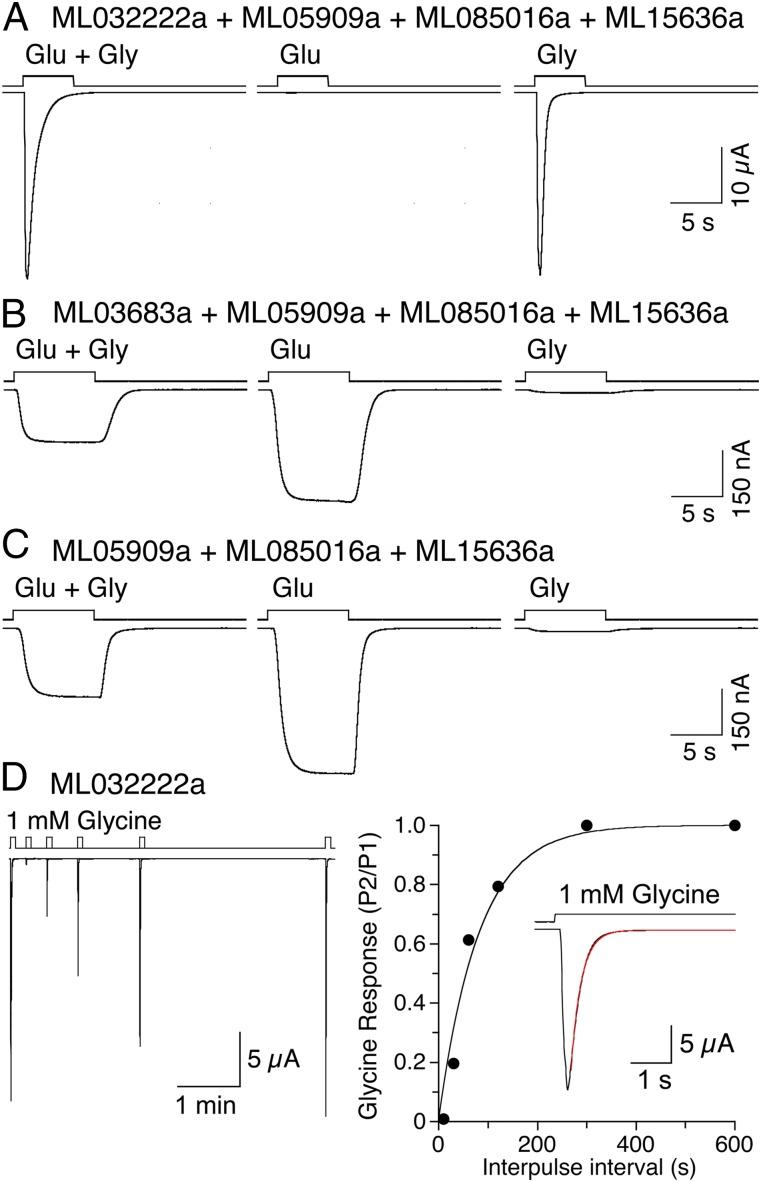
Vertebrate NMDA receptors are obligate heteromeric ion channels that require both glutamate (GluN2) and glycine (GluN1 or GluN3) binding subunits for activation of ion channel gating. To test whether ctenophore iGluRs form similar functional heteromeric ion channels, we screened mixtures of full-length ML032222a coexpressed with candidate M. leidyi glutamate binding subunits (Fig. S4) using two electrode voltage-clamp recording and cRNA expression in Xenopus oocytes. For M. leidyi, a mixture of 1 ng ML032222a with 1 ng each of three candidate glutamate binding subunits, ML05909a, ML085016a, and ML15636a, yielded large amplitude and rapidly desensitizing responses to coapplication of 10 mM glutamate and 1 mM glycine (35.5 ± 9.4 µA, n = 5); surprisingly, glycine but not glutamate evoked similar amplitude, rapidly desensitizing responses (Fig. 6A). We next tested a second candidate glycine binding subunit, ML03683a, coexpressed with the same three candidate glutamate binding subunits; responses were observed only after treatment with Con A, a lectin that attenuates desensitization for iGluR subtypes from multiple species (40–43). Different from ML032222a, ML03683a coexpressed with ML05909a, ML085016a, and ML15636a gave responses to 10 mM glutamate applied alone, and these were larger than those for coapplication of 10 mM glutamate and 1 mM glycine [465 ± 99 and 221 ± 48 nA (n = 6), respectively], whereas responses to 1 mM glycine were barely detectable (Fig. 6B). An identical profile was obtained for coexpression of just the three candidate glutamate binding subunits: ML05909a, ML085016a, and ML15636a; responses to 10 mM glutamate applied alone were larger than those for coapplication of 10 mM glutamate and 1 mM glycine [232 ± 10 and 489 ± 20 nA (n = 9), respectively], with barely detectable responses to 1 mM glycine (Fig. 6C). Additional experiments with expression of single subunits revealed that ML032222a formed homomeric glycine activated ion channels, suggesting that even when coexpressed with other M. leidyi iGluR subunits, responses to glycine were mediated by homomeric ML032222a assemblies. We also recorded from PbiGluR3 and PbiGluR4 expressed in combination and alone, but neither of these gave responses to glycine.
Fig. 6.
Activation of ctenophore iGluRs by glutamate and glycine. (A) Responses to 10 mM glutamate and 1 mM glycine for a mix of ML032222a and three candidate glutamate binding subunits recorded using two electrode voltage clamp for Xenopus oocytes injected with the indicated cRNAs. (B) Responses to 10 mM glutamate and 1 mM glycine for a mix of ML03683a and the same candidate glutamate binding subunits. (C) Responses to 10 mM glutamate and 1 mM glycine for a mix of only the three candidate glutamate binding subunits. (D) Response of ML032222a alone to 1 mM glycine measured using a twin pulse protocol (Left), with the rate of recovery from desensitization fit with a single exponential function of time constant 81 s (Right); Inset shows the rate on onset of desensitization fit with a single exponential function of time constant 380 ms.
ML032222a responses to glycine were characterized by rapid and complete desensitization; due to the relatively slow solution exchange possible with two-electrode voltage clamp recording from Xenopus oocytes, these were best resolved by application of millimolar concentrations of glycine; in exceptional recordings, similar, but smaller, amplitude rapidly desensitizing responses were evoked by even low micromolar concentrations of glycine. Using a twin pulse protocol (Fig. 6D), we measured the rate constant for onset (kdes) and recovery (krec) from desensitization: kdes = 3.5 ± 0.17 and krec = 1.1 ± 0.06 × 10⁻² s−1 (n = 18). The extremely slow kinetics of recovery from desensitization are consistent with a high affinity glycine bound desensitized state; this, combined with rapid onset desensitization, made ML032222a technically challenging to study. If we assume a rate constant for binding of glycine kon = 1.1 × 10⁷ M−1⋅s−1, the experimentally determined value for vertebrate NMDA receptors (44), the equilibrium dissociation constant for the desensitized state calculated from the ratio of krec/kon is 1 nM, consistent with the high affinity measured in ITC experiments. Preincubation with 100 nM glycine produced full desensitization of responses to subsequent application of test pulses of 1 mM glycine, also consistent with a high affinity of the desensitized state.
Glycine is a partial agonist that inhibits activation of ML05909a by glutamate.
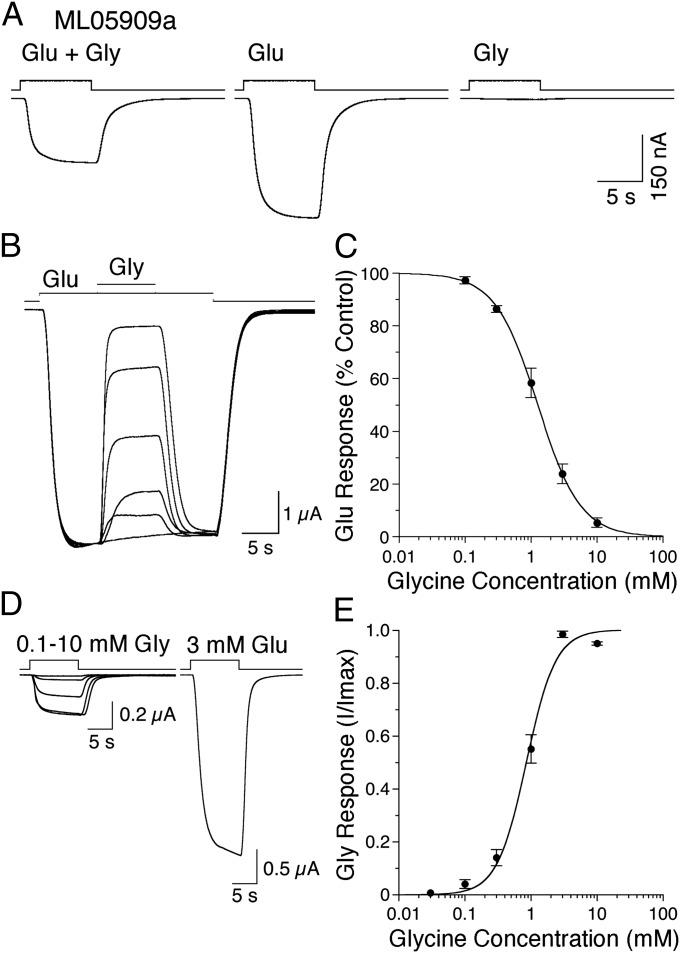
When expressed without other M. leidyi iGluR subunits, the response profile of ML05909a was identical to that observed for coexpression with ML03683a, ML085016a, and ML15636a (Fig. 6B) or ML085016a and ML15636a (Fig. 6C): the amplitude of responses to coapplication of 10 mM glutamate and 1 mM glycine was only 0.59 ± 0.04-fold (n = 4) of that to 10 mM glutamate applied alone, whereas the response to 1 mM glycine was less than 1% of that to glutamate (Fig. 7A). This analysis suggests that even when coexpressed with other M. leidyi iGluR subunits, responses to glutamate were mediated by homomeric ML05909a assemblies, and that glycine might inhibit responses to glutamate. Indeed, glycine produced a concentration dependent inhibition of responses to glutamate, such that the amplitude of responses to coapplication of 10 mM glutamate and 10 mM glycine was only 5 ± 0.8% (n = 4) of that to glutamate applied alone (Fig. 7B). The concentration inhibition response curve was well fit using the Hill equation (Fig. 7C), with an IC50 of 1.3 ± 0.1 mM and a Hill coefficient of 1.4 ± 0.04 (n = 4). Additional experiments revealed that glycine acts as a very weak partial agonist (Fig. 7D); the activation concentration response curve for glycine was well fit with the Hill equation (Fig. 7E), with an EC50 of 0.8 ± 0.04 mM and a Hill coefficient of 2.0 ± 0.06 (n = 7). By contrast, glutamate was a less potent agonist, with EC50 of 20 ± 0.6 mM and a Hill coefficient of 1.8 ± 0.04 (n = 5), but the maximal response to glutamate was larger than that for glycine (Fig. 7D). By comparing the amplitude of responses to 3 mM glycine and 10 mM glutamate in the same cell and then calculating maximum response amplitudes from the glycine and glutamate activation concentration response curves, we determined that at saturating concentrations glycine produced only 2.1 ± 0.1% of the response to glutamate.
Fig. 7.
Glycine is a weak partial agonist for ML05909a. (A) Responses for ML05909a to 10 mM glutamate and 1 mM glycine, applied in combination and separately. (B) Concentration-dependent inhibition of responses to 10 mM glutamate by 0.1–10 mM glycine. (C) Concentration inhibition plot for glycine fit with the Hill equation; data points show mean ± SD. (D) Maximal activation of ML05909a by glycine produces smaller responses than those to glutamate. (E) Concentration activation plot for glycine fit with the Hill equation; data points show mean ± SD.
Ctenophore iGluR responses show biphasic rectification.
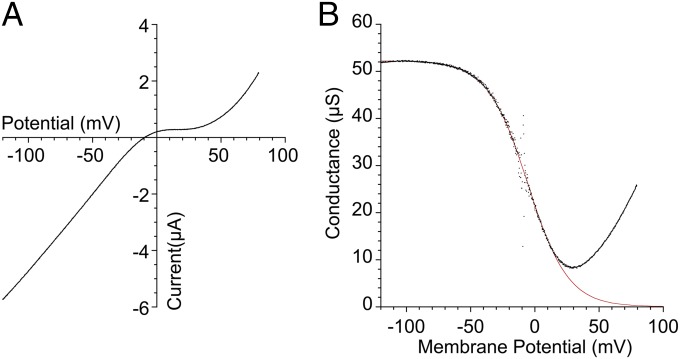
A subset of vertebrate AMPA and kainate receptors undergo RNA editing at a site within the ion channel pore loop that controls block by cytoplasmic polyamines (45, 46); the binding of polyamines in addition requires a negatively charged residue at the entrance to the ion channel pore (47). Amino acid sequence alignments for ctenophore iGluRs reveal a glycine residue at the mRNA editing Q/R site in ML032222a and other iGluRs (Fig. S2), a substitution that in vertebrate receptors reduces but does not abolish biphasic rectification produced by cytoplasmic polyamines (48). Ctenophore iGluRs also have a glutamate at the pore entrance necessary for pore block by polyamines (47). To facilitate analysis of the voltage dependence of ML032222a responses to glycine, we generated the K505C/S789C double mutant, which was designed using the ML032222a dimer crystal structure as a guide, based on prior work on AMPA and kainate receptors, which established that LBD cross-links reduce desensitization (49). We did this because Con A did not block desensitization for ML032222a. Using the K505C/S789C double mutant, we were able to examine the voltage dependence of ML032222a responses to glycine using ramp changes in membrane potential, which revealed a characteristic biphasic rectification, with relief from block at strongly depolarized membrane potentials due to polyamine permeation (Fig. 8A). Analysis of conductance voltage plots revealed some differences from responses for WT vertebrate AMPA and kainate receptors, likely due the exchange of glycine for glutamine at the Q/R site; the potential for half block, Vb of −6.1 ± 0.8 mV (n = 12), was shifted by +40 mV, and the extent of maximum block (87 ± 1.6%) was reduced compared with nearly complete inhibition for AMPA and kainate receptors (Fig. 8B); however, the voltage dependence of block, kb of 15.0 ± 0.6 mV, was unchanged. Overall, these results resemble those obtained for the GluK2 Q590A mutant, Vb of −7.2 mV, kb of 15.5 mV, and 84% maximum block (48), and indicate that the ion permeation properties of ctenophore iGluRs resemble those of vertebrate receptors most likely due to their similar pore structures.
Fig. 8.
Glycine-activated currents for ML032222a show biphasic rectification. (A) Current-voltage plot for the response to 100 µM glycine recorded from the ML032222a K505C/S789C double mutant, with an extracellular solution containing 100 µM Ca2+ and 1 mM Mg2+ to suppress activation of endogenous calcium activated chloride currents. (B) Conductance voltage plot fit with a Boltzman function, with Vb = −5.4 mV and kb = 15.7 mV (red line).
Discussion
Here we report the discovery of a large family of glycine activated ion channel subunits that are widely expressed in the genome of two ctenophore species: the comb jelly M. leidyi and the sea gooseberry P. bachei. Using crystallographic, biochemical, and functional approaches, we establish the molecular mechanism for selective binding of glycine and demonstrate that ML032222a can form functional homomeric ion channels. We did not succeed in crystallizing the LBDs of any of the ctenophore iGluR subunits that bind glutamate, but in functional studies, we established that ML05909a forms functional homomeric receptors that are activated by glutamate and for which glycine acts as a weak partial agonist. Because the affinity of ML05909a for glycine is greater than that of glutamate and because the efficacy of glycine is so low, glycine acts as a functional glutamate antagonist, analogous to the partial agonist action of HA-966 on the GluN1 subunit of vertebrate NMDA receptors (50, 51).
Comparison of the crystal structures of the ML032222a and PbiGluR3 LBDs with those for other iGluRs, combined with sequence analysis for 100 iGluRs from diverse animal species, reveals an interdomain salt bridge in a substantial subset of ctenophore iGluRs; we propose that this subset forms a large family of glycine binding subunits. This salt bridge is a ctenophore specific motif that is not found in other iGluR subunits selected for phylogenetic analysis (Fig. 1A and Fig. S1). The salt bridge likely contributes to the very high affinity of ML032222a and PbiGluR3 for glycine by stabilizing the glycine-bound closed cleft conformation. In addition, the salt bridge plays a key role in the ligand selectivity because it acts as a barrier that prevents binding of glutamate and aspartate. As a result, the ligand binding pockets of ML032222a and PbiGluR3 are just large enough to accommodate glycine, and binding of glutamate is prevented by steric occlusion. In the GluN1 and GluN3 NMDA receptor subtypes, for which the ligand binding pocket has a similar small volume to that found in ML032222a and PbiGluR3, selectivity for glycine is also achieved by steric occlusion, but in this case by insertion of either Trp or Met residues into the binding pocket. The nanomolar affinity of ML032222a and PbiGluR3 for glycine, and the fact that when expressed as soluble proteins in E. coli their LBDs trap endogenous glycine that cannot be removed by exhaustive dialysis, suggests that the ligand-bound complexes are unusually stable. Indeed, we had to dialyze the proteins in their unfolded state to remove endogenous glycine. However, in experiments on intact ML032222a, the rate constant for recovery from desensitization by glycine, 1.1 × 10⁻² s−1, suggests a much less stable complex, from which dissociation of glycine would be complete in around 6–7 min. This difference almost certainly results from strain imposed on the ligand binding domain in an intact receptor assembly that is absent when the LBD is expressed as a soluble protein, uncoupled from its connection to the ion channel and ATD. Even so, the high affinity for glycine and slow recovery from desensitization are features that will profoundly impact the biological function of ML032222a in vivo.
The subset of ctenophore iGluRs we report here is, to our knowledge, the first identified glycine binding subunits expressed in a primitive organism, and are highly abundant, representing 50% of M. leidyi and 30% of P. bachei iGluR subunits. Even ML05909a, which is activated by glutamate, binds glycine with higher affinity. Could ML032222a, PbiGluR3, and related ctenophore iGluRs be relatives of NMDA receptor subunits that bind glycine? Was binding of glycine a common feature of primitive iGluRs that subsequently evolved to bind glutamate with high affinity? A surprising structural feature in all ctenophore iGluRs, which is revealed by our structural analysis, is a conserved disulfide bond in loop 1 that is found only in NMDA receptor subunits, including those from the fruit fly Drosophila melanogaster and the nematode Caenorhabditis elegans, but not in AMPA or kainate receptors. Did the ctenophore iGluRs acquire this signature after splitting from the last common ancestor of other animal families or was this feature present in a primordial glutamate receptor that subsequently evolved to give rise to different iGluR clades? Vertebrate NMDA receptors are characterized by their voltage-dependent gating conferred by magnesium ions (18, 19), a mechanism that would severely impact ctenophore iGluR activity, because sea water contains 55 mM Mg2+ (33). Instead, current voltage plots for ML032222a show instead biphasic rectification that is characteristic of channel block of AMPA and kainate receptors by cytoplasmic polyamines (45, 46), and on this basis, ctenophore iGluRs resemble non-NMDA receptors. A plausible scenario based on the robust bootstrap values for the phylogenetic positions of the NMDA and ctenophore receptors in the maximum-likelihood tree is that ctenophore iGluRs encode features of an ancestral ligand gated ion channel, of which a disulfide bond in loop 1 and activation by glycine are common characteristics.
The results presented here highlight the difficulty of classifying the ligand binding and functional properties of newly discovered iGluRs identified by genome sequencing projects and suggest that attempts to classify iGluRs from invertebrate species into classes using the scheme developed for vertebrate AMPA, kainate, and NMDA receptors is not reliable and should be avoided. Our results, as well as recent work on AvGluR1 from the bilaterian rotifer Adineta vaga, which is activated by a range of hydrophobic amino acids as well as glutamate (42, 52), as well as studies on Drosophila NMJ iGluRs that bind glutamate but not AMPA or kainate or NMDA (43), in addition to earlier work on GluR0 from the photosynthetic cyanobacterium Synechocystis sp PCC6803 and its homologs, which bind glutamate, glutamine, and serine but not glycine (53–55), illustrate that it is currently challenging to identify ligand selectivity for iGluRs either by sequence analysis or by analysis of phylogenetic trees based on iGluR LBD crystal structures (Fig. 1C). Indeed, the initial annotation of iGluRs revealed by sequence analysis of the M. leidyi (4) and the sea gooseberry P. bachei (5) genomes failed to identify the large subset of glycine binding subunits reported here, and for the nine ctenophore iGluRs selected for study, amino acid sequence alignments yield mean values of 18.9% identity compared with the kainate receptor GluK2 subunit; 17.2% identity compared with the AMPA receptor GluA2 subunit; and 13.2% identity compared with the glycine binding subunits GluN1, GluN3A, and GluN3B. Recently the Placozoan Trichoplax adhaerans has emerged as another model organism for studying the evolution of cellular signaling in primitive metazoan species (56). Analysis of the T. adhaerans genome also reveals numerous iGluR subunits but these have yet to be functionally characterized. Sequence analysis reveals that the interdomain salt bridge we identified in ctenophore iGluRs is not present in T. adhaerans iGluRs, which likely have their own unique structural features and ligand binding properties, and would be interesting candidates for furthering our understanding of iGluR structural biology.
Materials and Methods
Phylogenetic- and Structure-Based Sequence Analysis.
Phylogenetic analysis using amino acid sequence alignments for 100 representative metazoan animal iGluR subunits was performed with MEGA6 and maximum-likelihood (ML) tree reconstruction, using the Le-Gascuel amino acid substitution model and 10 distinct gamma-distributed rates and invariant sites (57). The ML heuristic search was performed with the nearest-neighbor-interchange method, and the initial tree was selected by applying the neighbor joining method to a matrix of pairwise distances estimated using the Jones, Taylor, and Thornton (JTT) method. Sequence segments with less than 15% coverage across the 100 sequences analyzed were excluded from the analysis. The accuracy of the tree was tested with bootstrapping using 100 replicates; 70% of the nodes had bootstrap values above 70, and the node leading to the ctenophore branch has a bootstrap value of 100. Subsequent formatting of the tree was performed with MEGA and FigTree (tree.bio.ed.ac.uk/software/figtree). Structure-based sequence alignments were generated based on a progressive pairwise heuristic algorithm as implemented in MUSTANG (58). Structure-based phylogeny was calculated based on the structural similarity score (QH) using the MultiSeq module of VMD (59). The value of QH indicates an overall structural similarity score between two structures and is calculated using the equation QH = ℵ−1 [qaln + qgap], where ℵ is the normalization that accounts for the contribution from both contacts between the aligned regions, as well as between the residue present in the aligned position and the gap region; qaln represents the fraction of Cα-Cα distances that are similar between the two aligned structures; and qgap introduces a penalty term to account for the presence of insertions with the QH value decreasing with larger perturbations (27).
Protein Expression and Purification.
Synthetic genes with codon optimization for expression in E. coli were designed for LBD S1-S2 constructs of ML032221a (N410-E527 and S683-A819); ML032222a (K409-E526 and T682-S815); ML03683a (N418-K537 and R693-P828); ML05909a (N440-E560 and P715-G850); ML085016a (T434-E552 and T707-D843); ML150012a (N434-P554 and G682-H816); ML15636a (N434-E550 and T706-D842); PbiGluR3 (N399-D519 and D660-N795); and PbiGluR4 (N404-E519 and Q674-C806). All constructs encoded an N-terminal MH8SSGLVPRGS affinity purification tag and thrombin cleavage site, with a GT dipeptide linker connecting the S1 and S2 sequences. For PbiGluR3 the E400Q mutation was constructed by overlap PCR to improve thrombin cleavage of the affinity tag. Proteins were expressed in Origami B(DE3) cells grown in Luria Broth and induced overnight with 30 µM isopropyl β-D-1-thiogalactopyranoside at 18 °C; following immobilized metal affinity chromatography and anion exchange chromatography, with thrombin cleavage used to remove the affinity tag, the proteins were concentrated to 10 mg/mL for crystallization.
Crystallography.
ML032222a crystals were grown at 4 °C in a buffer of composition 100 mM NaCl, 10 mM Hepes, pH 7.5, 0.5 mM EDTA, and 2 mM l-glutamate, with a reservoir containing 21% PEG 8000, 0.1 M Na cacodylate, pH 6.5, and 150 mM MgSO4. Microseeding was performed 1 d after initially setting drops. The ML032222a l-alanine, d-serine, and l-serine complexes were crystalized using protein initially purified in the presence of 100 mM l-serine to displace endogenous glycine, followed by exhaustive dialysis against 100 mM of the appropriate ligand. Crystals were grown at 4 °C in a buffer of composition 100 mM NaCl, 10 mM Hepes, pH 7.5, 0.5 mM EDTA, and 100 mM desired ligand, with a reservoir containing 23–25% PEG 8000, 0.1 M Na cacodylate, pH 6.5, and 150 mM MgSO4. Microseeding was performed 1 d after initially setting drops. Crystals were cryoprotected using serial transfers to mother liquor supplemented with ligands and 10–12% glycerol. PbiGluR3 crystals were grown under cryoprotective conditions at 4 °C by spontaneous nucleation in a buffer of composition 100 mM NaCl, 10 mM Hepes, pH 7.5, 1 mM EDTA, and 2 mM l-glutamate; with a reservoir containing 1.75 M Li2SO4, 0.1 M Na cacodylate, pH 6.5, 9% PEG 400, and 75 mM MgSO4.
X-ray diffraction data were collected at APS beam line ID22, using a MAR 300 mosaic charge coupled device (CCD) detector for ML032222a and a Rayonix MX300HS detector for PbiGluR3 (Table S2) and processed using HKL2000 (60). The ML032222a structure with endogenous glycine was solved by molecular replacement using PHASER (61) and the GluK2 LBD glutamate complex [Protein Data Bank (PDB) ID code 1S50] as a probe, with nonconserved side chains truncated to CG atoms using Chainsaw (62); two molecules were located in the asymmetric unit with rotation and translation Z scores of 6.5 and 3.9 for protomer 1 and 6.3 and 14.1 for protomer 2. Iterative cycles of model building and refinement were carried out using COOT (63) and PHENIX (64) with riding hydrogen atoms and individual anistropic B factors for protein and ligand atoms. The final model was refined to an Rfree value of 16.1% with good geometry at a resolution of 1.21 Å (Table S2). There was no electron density for residues 409–410 and 811–815 in the N terminus and C terminus, respectively. The l-alanine, d-serine, and l-serine complexes were solved by difference Fourier analysis and then rebuilt and refined as described above, but with isotropic B-factors and 6–10 TLS groups per protomer; the final models had Rfree values of 16.5%, 16.7%, and 16.4% for the l-alanine, d-serine, and l-serine complexes, respectively, with good geometry at resolutions of 1.40, 1.38, and 1.46 Å (Table S2). The PbiGluR3 structure with endogenous glycine was solved by molecular replacement using the ML032222a glycine complex as a probe, with nonconserved side chains truncated to CG atoms; one molecule was located in the asymmetric unit with rotation and translation Z scores of 4.0 and 11.5. The structure was refined as described above, with 10 TLS groups and isotropic B-factors, to an Rfree value of 17.7% with good geometry at a resolution of 1.50 Å (Table S2); there was no electron density for residues 399, 468–472, and 790–795, in the N terminus, loop 2, and C terminus, respectively. Analysis of ligand binding pocket volumes was performed using VOIDOO (65) as previously described (26). Domain closure was calculated with respect to the GluA2 apo structure (PDB ID code 1FTO) after least-squares superposition of domain 1 Cα atoms using LSQMAN in the Uppsala Software Factory suite (66) followed by superposition of domain 2 using FIT. The coordinates and structure factors have been deposited to PDB with ID codes 4YKI, 4YKJ, 4YKK, 4YKP, and 4ZDM.
Proteolysis Protection Assays.
Proteins were initially purified in the presence of 100 mM l-alanine to remove endogenous glycine, unfolded in a buffer containing 4 M guanidinium, exhaustively dialyzed in ligand-free buffer, refolded by rapid dilution to a final guanidinium concentration of 50–100 mM, and then dialyzed against 20 mM Tris (pH 7.5), 200 mM NaCl, and 0.5 mM EDTA. Digestions were performed with trypsin at a ratio of 1:20 (wt/wt) at room temperature and then run on polyacrylamide gels as previously described (39). Control reactions were incubated with 1 mM concentrations of selected ligands for 15 min on ice before the addition of trypsin.
ITC.
ITC experiments with a VP-ITC calorimeter (MicroCal) were performed at 20 °C using refolded proteins prepared as described above. The glycine titrant concentration was 8–12 times higher than the cell protein concentration. Data were analyzed with NITPIC and SEDPHAT (67).
3[H] Glycine Binding Assays.
The streptavidin binding peptide (SBP) tag was added at the C terminus of the ML032222a and PbiGluR3 S1S2 constructs by overlap PCR for use in scintillation proximity assays (68). Radio ligand binding assays using refolded protein prepared as described above were performed at 4 °C in a buffer containing 10 mM Hepes, pH 7.2, 150 mM NaCl, 0.2 mM EDTA, 10% (wt/vol) glycerol, and 0.1% (wt/vol) BSA, with 4 mg/mL polyvinyltoluene beads. Total and nonspecific counts were determined in triplicate with a 1-min reading time each. Readings were taken on a Wallac Tri Lux β-counter (Perkin-Elmer) 18–24 h after setting up the reactions.
Expression in Xenopus oocytes and Functional Analysis.
Full-length cDNAs for ML03683, ML05909a, ML085016a, and ML15636a were prepared using TRI reagent (Molecular Research Center), and mRNA was extracted from embryos at regular intervals from fertilization to 24 h, three cydippid stage larvae, and one lobate adult (20). mRNAs were reverse transcribed to generate cDNA using Advantage RT (Clontech). For ML032222a, PbiGluR3 and PbiGluR4 synthetic genes were synthesized. cDNAs were cloned into pGEMHE (69), linearized with PmeI, and used for cRNA expression using T7 polymerase (Ambion mMessage mMachine transcription kit). To measure current-voltage relationships for ML032222a, we prepared the K505C/S789C double mutant using the ML032222a dimer crystal structure as a guide, based on prior work on AMPA and kainate receptors, which established that LBD cross-links reduce desensitization (70). Defolliculated stage 5–6 Xenopus oocytes obtained from Ecocyte Bioscience were injected with between 0.05 and 4 ng of cRNA and incubated at 18 °C for 2–4 d in ND96 (96 mM NaCl, 2 mM KCl, 1.8 mM CaCl2, 1 mM MgCl2, 5 mM Hepes, and 2.5 mM sodium pyruvate, gentamycin at 50 μg/mL, pH 7.6). Two electrode voltage-clamp recordings at a holding potential of −60 mV, with 3 M KCl agarose-tipped electrodes of resistance 0.1–0.8 MΩ, were performed 2–3 d after injection of cRNAs. The bath solution contained 100 mM NaCl, 1 mM KCl, and 5 mM Hepes, pH 7.5, to which CaCl2 and MgCl2 were added as required. Amino acids were dissolved in recording solution and applied by computer operated solenoid valves essentially as reported previously (48).
Acknowledgments
We thank Carla Glasser for technical assistance; Drs. Joy Zhao and Peter Schuck for help with analysis of isothermal titration calorimetry (ITC) experiments; and Dr. Albert Lau for performing the PROPKA calculations. Data were collected at Southeast Regional Collaborative Access Team (SER-CAT) 22-ID beamline at the Advanced Photon Source, Argonne National Laboratory. Use of the Advanced Photon Source was supported by the US Department of Energy, Office of Science, Office of Basic Energy Sciences, under Contract W-31-109-Eng-38. This work was supported the intramural research program of The Eunice Kennedy Shriver National Institute of Child Health and Human Development, National Institutes of Health, Department of Health and Human Services, and NASA Grant 00093371 for the study of the evolution of complex cell types.
Footnotes
The authors declare no conflict of interest.
This article is a PNAS Direct Submission.
Data deposition: The atomic coordinates and structure factors have been deposited in the Protein Data Bank, www.pdb.org (PDB ID codes 4YKI, 4YKJ, 4YKK, 4YKP, and 4ZDM).
This article contains supporting information online at www.pnas.org/lookup/suppl/doi:10.1073/pnas.1513771112/-/DCSupplemental.
References
- 1.Croset V, et al. Ancient protostome origin of chemosensory ionotropic glutamate receptors and the evolution of insect taste and olfaction. PLoS Genet. 2010;6(8):e1001064. doi: 10.1371/journal.pgen.1001064. [DOI] [PMC free article] [PubMed] [Google Scholar]
- 2.Liebeskind BJ, Hillis DM, Zakon HH. Convergence of ion channel genome content in early animal evolution. Proc Natl Acad Sci USA. 2015;112(8):E846–E851. doi: 10.1073/pnas.1501195112. [DOI] [PMC free article] [PubMed] [Google Scholar]
- 3.Srivastava M, et al. The Trichoplax genome and the nature of placozoans. Nature. 2008;454(7207):955–960. doi: 10.1038/nature07191. [DOI] [PubMed] [Google Scholar]
- 4.Ryan JF, et al. NISC Comparative Sequencing Program The genome of the ctenophore Mnemiopsis leidyi and its implications for cell type evolution. Science. 2013;342(6164):1242592. doi: 10.1126/science.1242592. [DOI] [PMC free article] [PubMed] [Google Scholar]
- 5.Moroz LL, et al. The ctenophore genome and the evolutionary origins of neural systems. Nature. 2014;510(7503):109–114. doi: 10.1038/nature13400. [DOI] [PMC free article] [PubMed] [Google Scholar]
- 6.Watkins JC, Evans RH. Excitatory amino acid transmitters. Annu Rev Pharmacol Toxicol. 1981;21:165–204. doi: 10.1146/annurev.pa.21.040181.001121. [DOI] [PubMed] [Google Scholar]
- 7.Hollmann M, Heinemann S. Cloned glutamate receptors. Annu Rev Neurosci. 1994;17:31–108. doi: 10.1146/annurev.ne.17.030194.000335. [DOI] [PubMed] [Google Scholar]
- 8.Mayer ML. Glutamate receptors at atomic resolution. Nature. 2006;440(7083):456–462. doi: 10.1038/nature04709. [DOI] [PubMed] [Google Scholar]
- 9.Sobolevsky AI, Rosconi MP, Gouaux E. X-ray structure, symmetry and mechanism of an AMPA-subtype glutamate receptor. Nature. 2009;462(7274):745–756. doi: 10.1038/nature08624. [DOI] [PMC free article] [PubMed] [Google Scholar]
- 10.Schauder DM, et al. Glutamate receptor desensitization is mediated by changes in quaternary structure of the ligand binding domain. Proc Natl Acad Sci USA. 2013;110(15):5921–5926. doi: 10.1073/pnas.1217549110. [DOI] [PMC free article] [PubMed] [Google Scholar]
- 11.Meyerson JR, et al. Structural mechanism of glutamate receptor activation and desensitization. Nature. 2014;514(7522):328–334. doi: 10.1038/nature13603. [DOI] [PMC free article] [PubMed] [Google Scholar]
- 12.Karakas E, Furukawa H. Crystal structure of a heterotetrameric NMDA receptor ion channel. Science. 2014;344(6187):992–997. doi: 10.1126/science.1251915. [DOI] [PMC free article] [PubMed] [Google Scholar]
- 13.Dürr KL, et al. Structure and dynamics of AMPA receptor GluA2 in resting, pre-open, and desensitized states. Cell. 2014;158(4):778–792. doi: 10.1016/j.cell.2014.07.023. [DOI] [PMC free article] [PubMed] [Google Scholar]
- 14.Lee CH, et al. NMDA receptor structures reveal subunit arrangement and pore architecture. Nature. 2014;511(7508):191–197. doi: 10.1038/nature13548. [DOI] [PMC free article] [PubMed] [Google Scholar]
- 15.Johnson JW, Ascher P. Glycine potentiates the NMDA response in cultured mouse brain neurons. Nature. 1987;325(6104):529–531. doi: 10.1038/325529a0. [DOI] [PubMed] [Google Scholar]
- 16.Kleckner NW, Dingledine R. Requirement for glycine in activation of NMDA-receptors expressed in Xenopus oocytes. Science. 1988;241(4867):835–837. doi: 10.1126/science.2841759. [DOI] [PubMed] [Google Scholar]
- 17.Furukawa H, Singh SK, Mancusso R, Gouaux E. Subunit arrangement and function in NMDA receptors. Nature. 2005;438(7065):185–192. doi: 10.1038/nature04089. [DOI] [PubMed] [Google Scholar]
- 18.Nowak L, Bregestovski P, Ascher P, Herbet A, Prochiantz A. Magnesium gates glutamate-activated channels in mouse central neurones. Nature. 1984;307(5950):462–465. doi: 10.1038/307462a0. [DOI] [PubMed] [Google Scholar]
- 19.Mayer ML, Westbrook GL, Guthrie PB. Voltage-dependent block by Mg2+ of NMDA responses in spinal cord neurones. Nature. 1984;309(5965):261–263. doi: 10.1038/309261a0. [DOI] [PubMed] [Google Scholar]
- 20.Pang K, Martindale MQ. Comb jellies (Ctenophora): A model for basal metazoan evolution and development. In: Crotty DA, Gann A, editors. Emerging Model Organisms. Cold Spring Harbor Laboratory Press; Cold Spring Harbor, MA: 2009. pp. 167–195. [Google Scholar]
- 21.Petersen TN, Brunak S, von Heijne G, Nielsen H. SignalP 4.0: Discriminating signal peptides from transmembrane regions. Nat Methods. 2011;8(10):785–786. doi: 10.1038/nmeth.1701. [DOI] [PubMed] [Google Scholar]
- 22.Jin R, et al. Crystal structure and association behaviour of the GluR2 amino-terminal domain. EMBO J. 2009;28(12):1812–1823. doi: 10.1038/emboj.2009.140. [DOI] [PMC free article] [PubMed] [Google Scholar]
- 23.Kumar J, Schuck P, Jin R, Mayer ML. The N-terminal domain of GluR6-subtype glutamate receptor ion channels. Nat Struct Mol Biol. 2009;16(6):631–638. doi: 10.1038/nsmb.1613. [DOI] [PMC free article] [PubMed] [Google Scholar]
- 24.Stern-Bach Y, et al. Agonist selectivity of glutamate receptors is specified by two domains structurally related to bacterial amino acid-binding proteins. Neuron. 1994;13(6):1345–1357. doi: 10.1016/0896-6273(94)90420-0. [DOI] [PubMed] [Google Scholar]
- 25.Armstrong N, Gouaux E. Mechanisms for activation and antagonism of an AMPA-sensitive glutamate receptor: Crystal structures of the GluR2 ligand binding core. Neuron. 2000;28(1):165–181. doi: 10.1016/s0896-6273(00)00094-5. [DOI] [PubMed] [Google Scholar]
- 26.Mayer ML. Crystal structures of the GluR5 and GluR6 ligand binding cores: Molecular mechanisms underlying kainate receptor selectivity. Neuron. 2005;45(4):539–552. doi: 10.1016/j.neuron.2005.01.031. [DOI] [PubMed] [Google Scholar]
- 27.O’Donoghue P, Luthey-Schulten Z. Evolutionary profiles derived from the QR factorization of multiple structural alignments gives an economy of information. J Mol Biol. 2005;346(3):875–894. doi: 10.1016/j.jmb.2004.11.053. [DOI] [PubMed] [Google Scholar]
- 28.Plested AJ, Mayer ML. Structure and mechanism of kainate receptor modulation by anions. Neuron. 2007;53(6):829–841. doi: 10.1016/j.neuron.2007.02.025. [DOI] [PubMed] [Google Scholar]
- 29.Plested AJ, Vijayan R, Biggin PC, Mayer ML. Molecular basis of kainate receptor modulation by sodium. Neuron. 2008;58(5):720–735. doi: 10.1016/j.neuron.2008.04.001. [DOI] [PMC free article] [PubMed] [Google Scholar]
- 30.Chaudhry C, Plested AJ, Schuck P, Mayer ML. Energetics of glutamate receptor ligand binding domain dimer assembly are modulated by allosteric ions. Proc Natl Acad Sci USA. 2009;106(30):12329–12334. doi: 10.1073/pnas.0904175106. [DOI] [PMC free article] [PubMed] [Google Scholar]
- 31.Hansen KB, et al. Modulation of the dimer interface at ionotropic glutamate-like receptor delta2 by D-serine and extracellular calcium. J Neurosci. 2009;29(4):907–917. doi: 10.1523/JNEUROSCI.4081-08.2009. [DOI] [PMC free article] [PubMed] [Google Scholar]
- 32.Veran J, et al. Zinc potentiates GluK3 glutamate receptor function by stabilizing the ligand binding domain dimer interface. Neuron. 2012;76(3):565–578. doi: 10.1016/j.neuron.2012.08.027. [DOI] [PMC free article] [PubMed] [Google Scholar]
- 33.Millero FJ, Feistel R, Wright DG, McDougall TJ. The composition of Standard Seawater and the definition of the Reference-Composition Salinity Scale. Deep Sea Res Part I Oceanogr Res Pap. 2008;55:50–72. [Google Scholar]
- 34.Zhang M, Tanner JJ. Detection of L-lactate in polyethylene glycol solutions confirms the identity of the active-site ligand in a proline dehydrogenase structure. Acta Crystallogr D Biol Crystallogr. 2004;60(Pt 5):985–986. doi: 10.1107/S0907444904003786. [DOI] [PMC free article] [PubMed] [Google Scholar]
- 35.Furukawa H, Gouaux E. Mechanisms of activation, inhibition and specificity: Crystal structures of the NMDA receptor NR1 ligand-binding core. EMBO J. 2003;22(12):2873–2885. doi: 10.1093/emboj/cdg303. [DOI] [PMC free article] [PubMed] [Google Scholar]
- 36.Yao Y, Harrison CB, Freddolino PL, Schulten K, Mayer ML. Molecular mechanism of ligand recognition by NR3 subtype glutamate receptors. EMBO J. 2008;27(15):2158–2170. doi: 10.1038/emboj.2008.140. [DOI] [PMC free article] [PubMed] [Google Scholar]
- 37.Li H, Robertson AD, Jensen JH. Very fast empirical prediction and rationalization of protein pKa values. Proteins. 2005;61(4):704–721. doi: 10.1002/prot.20660. [DOI] [PubMed] [Google Scholar]
- 38.Benveniste M, Mayer ML. Multiple effects of spermine on N-methyl-D-aspartic acid receptor responses of rat cultured hippocampal neurones. J Physiol. 1993;464:131–163. doi: 10.1113/jphysiol.1993.sp019627. [DOI] [PMC free article] [PubMed] [Google Scholar]
- 39.Yao Y, Mayer ML. Characterization of a soluble ligand binding domain of the NMDA receptor regulatory subunit NR3A. J Neurosci. 2006;26(17):4559–4566. doi: 10.1523/JNEUROSCI.0560-06.2006. [DOI] [PMC free article] [PubMed] [Google Scholar]
- 40.Mathers DA, Usherwood PN. Concanavalin A blocks desensitisation of glutamate receptors on insect muscle fibres. Nature. 1976;259(5542):409–411. doi: 10.1038/259409a0. [DOI] [PubMed] [Google Scholar]
- 41.Partin KM, Patneau DK, Winters CA, Mayer ML, Buonanno A. Selective modulation of desensitization at AMPA versus kainate receptors by cyclothiazide and concanavalin A. Neuron. 1993;11(6):1069–1082. doi: 10.1016/0896-6273(93)90220-l. [DOI] [PubMed] [Google Scholar]
- 42.Lomash S, Chittori S, Brown P, Mayer ML. Anions mediate ligand binding in Adineta vaga glutamate receptor ion channels. Structure. 2013;21(3):414–425. doi: 10.1016/j.str.2013.01.006. [DOI] [PMC free article] [PubMed] [Google Scholar]
- 43.Han TH, Dharkar P, Mayer ML, Serpe M. Functional reconstitution of Drosophila melanogaster NMJ glutamate receptors. Proc Natl Acad Sci USA. 2015;112(19):6182–6187. doi: 10.1073/pnas.1500458112. [DOI] [PMC free article] [PubMed] [Google Scholar]
- 44.Benveniste M, Clements J, Vyklický L, Jr, Mayer ML. A kinetic analysis of the modulation of N-methyl-D-aspartic acid receptors by glycine in mouse cultured hippocampal neurones. J Physiol. 1990;428:333–357. doi: 10.1113/jphysiol.1990.sp018215. [DOI] [PMC free article] [PubMed] [Google Scholar]
- 45.Sommer B, Köhler M, Sprengel R, Seeburg PH. RNA editing in brain controls a determinant of ion flow in glutamate-gated channels. Cell. 1991;67(1):11–19. doi: 10.1016/0092-8674(91)90568-j. [DOI] [PubMed] [Google Scholar]
- 46.Bowie D, Mayer ML. Inward rectification of both AMPA and kainate subtype glutamate receptors generated by polyamine-mediated ion channel block. Neuron. 1995;15(2):453–462. doi: 10.1016/0896-6273(95)90049-7. [DOI] [PubMed] [Google Scholar]
- 47.Panchenko VA, Glasser CR, Mayer ML. Structural similarities between glutamate receptor channels and K(+) channels examined by scanning mutagenesis. J Gen Physiol. 2001;117(4):345–360. doi: 10.1085/jgp.117.4.345. [DOI] [PMC free article] [PubMed] [Google Scholar]
- 48.Panchenko VA, Glasser CR, Partin KM, Mayer ML. Amino acid substitutions in the pore of rat glutamate receptors at sites influencing block by polyamines. J Physiol. 1999;520(Pt 2):337–357. doi: 10.1111/j.1469-7793.1999.t01-1-00337.x. [DOI] [PMC free article] [PubMed] [Google Scholar]
- 49.Weston MC, Schuck P, Ghosal A, Rosenmund C, Mayer ML. Conformational restriction blocks glutamate receptor desensitization. Nat Struct Mol Biol. 2006;13(12):1120–1127. doi: 10.1038/nsmb1178. [DOI] [PubMed] [Google Scholar]
- 50.Henderson G, Johnson JW, Ascher P. Competitive antagonists and partial agonists at the glycine modulatory site of the mouse N-methyl-D-aspartate receptor. J Physiol. 1990;430:189–212. doi: 10.1113/jphysiol.1990.sp018288. [DOI] [PMC free article] [PubMed] [Google Scholar]
- 51.Foster AC, Kemp JA. HA-966 antagonizes N-methyl-D-aspartate receptors through a selective interaction with the glycine modulatory site. J Neurosci. 1989;9(6):2191–2196. doi: 10.1523/JNEUROSCI.09-06-02191.1989. [DOI] [PMC free article] [PubMed] [Google Scholar]
- 52.Janovjak H, Sandoz G, Isacoff EY. A modern ionotropic glutamate receptor with a K(+) selectivity signature sequence. Nat Commun. 2011;2:232. doi: 10.1038/ncomms1231. [DOI] [PubMed] [Google Scholar]
- 53.Chen GQ, Cui C, Mayer ML, Gouaux E. Functional characterization of a potassium-selective prokaryotic glutamate receptor. Nature. 1999;402(6763):817–821. doi: 10.1038/45568. [DOI] [PubMed] [Google Scholar]
- 54.Mayer ML, Olson R, Gouaux E. Mechanisms for ligand binding to GluR0 ion channels: Crystal structures of the glutamate and serine complexes and a closed apo state. J Mol Biol. 2001;311(4):815–836. doi: 10.1006/jmbi.2001.4884. [DOI] [PubMed] [Google Scholar]
- 55.Lee JH, et al. Crystal structure of the GluR0 ligand-binding core from Nostoc punctiforme in complex with L-glutamate: Structural dissection of the ligand interaction and subunit interface. J Mol Biol. 2008;376(2):308–316. doi: 10.1016/j.jmb.2007.10.081. [DOI] [PubMed] [Google Scholar]
- 56.Smith CL, et al. Novel cell types, neurosecretory cells, and body plan of the early-diverging metazoan Trichoplax adhaerens. Curr Biol. 2014;24(14):1565–1572. doi: 10.1016/j.cub.2014.05.046. [DOI] [PMC free article] [PubMed] [Google Scholar]
- 57.Le SQ, Gascuel O. An improved general amino acid replacement matrix. Mol Biol Evol. 2008;25(7):1307–1320. doi: 10.1093/molbev/msn067. [DOI] [PubMed] [Google Scholar]
- 58.Konagurthu AS, Whisstock JC, Stuckey PJ, Lesk AM. MUSTANG: A multiple structural alignment algorithm. Proteins. 2006;64(3):559–574. doi: 10.1002/prot.20921. [DOI] [PubMed] [Google Scholar]
- 59.Humphrey W, Dalke A, Schulten K. VMD: Visual molecular dynamics. J Mol Graph. 1996;14(1):33–38, 27–28. doi: 10.1016/0263-7855(96)00018-5. [DOI] [PubMed] [Google Scholar]
- 60.Otwinowski Z, Minor W. Processing of X-ray diffraction data collected in oscillation mode. Methods Enzymol. 1997;276:307–344. doi: 10.1016/S0076-6879(97)76066-X. [DOI] [PubMed] [Google Scholar]
- 61.McCoy AJ, et al. Phaser crystallographic software. J Appl Cryst. 2007;40(Pt 4):658–674. doi: 10.1107/S0021889807021206. [DOI] [PMC free article] [PubMed] [Google Scholar]
- 62.Winn MD, et al. Overview of the CCP4 suite and current developments. Acta Crystallogr D Biol Crystallogr. 2011;67(Pt 4):235–242. doi: 10.1107/S0907444910045749. [DOI] [PMC free article] [PubMed] [Google Scholar]
- 63.Emsley P, Lohkamp B, Scott WG, Cowtan K. Features and development of Coot. Acta Crystallogr D Biol Crystallogr. 2010;66(Pt 4):486–501. doi: 10.1107/S0907444910007493. [DOI] [PMC free article] [PubMed] [Google Scholar]
- 64.Adams PD, et al. PHENIX: A comprehensive Python-based system for macromolecular structure solution. Acta Crystallogr D Biol Crystallogr. 2010;66(Pt 2):213–221. doi: 10.1107/S0907444909052925. [DOI] [PMC free article] [PubMed] [Google Scholar]
- 65.Kleywegt GJ, Jones TA. Detection, delineation, measurement and display of cavities in macromolecular structures. Acta Crystallogr D Biol Crystallogr. 1994;50(Pt 2):178–185. doi: 10.1107/S0907444993011333. [DOI] [PubMed] [Google Scholar]
- 66.Kleywegt GJ, Zou JY, Kjeldgaard M, Jones TA, Around O. Crystallography of Biological Macromolecules, International Tables for Crystallography. Vol F. Kluwer Academic Publishers; Dordrecht: 2001. pp. 353–356. [Google Scholar]
- 67.Zhao H, Piszczek G, Schuck P. SEDPHAT--a platform for global ITC analysis and global multi-method analysis of molecular interactions. Methods. 2015;76:137–148. doi: 10.1016/j.ymeth.2014.11.012. [DOI] [PMC free article] [PubMed] [Google Scholar]
- 68.Harder D, Fotiadis D. Measuring substrate binding and affinity of purified membrane transport proteins using the scintillation proximity assay. Nat Protoc. 2012;7(9):1569–1578. doi: 10.1038/nprot.2012.090. [DOI] [PubMed] [Google Scholar]
- 69.Liman ER, Tytgat J, Hess P. Subunit stoichiometry of a mammalian K+ channel determined by construction of multimeric cDNAs. Neuron. 1992;9(5):861–871. doi: 10.1016/0896-6273(92)90239-a. [DOI] [PubMed] [Google Scholar]
- 70.Weston MC, Gertler C, Mayer ML, Rosenmund C. Interdomain interactions in AMPA and kainate receptors regulate affinity for glutamate. J Neurosci. 2006;26(29):7650–7658. doi: 10.1523/JNEUROSCI.1519-06.2006. [DOI] [PMC free article] [PubMed] [Google Scholar]


