Abstract
Historically, N6-methyladenosine (m6A) has been identified as the most abundant internal modification of messenger RNA (mRNA) in eukaryotes 1. Its mammalian function remained unknown until recently, when it was reported that thousands of mammalian mRNAs and long noncoding RNAs (lncRNAs) show m6A modification 2,3 and that m6A demethylases are required for mammalian energy homeostasis and fertility 4,5. As yet, the identity of m6A methyltransferases (MTase) and the molecular mechanisms regulated by m6A remains unclear. Here, we show that two proteins, the putative m6A MTase, methyltransferase-like 3 (Mettl3) 6, and a related but uncharacterized protein Mettl14, function synergistically to control m6A formation in mammalian cells. Since m6A modification is involved in cell fate determination in yeast 7,8 and embryo development in plant 9,10, we knocked down Mettl3 and Mettl14, respectively, in mouse embryonic stem cells (mESCs). The resulting cells displayed equivalent phenotypes characterized by lack of m6A RNA methylation and lost self-renewal capability. We also observed that a large number of transcripts, including many encoding developmental regulators, showed m6A methylation inversely correlated with mRNA stability and gene expression. Further analysis suggested that some of these effects were mediated through Human antigen R (HuR) and microRNA pathways. Overall our work provides first experimental evidence of mammalian m6A MTases and reveals a previously unknown gene regulatory mechanism operating in mESCs through m6A methylation. This mechanism is required to keep mESCs at their ground state and may be relevant to thousands of mRNAs and lncRNAs in various cell types.
RNA and DNA MTases share structural motifs required to transfer methyl groups from S-adenosyl-L-methionine (SAM) to nucleic acid. Previously, two mammalian m6A MTases, Mettl3 and Mettl14, are predicted computationally based on conservation of the SAM binding domain and phylogenetic analysis 11,12. Mettl3 purified from HeLa cell nuclear extracts functions as a putative MTase 6, while Mettl14 remains uncharacterized. A recent study reported altered RNA splicing in Mettl3 knockdown HeLa cells 3, but as yet no direct evidence links Mettl3 to m6A formation.
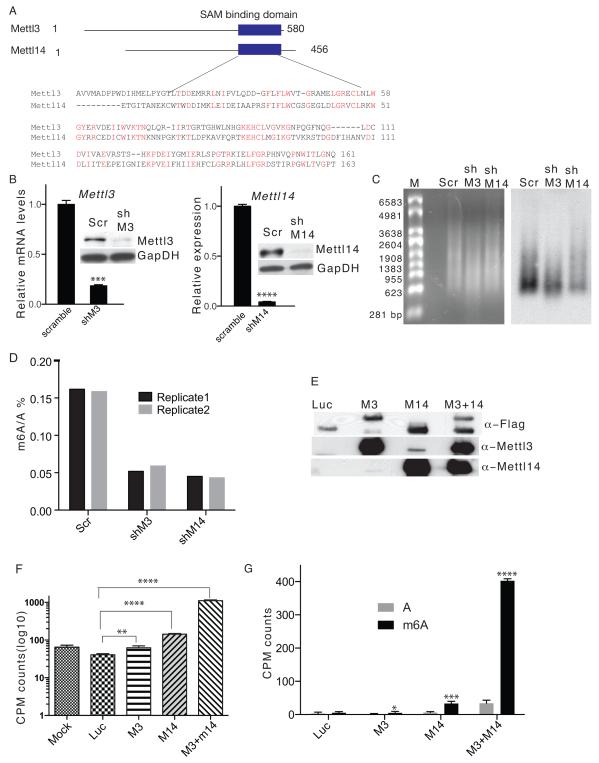
An NCBI Blast Protein sequence analysis revealed greater than 35% sequence homology of the MTase domain between Mettl3 and Mettl14 (Fig.1A), suggesting that both are MTases. To test this possibility we constructed shRNAs targeting Mettl3 or Mettl14 and generated mESC lines harboring efficient knockdown (kd) of each (Fig.1B). We then used two independent methods to determine m6A levels in kd mESCs. First, immunoblotting of RNA samples using a highly specific α-m6A antibody 2,3 indicated decreased m6A levels in both Mettl3 kd and Mettl14 kd versus control cells (Fig1C). We then used Liquid Chromatography-Tandem Mass Spectrometry (LC-MS/MS) to quantify m6A/A ratios and observed a 60-70% decrease in m6A levels in each kd line relative to controls (Fig.1D), suggesting that both proteins mediate m6A formation in vivo. mESCs expressing additional shRNAs targeting Mettl3 or Mettl14 were generated to control for shRNA off-target effects (Supplementary Fig.1A) and similarly decreased m6A levels were detected in all kd clones (Supplementary Fig.1B). We then undertook a direct methylation assay by incubating an RNA probe exhibiting four repeats of the canonical m6A methylation motif (GGACU) with equal amounts of luciferase, Mettl3 and/or Mettl14 proteins (Fig.1E and Supplementary Fig.1C) purified from HEK293 cells in the presence of [3H] SAM and assessed [3H] methyl transfer. The RNA probe incubated with control luciferase protein showed no increase in [3H] levels. However, 1.5-, 3.5-, and > 27-fold increases in [3H] levels were detected in probes incubated with Mettl3, Mettl14, and Mettl3 plus Mettl14 (Fig. 1F), respectively. Thin layer chromatography analysis (TLC) confirmed that methylated nucleotides were m6A (Fig. 1G and Supplementary Fig.1D). To exclude the possibility that the enzymatic activities was due to promiscuously co-purified mammalian proteins, we performed methylation assays using proteins purified from baculovirus-infected Sf9 insect cells. We found Mettl3 or Mettl14 difficult to be purified alone but easily co-purified when co-expressed. As shown in Supplementary Fig.1E, Mettl3 was specifically pulled down by Mettl14 but not luciferase, suggesting a strong interaction between Mettl3 and Mettl14. Importantly, Mettl3+ Mettl14 exhibited high m6A MTase activity (Supplementary Fig.1F and Supplementary Fig.1G), demonstrating that MTase activities detected from HEK293 purified proteins are indeed from Mettl proteins. To further assess specificity, we undertook kd analysis targeting Mettl4, a gene of the Mettl3 and Mettl14 superfamily, and detected no change in m6A levels despite high kd efficiency (Supplementary Fig.1H and 1I). These studies show that both Mettl3 and Mettl14 exhibit in vitro and in vivo MTase activity and suggest that they function synergistically.
Figure 1. Mettl3 and Mettl14 are required for m6A formation in vitro and in vivo.
A. Schematic drawing showing predicted MTase domains of mouse Mettl3 (Accession: NP_062695.2) and Mettl14 (Accession: NP_964000.2) proteins. Numbers represent amino acid numbers. B. RT-qPCR (left) and western blot (right) showing Mettl3 (left panel) and Mettl14 (right panel) expression in mESC clones stably expressing shRNAs targeting each. GapDH serves as a loading control in the western blot. Scr: scramble; shM3, shRNA against Mettl3; shM14, shRNA against Mettl14. The original gel is shown in Supplementary Fig.5. C. Ethidium bromide staining (left panel) and m6A immunoblot (right panel) of DNA-free, rRNA-free Poly(A)+ RNA from Mettl3 kd, Mettl14 kd, and control cells. D. Measurement of percentage of m6A/A ratio by MS. E. Flag, Mettl3 or Mettl14 western immunoblots of proteins purified from lysates of HEK293 cells overexpressing flag-tagged Mettl3, Mettl14, or luciferase using M2 beads. Luc, luciferase; M3, Mettl3; M14, Mettl14. The original gel is shown in Supplementary Fig.5. F. CPM counts of RNA probes extracted after an in vitro methylation assay. G. CPM counts of excised m6A spots from digested RNA probes used in the methylation assay. Error bars from panels B and F-G represent means ± SEM from 3 separate experiments, expect M3 in panel G where n=7. One-tailed Student’s t-test, *P< 0.05, **P < 0.01, ***P < 0.001, ****P<0.0001 vs. scramble control. Scr: scramble control.
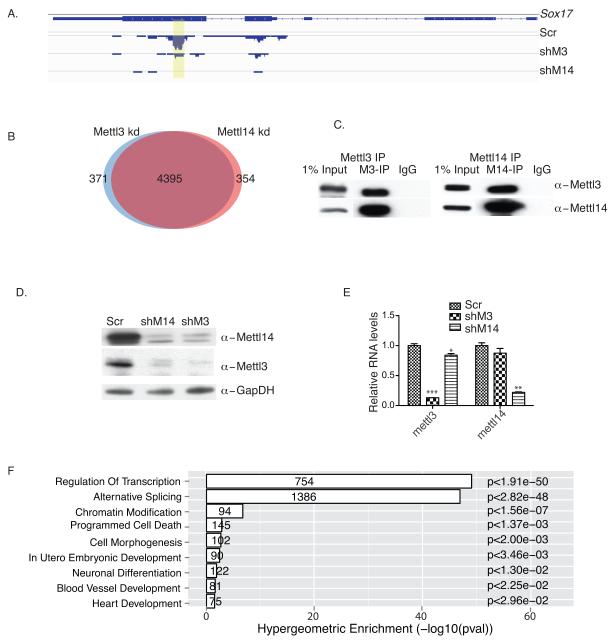
We next undertook a genome-wide search for RNA substrates showing decreased m6A methylation in kd mESCs by coupling m6A immunoprecipitation with high-throughput sequencing (meRIP-seq) 2,3. Twelve libraries, including replicates of a pair of input and meRIP samples from scramble controls, Mettl3 kd, and Mettl14 kd cells, were sequenced. Approximately 38 – 55 million reads were generated for each type of library and high Pearson correlation coefficients (cc) (R ≥ 0.97) were obtained among replicates, suggesting high library reproducibility. 3.8 to 6.7 million distinct reads uniquely aligned to the mouse mm10 reference genome were used to detect m6A sites, which were identified by MACS peak-calling software. A stringent cutoff threshold of False Discovery Rate (FDR) of <10% was used to obtain high confidence peaks. After combining replicate libraries, 8,645, 6,667, and 6,159 high confidence peaks from scramble, Mettl3 kd, and Mettl14 kd cells, respectively, remained for analysis. Overall, 4,766 genes in Mettl3 kd and 4,749 in Mettl14 kd cells showed significantly decreased transcript m6A levels relative to controls. For example, the Sox17 mRNA methylation peak was detected only in the scramble control but not in Mettl3 or Mettl14 kd cells (Fig.2A, Supplementary Table1). Interestingly, Mettl3 and Mettl14 targets overlapped substantially (Fig.2B), supporting our hypothesis that they synergize. To examine potential interaction in vivo, we performed co-immunoprecipitation (co-IP) of both endogenous and flag-tagged Mettl3 and Mettl14. All experiments demonstrated robust and specific interaction of both proteins (Fig. 2C and Supplementary Fig.2A). To determine whether Mettl3 or Mettl14 homodimerize, flag- and HA-tagged Mettl3 or Mettl14 were co-expressed in HEK293 cells. No HA-Mettl3 was pulled down by flag-Mettl3 (Supplementary Fig.2B), indicating that Mettl3 does not homodimerize. Similar results were observed for Mettl14 (Supplementary Fig.2B). We then asked whether these proteins regulated each other’s expression. Strikingly, we observed an almost total loss of Mettl3 protein in Mettl14 kd cells (Fig. 2D), despite a small decrease in Mettl3 RNA (Fig. 2E). Comparable results were observed for Mettl14 protein and RNA in Mettl3 kd cells (Fig. 2D and 2E), suggesting that Mettl3 and Mettl14 stabilize each other at the protein levels. Finally GO analysis indicated that Mettl3 and Mettl14 targets regulate transcription, RNA splicing, chromatin modification, programmed cell death, and cell fate determination (Fig. 2F). Overall, these results suggest that Mettl3 and Mettl14 regulate m6A modification of a significant number of mRNAs in mammalian cells, possibly by participating in a complex.
Figure 2. Mettl3 and Mettl14 interact and regulate each other’s stability.
A. meRIP-seq analysis of a Sox17 transcript showing loss of m6A methylation in both Mettl3 kd and Mettl14 kd cells. Yellow highlighting, peak location. Scr: scramble; shM3, shRNA against Mettl3; shM14, shRNA against Mettl14. B. Venn diagram showing overlap of Mettl3 and Mettl14 targets. C. Mettl3 or Mettl14 western immunoblots of endogenous proteins co-IP’d using antibodies against Mettl3 or Mettl14, or IgG in mESC lysates. M3, Mettl3; M14, Mettl14. The original gel is shown in Supplementary Fig.5. D. Western blot analysis of Mettl3 and Mettl14 protein levels in Mettl3 kd and Mettl14 kd mESCs, respectively. The original gel is shown in Supplementary Fig.5. E. RT-qPCR analysis of Mettl3 and Mettl14 RNA levels in Mettl3 kd and Mettl14 kd mESCs, respectively. F. GO analysis of 4395 shared Mettl3 and Mettl14 targets. Error bars from panel E represent means ± SEM from 3 separate experiments. One-tailed Student’s t-test, **P < 0.01, ***P < 0.001 vs. scramble control. Scr: scramble.
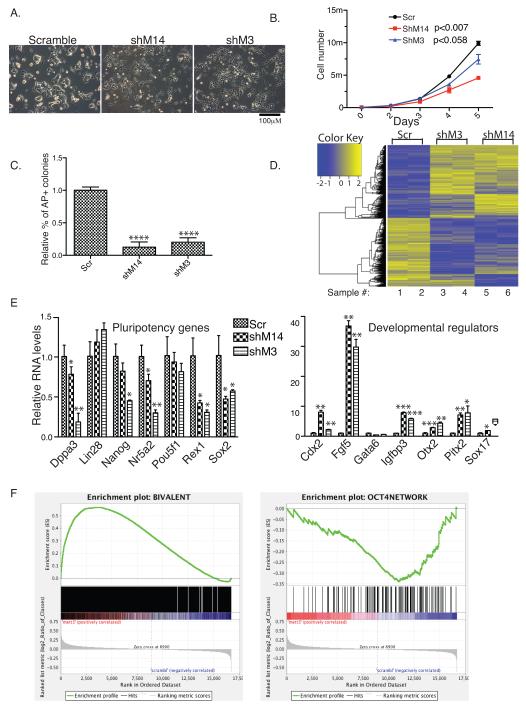
Phenotypically, Mettl3 or Mettl14 kd mESC colonies were flatter and less compact than control colonies (Fig. 3A and Supplementary Fig.3A), and cell proliferation rate decreased (Fig. 3B). Alkaline phosphatase (AP) staining showed that only 20-30% of mESC colonies were AP-positive in kd cells relative to scramble controls (Fig. 3C and Supplementary Fig.3B). More quantitative FACS analysis of AP positive cells showed that 50.8% of control cells exhibit high AP levels, while Mettl3 and Mettl14 kd cells showed 32.2% and 37.7%, respectively. SSEA-1 FACS analysis revealed no difference between kd (99.7% and 96.5% for Mettl3 and Mettl14, respectively) and control (99.3%) cells, indicating that kd cells differ from terminal differentiated cells and maintain some stem cell features. To understand these outcomes at the molecular level, we carried out microarray analysis of Mettl3 kd and Mettl14 kd mESCs and found that both shared gene expression profiles distinct from control cells (Fig. 3D). RT-qPCR analysis indicated that most pluripotency factors were downregulated in Mettl3 or Mettl14 kd cells relative to controls (Left panels of Fig. 3E, and Supplementary Fig.3C), while some developmental regulators were significantly upregulated (Right panels of Fig. 3E and Supplementary Fig.3C). Similar results were obtained from mESCs transfected for 48 hrs with siRNAs targeting either Mettl3 or Mettl14 genes (Supplementary Fig.3D). To expand these observations genome-wide, Gene-set Enrichment Analysis (GSEA) of pluripotency-related genes and developmental regulators was performed assessing differential gene expressions in kd versus control cells. Developmental regulators were defined as the ~2800 bivalent genes whose promoters exhibit both eu- and hetero-chromatin markers in mESCs 13, and 145 genes present in the Oct4-centered protein-protein interaction (PPI) network were used as pluripotency-related genes 14. GSEA analysis showed enrichment of developmental regulators in both Mettl3 and Mettl14 kd versus control cells (left panels of Fig. 3F and Supplementary Fig.3E), while pluripotency-related genes showed negative enrichment (right panels of Fig. 3F and Supplementary Fig.3E). Taken together, these studies suggest that m6A methylation is essential to maintain mESCs at their ground state.
Figure 3. Mettl3 or Mettl14 knockdown mESCs lose self-renewal capability.
A. Phase contrast microscopy showing colony morphology of kd versus control mESC cells. Scr: scramble; shM3, shRNA against Mettl3; shM14, shRNA against Mettl14. B. Growth curve assessing cell proliferation kinetics of kd versus control cells. P values are generated by two-way ANOVA. C. Quantification of AP-positive colonies. D. Heat map analysis based on microarray comparison of gene expression in kd and control cells. E. RT-qPCR analysis of pluripotency (left) and differentiation (right) genes in kd versus control cells. F. GSEA analysis on enrichment of developmental regulators (left) and pluripotency-related genes (right) in Mettl3 kd versus control cells. A False Discovery Rate (FDR) of <0.178 was calculated for bivalent genes and FDR<0 for pluripotency-related genes. Note that FDR<0.25 is statistically significant for GSEA analysis: www.broadinstitute.org/gsea/doc/GSEAUserGuideFrame.html. Scale bars, 100 μm. Error bars from panels B-C and E represent mean ± SEM from 3 separate experiments. One-tailed Student’s t-test, *P < 0.05, **P < 0.01, ***P < 0.001, ****P<0.0001 vs. scramble control. Scr: scramble.
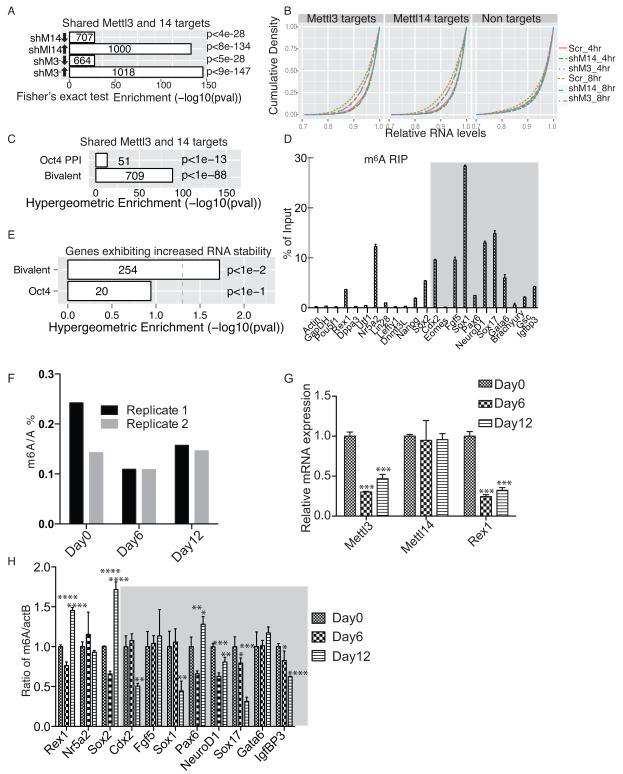
m6A is highly enriched near transcript stop codon 2,3. Thus we conducted 35S-pulse labeling in kd and control mESCs to determine whether depletion of modification impaired protein synthesis and detected no significant changes (Supplementary Fig.4A and Supplementary Fig.4B). However, analysis of potential correlation between RNA methylation and gene expression levels indicated that loss of m6A methylation following Mettl3 kd or Mettl14 kd was more significantly associated with gene up- than down-regulation (Fig. 4A and Supplementary Fig.4C). Multiple cellular mechanisms can contribute to increased RNA levels. Since m6A is an internal modification that is enriched at 3-UTR 2,3, we checked whether m6A affects mRNA decay rate by measuring RNA levels from actinomycin D (ActD) treated scramble and kd mESCs. Significantly, Mettl targets showed a ~23% increase in the maximum cumulative RNA stability in kd cells compared to the controls (Fig. 4B, left and mid-panels, and Supplementary Table2) from 4 to 8 hrs after ActD treatment, in contrast to only 9% for the non-targets (Fig. 4B, right panel, and Supplementary Table2), suggesting that m6A modification accelerates transcript decay.
Figure 4. m6A modification regulates mRNA stability.
A. Enrichment of up- or down- regulated Mettl3 and Mettl14 targets in kd versus control cells. Arrows indicate up- or down regulation of gene expression. Scr: scramble; shM3, shRNA against Mettl3; shM14, shRNA against Mettl14. B. Comparison of cumulative transcript abundance in cells treated with Actinomycin D for 0, 4, and or 8 hrs by microarray analysis. RNAs from 0 hr serves as base-line. KS test, p< 2.2e-16 comparing the changes in relative RNA levels from 4 to 8 hrs between Mettl targets and non-targets in both Mettl3 kd and Mettl14 kd cells. C. Enrichment of bivalent and pluripotency (Oct4 PPI) genes in shared Mettl3 and Mettl14 targets. D. meRIP-qPCR of specific bivalent and pluripotency genes (grey area). E. Enrichment of Mettl3 and Mettl14 targets showing increased RNA stability in kd cells among bivalent and pluripotency genes. F. Measurement of a percentage of m6A/A ratio by MS in undifferentiated (day 0), day6, and day 12 differentiated mESCs. G. RT-qPCR of Mettl3, Mettl14, and Rex1 expression in undifferentiated and differentiated mESCs. H. meRIP-qPCR of specific bivalent (gray area) and pluripotency genes in mESCs during differentiation. Error bars from panels D and G-H represent means ± SEM from 3 separate experiments. One-tailed Student’s t-test, *P < 0.05, **P < 0.01, ***P < 0.001, ****P < 0.0001 vs. scramble control. Scr: scramble.
Next we asked whether developmental regulators or pluripotency-related genes are subject to m6A regulation. Enrichment analysis showed that compared to pluripotency-related genes, developmental regulators were much more significantly enriched in Mettl3 and Mettl14 targets (Fig. 4C). meRIP RT-qPCR of both gene subclasses confirmed that transcripts of many developmental regulators were more highly enriched in m6A methylation than were transcripts encoding housekeeping genes such (ActB or GapDH) or the pluripotency factors (such as Pou5f1 or Nanog) (Fig. 4D). Bivalent genes identified as Mettl3 or Mettl14 targets also showed a more significant increase in RNA stability than did pluripotency genes following kd of either protein (Fig. 4E), suggesting that m6A methylation destabilizes developmental regulators. To further understand the dynamics of m6A modification, we measured m6A levels during mESC differentiation. Cells at days 6 or 12 of differentiation showed overall m6A levels (Fig. 4F) or Mettl14 expression (Fig. 4G) comparable to undifferentiated mESCs, although we detected a moderate decrease in Mettl3 expression in differentiated cells (Fig. 4G). Interestingly, gene-specific meRIP-qPCR showed significantly decreased m6A levels in 5 of 8 developmental regulators examined in day12 cells (Fig. 4H, grey area). In contrast, all 3 pluripotency-related genes showed unchanged or increased m6A levels (Fig.4H). These data indicate that developmental regulators are subject to m6A regulation in mESCs.
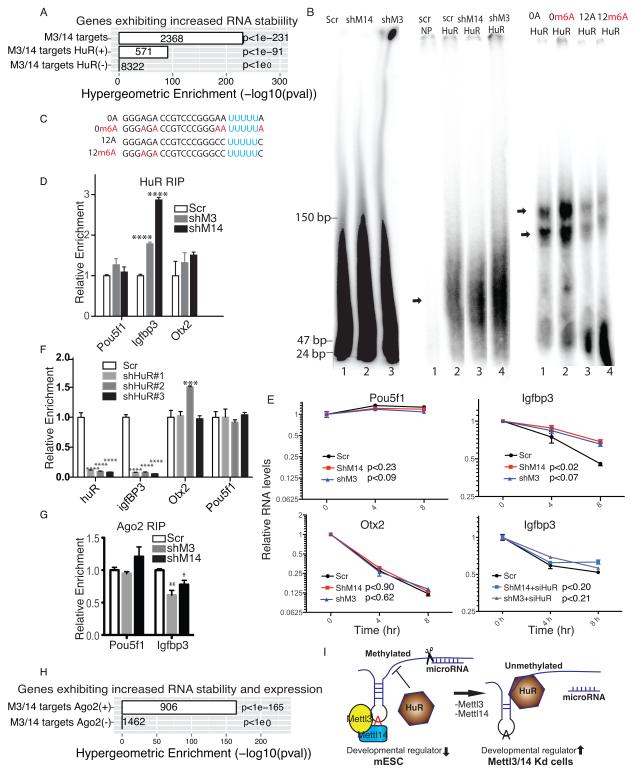
To assess molecular mechanisms underlying m6A methylation-mediated RNA decay, we focused on the well-established RNA stabilizer protein HuR 15,16, which binds to the U-rich regions at the 3′-UTR of thousands of transcripts 17,18. Enrichment analysis suggested that Mettl targets exhibiting HuR binding sites showed significantly increased RNA stability (Fig. 5A) relative to those without HuR sites. We then asked whether the presence of m6A affects HuR binding to RNA. To do so, we incubated purified HuR protein (Supplementary Fig.4D) with fragmented mRNA extracted from scramble, Mettl3 kd, and Mettl14 kd cells (Fig. 5B, left panel) and performed RNA electrophoretic mobility shift assay. We observed increased HuR binding to demethylated mRNA extracted from kd compared to control cells (Fig. 5B, mid-panels). However, work reported by Dominissini et al 3 indicated that HuR interacts with an RNA probe containing m6A in vitro. To assess this potential discrepancy, we examined the ~60 bp RNA probe used in that study in which m6A is immediately adjacent to the HuR binding site. We reasoned that endogenous m6A and HuR sites may not always co-localize since predicted m6A and HuR binding sites RNA motifs differ substantially and hypothesize that the spacing of HuR and m6A sites may affect their interaction. Thus, we designed RNA probes with no spacer (Fig. 5C, RNA probes 0A and 0m6A) or a 12-nt spacer (Fig. 5C, RNA probes 12A and 12m6A) between A/m6A and HuR sites. Consistent with Dominissini et al 3, we observed significantly increased HuR binding to the 0m6A versus 0A RNA probes (Fig. 5B, right panel). By contrast, we observed moderately decreased HuR binding in the presence of the 12 nt spacer (Fig. 5B, right panel), suggesting spatial constraints govern m6A and HuR binding.
Figure 5. The HuR-microRNA pathway functions in m6A methylation-mediated RNA stability.
A. Enrichment of genes showing increased RNA stability following Mettl3 or Mettl14 kd among all shared Mettl3 and Mettl14 targets and among targets with and without canonical HuR binding sites in their 3′-UTR regions. M3, Mettl3; M14, Mettl14. B. Left panel, denaturing PolyAcrylamide Gel Electrophoresis (PAGE) showing the size of fragmented, DNAse-treated, rRNA-free mRNAs extracted from scramble and kd cells; mid-panel, non-denaturing PAGE showing differential binding of HuR to RNAs probes from left panel. Scr: scramble control, shM14, shRNA against Mettl14, shM3, shRNA against Mettl3. NP: no protein added. Right panel, non-denaturing PAGE showing differential binding of HuR to RNA probes enlisted in C. C. RNA probes with the canonical UUUUU HuR binding site locatd either next to A (0A) or m6A (0m6A) or separated by a 12-nucleotide spacer (12A and 12m6A). D. HuR RIP-qPCR of Pou5f1, Igfbp3, and Otx2 from kd versus control cells. E. RT-qPCR of Pou5f1, Igfbp3, and Otx2 in Actinomycin D-treated kd cells. In the case of Igfbp3, cells are also treated with and without siRNA targeting HuR. P values are generated using two-way ANOVA. F. RT-qPCR of HuR, Igfbp3, Otx2, and Pou5f1 in mESC with depleted HuR. shHuR#1-3: shRNAs against HuR. G. Argonaute 2 (Ago2) RIP–qPCR of Igfbp3 and Pou5f1 RNAs from kd versus control cells. H. Enrichment of genes showing increased RNA stability and expression among shared Mettl3 and Mettl14 targets. Targets are classified by whether they display Ago2 binding sites. I. Model: In wildtype mESCs, Mettl3 and Mettl14 methylate RNA synergistically and m6A methylation on some transcripts, particularly those encoding developmental regulators, blocks HuR binding, resulting in transcript destabilization. In Mettl3 and Mettl14 kd cells, loss of m6A allows HuR-mRNA interaction and attenuation of microRNA targeting, enhancing stability of transcripts especially those encoding developmental regulators, and promoting loss of the mESC ground state. A potentially methylated A is shown in red. Error bars from panels D-G represent means ± SEM from 3 separate experiments. One-tailed Student’s t-test, *P < 0.05, ** p< 0.01, ****P<0.0001 vs. scramble control. Scr: scramble.
To analyze potential negative interaction between HuR and m6A in vivo, we chose three representative genes for validation: Pou5f1, Otx2, and Igfbp3. Pou5f1 transcripts lack m6A, while bivalent Otx2 and Igfbp3 are Mettl3 and Mettl14 targets that showed increased expression in kd cells (Fig. 3E and Supplementary Fig.3C). The Igfbp3 3′-UTR, however, exhibits a HuR binding motif, while that of Otx2 does not. Assessment of the m6A methylation status of Otx2 and Igfbp3 showed that both transcripts were demethylated in Mettl kd cells (Supplementary Fig.4E). RIP analysis indicated increased HuR binding at Igfbp3 3′-UTR in Mettl3 or Mettl14 kd cells, but not of Otx2 or Pou5f1 (Fig. 5D), suggesting that de-methylation accompanies HuR binding. Importantly, increased HuR binding accompanied increased stability of Igfbp3 RNA but not of Otx2 and Pou5f1 in kd cells (Fig. 5E). To test whether HuR mediated that increased stability, we first confirmed that we could target HuR efficiently with siRNA in Mettl3 or Mettl14 kd cells (Supplementary Fig.4F). We then measured Igfbp3 RNA stability in these cells in the absence of HuR and observed that stability was restored to control levels (Fig. 5E). This result was confirmed by specifically decreased Igfbp3 expression in mESCs depleted of HuR (Fig. 5F). Overall, our in vivo analysis suggests that loss of m6A methylation enhances HuR RNA binding to increase RNA stability.
HuR binding reportedly increases RNA stability by blocking microRNA targeting 15,16. Igfbp3, for example, is a direct target of several microRNAs 19,20. Therefore, we carried out RIP with Argonaute 2 (Ago2), a key factor of the RNA-induced silencing complex (RISC), in Mettl3 or Mettl14 kd cells. We observed a ~25-40% decrease in Ago2 binding to the Igfbp3 3′-UTR, but little change to Pou5f1, which is not a methylation target and displays equavalent HuR binding in kd versus control cells (Fig. 5G). To understand whether this mechanism applies to other RNAs, we evaluated Mettl3 or Mettl14 targets that show increased RNA stability and expression in relation to Ago2-bound mRNAs in kd versus control mESCs, as defined by a previous CLIP-seq study21. Interestingly, we observed specific enrichment of Ago2-bound Mettl3/14 targets (Fig. 5H) but not targets lacking Ago2 binding. These results suggest that the HuR/microRNA pathway mediates m6A-regulated RNA stability.
We propose a model in which the presence of m6A methylation on some transcripts in mESCs, particularly those encoding developmental regulators, blocks HuR binding and destabilizes them, thereby maintaining the mESC ground state (Fig. 5I). Our work suggests that m6A methylation is an essential RNA regulatory mechanism in mammalian cells.
Supplementary Material
Acknowledgements
We thank Dr. Miles Wilkinson and all members of his laboratory for many valuable discussions; the Mass Spectrometry, Metabolomics, and Proteomics Facility at the University of Illinois at Chicago for measuring m6A/A ratios; Subramaniam Shyamala Govindarajan from the Analytical Genomics core facility at the Sanford Burnham Medical Institute (Lake Nona) for performing the microarray analysis; and Phillip Ordoukhanian and Steven Robert Head from the Scripps Research Institute for high throughput sequencing analysis. This work is supported by a CIRM Training Grant TG2-01162 (Y.W.), an AACR-Aflac, Inc. Career Development Award for Pediatric Cancer Research 12-20-10-ZHAO (J.C.Z.), the Ontario Research Fund - Global Leader (Round 2) and Natural Sciences and Engineering Research Council (NSERC) (Z.Z.), and an NSERC Canada Graduate Scholarship and Ontario Graduate Scholarship (Y.L.). M.D.P. is an American Cancer Society Research Scholar (RSG-11-224-01-DMC). Z.Z. would like to dedicate this paper to the memory of S. Z.
Footnotes
Author Contributions Y.W. generated Mettl3 and Mettl14 knockdown mESC lines, and using these lines, designed, performed, and analyzed most experiments, except meRIP, RIPs, and EMSAs. meRIP, RIPs, and EMSAs were performed by Y.W. and J.C.Z. Y.L. performed all bioinformatics analysis under the supervision of Z.Z. J.I.T. and M.D.P. purified luciferase, Mettl3 and/or Mettl14 proteins from baculovirus-infected Sf9 insect cells. J. C. Z. formulated, analyzed, and directed the study and wrote the paper.
REFERENCES
- 1.Jia G, Fu Y, He C. Reversible RNA adenosine methylation in biological regulation. Trends in genetics : TIG. 2013;29:108–115. doi: 10.1016/j.tig.2012.11.003. doi:10.1016/j.tig.2012.11.003. [DOI] [PMC free article] [PubMed] [Google Scholar]
- 2.Meyer KD, et al. Comprehensive analysis of mRNA methylation reveals enrichment in 3′ UTRs and near stop codons. Cell. 2012;149:1635–1646. doi: 10.1016/j.cell.2012.05.003. doi:10.1016/j.cell.2012.05.003. [DOI] [PMC free article] [PubMed] [Google Scholar]
- 3.Dominissini D, et al. Topology of the human and mouse m6A RNA methylomes revealed by m6A-seq. Nature. 2012;485:201–206. doi: 10.1038/nature11112. doi:10.1038/nature11112. [DOI] [PubMed] [Google Scholar]
- 4.Zheng G, et al. ALKBH5 Is a Mammalian RNA Demethylase that Impacts RNA Metabolism and Mouse Fertility. Molecular cell. 2013;49:18–29. doi: 10.1016/j.molcel.2012.10.015. doi:10.1016/j.molcel.2012.10.015. [DOI] [PMC free article] [PubMed] [Google Scholar]
- 5.Jia G, et al. N6-methyladenosine in nuclear RNA is a major substrate of the obesity-associated FTO. Nature chemical biology. 2011;7:885–887. doi: 10.1038/nchembio.687. doi:10.1038/nchembio.687. [DOI] [PMC free article] [PubMed] [Google Scholar]
- 6.Bokar JA, Shambaugh ME, Polayes D, Matera AG, Rottman FM. Purification and cDNA cloning of the AdoMet-binding subunit of the human mRNA (N6-adenosine)-methyltransferase. RNA. 1997;3:1233–1247. [PMC free article] [PubMed] [Google Scholar]
- 7.Clancy MJ, Shambaugh ME, Timpte CS, Bokar JA. Induction of sporulation in Saccharomyces cerevisiae leads to the formation of N6-methyladenosine in mRNA: a potential mechanism for the activity of the IME4 gene. Nucleic acids research. 2002;30:4509–4518. doi: 10.1093/nar/gkf573. [DOI] [PMC free article] [PubMed] [Google Scholar]
- 8.Agarwala SD, Blitzblau HG, Hochwagen A, Fink GR. RNA methylation by the MIS complex regulates a cell fate decision in yeast. PLoS genetics. 2012;8:e1002732. doi: 10.1371/journal.pgen.1002732. doi:10.1371/journal.pgen.1002732. [DOI] [PMC free article] [PubMed] [Google Scholar]
- 9.Zhong S, et al. MTA is an Arabidopsis messenger RNA adenosine methylase and interacts with a homolog of a sex-specific splicing factor. The Plant cell. 2008;20:1278–1288. doi: 10.1105/tpc.108.058883. doi:10.1105/tpc.108.058883. [DOI] [PMC free article] [PubMed] [Google Scholar]
- 10.Bodi Z, et al. Adenosine Methylation in Arabidopsis mRNA is Associated with the 3′ End and Reduced Levels Cause Developmental Defects. Frontiers in plant science. 2012;3:48. doi: 10.3389/fpls.2012.00048. doi:10.3389/fpls.2012.00048. [DOI] [PMC free article] [PubMed] [Google Scholar]
- 11.Bujnicki JM, Feder M, Radlinska M, Blumenthal RM. Structure prediction and phylogenetic analysis of a functionally diverse family of proteins homologous to the MT-A70 subunit of the human mRNA:m(6)A methyltransferase. Journal of molecular evolution. 2002;55:431–444. doi: 10.1007/s00239-002-2339-8. doi:10.1007/s00239-002-2339-8. [DOI] [PubMed] [Google Scholar]
- 12.Petrossian TC, Clarke SG. Uncovering the human methyltransferasome. Molecular & cellular proteomics : MCP. 2011;10 doi: 10.1074/mcp.M110.000976. M110 000976, doi:10.1074/mcp.M110.000976. [DOI] [PMC free article] [PubMed] [Google Scholar]
- 13.Ku M, et al. Genomewide analysis of PRC1 and PRC2 occupancy identifies two classes of bivalent domains. PLoS genetics. 2008;4:e1000242. doi: 10.1371/journal.pgen.1000242. doi:10.1371/journal.pgen.1000242. [DOI] [PMC free article] [PubMed] [Google Scholar]
- 14.van den Berg DL, et al. An Oct4-centered protein interaction network in embryonic stem cells. Cell stem cell. 2010;6:369–381. doi: 10.1016/j.stem.2010.02.014. doi:10.1016/j.stem.2010.02.014. [DOI] [PMC free article] [PubMed] [Google Scholar]
- 15.Srikantan S, Tominaga K, Gorospe M. Functional interplay between RNA-binding protein HuR and microRNAs. Current protein & peptide science. 2012;13:372–379. doi: 10.2174/138920312801619394. [DOI] [PMC free article] [PubMed] [Google Scholar]
- 16.Kundu P, Fabian MR, Sonenberg N, Bhattacharyya SN, Filipowicz W. HuR protein attenuates miRNA-mediated repression by promoting miRISC dissociation from the target RNA. Nucleic acids research. 2012;40:5088–5100. doi: 10.1093/nar/gks148. doi:10.1093/nar/gks148. [DOI] [PMC free article] [PubMed] [Google Scholar]
- 17.Kishore S, et al. A quantitative analysis of CLIP methods for identifying binding sites of RNA-binding proteins. Nature methods. 2011;8:559–564. doi: 10.1038/nmeth.1608. doi:10.1038/nmeth.1608. [DOI] [PubMed] [Google Scholar]
- 18.Lebedeva S, et al. Transcriptome-wide analysis of regulatory interactions of the RNA-binding protein HuR. Molecular cell. 2011;43:340–352. doi: 10.1016/j.molcel.2011.06.008. doi:10.1016/j.molcel.2011.06.008. [DOI] [PubMed] [Google Scholar]
- 19.Le MT, et al. Conserved regulation of p53 network dosage by microRNA-125b occurs through evolving miRNA-target gene pairs. PLoS genetics. 2011;7:e1002242. doi: 10.1371/journal.pgen.1002242. doi:10.1371/journal.pgen.1002242. [DOI] [PMC free article] [PubMed] [Google Scholar]
- 20.Lu L, Katsaros D, de la Longrais IA, Sochirca O, Yu H. Hypermethylation of let-7a-3 in epithelial ovarian cancer is associated with low insulin-like growth factor-II expression and favorable prognosis. Cancer research. 2007;67:10117–10122. doi: 10.1158/0008-5472.CAN-07-2544. doi:10.1158/0008-5472.CAN-07-2544. [DOI] [PubMed] [Google Scholar]
- 21.Leung AK, et al. Genome-wide identification of Ago2 binding sites from mouse embryonic stem cells with and without mature microRNAs. Nature structural & molecular biology. 2011;18:237–244. doi: 10.1038/nsmb.1991. doi:10.1038/nsmb.1991. [DOI] [PMC free article] [PubMed] [Google Scholar]
Associated Data
This section collects any data citations, data availability statements, or supplementary materials included in this article.


