

Abstract
Mutations in the gene for LRRK2 are the most common cause of familial Parkinson’s disease (PD) and patients with these mutations manifest clinical features that are indistinguishable from those of the more common sporadic form. Thus, investigations of disease mechanisms based on disease-causing LRRK2 mutations can be expected to shed light on the more common sporadic form as well as the inherited form. We have shown that as human BAC transgenic hLRRK2(R1441G) mice age, they exhibit two abnormalities in the nigrostriatal dopaminergic system: an axonopathy and a diminished number of dendrites in the substantia nigra (SN). To better understand disease mechanisms it is useful to determine where in the affected neural system the pathology first begins. We therefore examined the nigrostriatal dopaminergic system in young mice to determine the initial site of pathology. Brains from hLRRK2(R1441G) and littermate control mice at 2–4 months of age were examined by immunohistochemistry, anterograde fluorescent axon labeling and ultrastructural analysis. SN neurons, their projecting axons and the striatal terminal fields were assessed. The first identifiable abnormality in this system is an axonopathy characterized by giant polymorphic axon spheroids, the presence of intra-axonal autophagic vacuoles and intra-axonal myelin invagination. An initial involvement of axons has also been reported for other genetic models of PD. These observations support the concept that axons are involved early in the course of the disease. We suggest that effective neuroprotective approaches will be aimed at preventing axonal degeneration.
Keywords: axon, spheroid, autophagy, substantia nigra, nigrostriatal
Graphical Abstract
Introduction
Mutations in leucine-rich repeat kinase 2 (LRRK2) are the most genetic common cause of Parkinson disease (PD) (Greggio and Cookson, 2009) and their discovery in 2004 (Paisan-Ruiz et al., 2004; Zimprich et al., 2004) provided invaluable opportunities to begin to understand the pathogenesis of the disease and the development of novel animal models. One of the common themes to emerge from studies of LRRK2 has been that it may play a role in the development and maintenance of neural processes, both dendrites and axons. MacLeod and colleagues observed in primary cortical cultures that mutant forms of LRRK2 induce neurite retraction, whereas knock down of endogenous LRRK2 by shRNA vectors results in greater neurite length (MacLeod et al., 2006). Plowey et al also noted an induction of neurite retraction by the G2019S mutant in SH-SY5Y cells, associated with activation of macroautophagy (Plowey et al., 2008). Observations supporting a role for LRRK2 in the regulation of neurite growth and maintenance have been made in vivo as well. In C. elegans, the LRRK2 homologue, lrk-1, regulates the trafficking of synaptic vesicle proteins to axon terminals (Sakaguchi-Nakashima et al., 2007). Loss of the LRRK2 homologue in Drosophila results in synaptic overgrowth at the neuromuscular junction, an effect that is due to phosphorylation of a microtubule-binding protein (Lee et al., 2010). In transgenic Drosophila expressing the human G2019S mutant, dendrite degeneration occurs as a result of ectopic expression of tau in dendrites. hLRRK2(G2019S) appears to mediate this effect indirectly, by phosphorylation and activation of the homologue of glycogen synthase kinase 3β, which, in turn, phosphorylates tau (Lin et al., 2010).
Abnormalities of neural processes have also been identified specifically within the dopaminergic nigrostriatal projection in transgenic mouse models. Ramonet and colleagues observed that primary dopaminergic postnatal mesencephalic cultures derived from hLRRK2(G2019S) mice showed diminished neurite length and branching (Ramonet et al., 2011), a result reminiscent of the observations made by MacLeod and colleagues (MacLeod et al., 2006). We identified abnormalities of the mesencephalic dopaminergic system in mature (9 – 10 months) hLRRK2(R1441G) BAC transgenic mice (Li et al., 2009). While these mice had a normal number of dopamine neurons in the substantia nigra (SN) and a normal-appearing nigrostriatal projection at the regional level, at the single fiber level they had abnormal axons, characterized by large, polymorphic spheroids and dystrophic neurites. The later were identified by immunostaining for tyrosine hydroxylase (TH) and for phosphorylated tau with the AT8 antibody (Biernat et al., 1992). In addition, these mice demonstrated a diminished number of TH-positive dendrites in the SN pars reticulata (SNpr), an abnormality that was also described by Ramonet et al in their hLRRK2(G2019S) transgenic mice (Ramonet et al., 2011).
In order to use knowledge of pathogenic mechanisms to devise approaches to neuroprotective therapies, it is vital to know where and how a disease process begins. This information provides clues to which of the many possible functional effects of a disease-causing mutation may be the most relevant to disease onset. In addition, in devising neuroprotective approaches, the best strategy is to target the earliest abnormal events, so as to forestall subsequent damaging secondary events. Therefore, in this study we have undertaken a comprehensive analysis of the mesencephalic dopaminergic system in young (2–4 month) hLRRK2(R1441G) transgenic mice to attempt to identify where pathology first appears.
Materials and Methods
Mice and Animal Care Procedures
The bacterial artificial chromosome (BAC) hLRRK2(R1441G) mice were generously made available by Dr. CJ Li and maintained in a FVB background (Charles River). These mice have been previously characterized with respect to the anatomical, neurochemical and behavioral phenotype (Li et al., 2009). In addition we herein sought to determine the cellular patterns of expression of the human transgene mRNA. All morphologic studies (brightfield, epifluorescence, confocal and transmission electron microscopy) were conducted in adult (2–4 months old) heterozygous transgenic mice and their non-transgenic littermates were used as controls. Adult C57B/6l mice (also 2–4 months old) (Charles River) were used in some experiments to compare the two strains. Genotyping was performed by PCR on DNA isolated from tail tissue as previously described (Li et al., 2009). All procedures, described below, were approved by the Columbia University Animal Care and Use Committee and were conducted in accordance with the United States Public Health Service’s Policy on Humane Care and Use of Laboratory Animals.
Behavioral Analysis
For the analysis of behavior animals were studied between the ages of 6 to 14 months. For this analysis, mice were bred over a period of two years. Transgenic mice and their non-transgenic litter mates were kept in the same cage (maximum 5 animals per cage). The cage was opened in a procedure hood and the animals were observed over 5 minutes without knowing their genotype. The animals that did not move during the 5 minute period were considered to have immobility behavior as originally described (Li et al., 2009). Mice were examined subsequently at two week intervals; and if this immobility test was positive a second time, then the mouse was classified as having the immobility phenotype.
Nonradioactive in Situ Hybridization for Human LRRK2 mRNA
A probe for in situ hybridization was obtained by subcloning of a 500bp PCR fragment from hLRRK2 cDNA in pGEM-T vector system (Promega, Madison, Wi). Brains were rapidly removed, and frozen in OCT (Tissue-Tek) on dry ice. Sections (14 μm) were thaw-mounted onto glass slides (Superfrost Plus; Fisher Scientific). For hybridization, sections were warmed to 37°C and then fixed by immersion in 4% paraformaldehyde (PF) in 0.1 M phosphate buffer (PB) pH 7.1. Sections were then treated with a prehybridization solution as previously described (Burke et al., 1994). Sections were then covered with hybridization solution and incubated overnight at 68°C. Hybridization solution contained antisense hLRRK2 riboprobe obtained with digoxigenin RNA Labeling Mix (Roche, Mannheim, Germany) and T7 RNA polymerase (Promega). After washes, sections were incubated with an anti-digoxigenin antibody (Roche Diagnostics) at 1:5000 overnight at 4°C. After additional washes, sections were then incubated with BCIP/NBT (Promega, Madison WI) developing solution overnight at room temperature. Sections were washed and coverslipped with Dako aqueous mounting medium (Dako, CA).
Immunohistochemical Staining Procedures
Cryostat Sections
Mice were anesthetized and transcardially perfused with 0.9% NaCl followed by 4% PF in 0.1 M PB, pH 7.1. The brains were blocked into midbrain and forebrain regions. The region containing the midbrain was postfixed for 48 hours, cryoprotected in 20% sucrose overnight, and then rapidly frozen. A complete set of serial sections was cut through the SN at 30 μm. Sections were processed free-floating for the following primary antibodies: anti-TH (Calbiochem, La Jolla, CA) at 1:750; Calbindin (CBN) (Swant, Switzerland) at 1:2500, aldehyde dehydrogenase 1A1 (AHD2) (Abcam, Cambridge, MA) at 1:500 and Fluorogold (Millipore, Billerica, MA) at 1:2000. Sections were then treated with biotinylated protein A and avidin-biotinylated horseradish peroxidase complexes (ABC, Vector Labs, Burlingame, CA). After immunoperoxidase staining, sections were thionin counterstained. The forebrain region containing the striatum was postfixed 48 hours; frozen without cryoprotection, and processed for TH, CBN and AHD2 immunostaining as described above. Vibratome Sections: Animals were perfused as described above; the brains were removed and postfixed for 48 hours. Brains were sectioned as 50 μm horizontal sections and processed for TH immunostaining as described above. Immunofluorescence staining for AT8 was performed on horizontal vibratome sections obtained from mouse brains injected with AAV-Tau Tomato. Sections were then incubated with the anti-AT8 (Thermo Scientific) at 1:100. Sections were then incubated in biotinylated anti-mouse reagent (Vector Labs, Burlingame, CA) followed by fluorescein avidin DCS at 1:100 (Vector Labs, Burlingame, CA). After phosphate buffered saline (PBS) wash, the sections were mounted and then coverslipped with DakoCytomation (Dako, CA).
Quantitative Analysis of SN TH-positive Neuron Numbers and SNpr TH-positive Neurites
Each complete set of TH - immunostained serial sections was coded and analyzed by a stereological method under blind conditions. For each animal, one side of the brain was analyzed. The entire SN was defined as the region of interest. Using StereoInvestigator software (MicroBrightfield, Inc., Williston, VT), a fractionator probe was established for each section. The total number of positive neurons and the total volume of the SN (in cubic microns) were determined by the StereoInvestigator software program. To measure the number of TH-positive fibers within the SNpr, a single SN section containing the medial terminal nucleus of the accessory optic tract (MT) was chosen and analyzed under blind conditions. The entire SNpr was defined as the area of interest. The number of TH-positive fibers in each counting frame was then determined at 100X under oil immersion. The criterion for counting a fiber was any linear TH-positive fiber that intersected the upper horizontal line (green) of the counting frame.
Quantitative Analysis of TH-positive Axonal Spheroids
Two vibratome horizontal sections (50 μm) containing the third ventricle, the third ventricle recess, and the A13 dopaminergic group were analyzed by a stereological method for each animal under blind conditions. The entire medial forebrain bundle (MFB) and globus pallidus were defined as the area of interest. The number of TH-positive axonal spheroids in each counting frame was determined at 100X under oil immersion. The cross-section area of each axonal spheroid was determined by tracing a contour around each profile.
Production of AAVs
All vectors used for these studies were AAV1 serotype. A plasmid containing GFP-LC3 was kindly provided by Drs. N. Mizushima and T. Yoshimori (Kabeya et al., 2000) and used to generate AAV GFP-LC3 as described (Cheng et al., 2011). Plasmids containing mouse Tau and tdTomato cDNAs were purchased from AddGene (Cambridge, MA). DNA fragments corresponding to the desired genes were cut out with appropriate restriction enzymes and subcloned in pBL backbone vector. A mouse DNA fragment corresponding to the first 24 aa of Cox8 protein was created by PCR from mouse SN cDNA. This PCR fragment was subcloned with the GFP fragment at 3′ end in pBL backbone. These modified genes were then cloned into an AAV packaging construct that utilizes the chicken β-actin promoter, and contains a 3′ WPRE (pBL). AAVs were produced by the University of North Carolina Vector Core. The titer of AAV Tau-Tomato was 2 E12, viral genomes/mL, and those of AAV GFP-LC3 and AAV GFP-mCOX8 were 1.2 E12 and 4 E12 viral genomes/mL, respectively.
Intranigral Injection of Adeno-Associated Virus Vectors
Mice were anesthetized and placed in a stereotaxic frame (Kopf Instruments). The tip of a 0.5 μl syringe needle (26S) was inserted to stereotaxic coordinates relative to bregma: anterior-posterior (AP) = −0.35 cm; medial-lateral (ML) = +0.11 cm; and dorsal-ventral (DV) = −0.37 cm. Viral vector suspension in a volume of 2.0 μl was injected at 0.1 μl/min over 20 minutes.
Confocal Images of Nigrostriatal Axons in the MFB
Horizontal vibratome sections (50 μm) were prepared from transgenic, non-transgenic littermates and C57Bl/6 mice that had been injected into the SN with AAV-Tau tomato. A horizontal section containing the third ventricle and third ventricle recess was chosen to acquire images of Tau-tomato positive axonal spheroids in the MFB. Images were acquired with a 63X objective by confocal microscopy (Leica TCS SP5) and at a zoom factor of 4 applied. Each profile was scanned in the Z-axis with 0.5 μm optical planes in a vertical distance that covered the entire profile. The volume of the spheroid reconstructed in 3D was determined using Volocity 3D Image Analysis Software.
Transmission Electron Microscopy
Mice were anesthetized and transcardially perfused with 0.9% NaCl followed by 4.0% PF and 0.5% glutaraldehyde in 0.065 M NaH2PO4; 1 mM EGTA and 5 mM MgCl2 pH 6.8. The brains were post-fixed overnight. Horizontal sections (50 μm) were cut on a vibratome. Tau-tomato positive axonal spheroids were detected under epifluorescence and the tissue volume containing the spheroid was microdissected (2 × 2 mm) and then processed for electron microscopy. Sections were post-fixed in 1% osmium tetroxide in 0.1 M PB, dehydrated through a series of graded alcohols and propylene oxide and flat-embedded in Durcupan ACM epoxy resin (Electron Microscopy Sciences, Hatfield, PA). Ultrathin sections were cut, counterstained with lead citrate and examined with a JEOL JEM-1200 EXII electron microscope.
Assessment of Retrograde Axonal Transport with Fluorogold
For the assessment of retrograde transport with Fluorogold, mice were studied at 2–4 and 12 months. They were anesthetized and placed in a stereotaxic frame (Kopf Instruments, Tujunga, CA). Animals then received unilateral injection of Fluorogold (FG) (Fluorochrome, CO) into the striatum as a 0.4% solution in 0.9% NaCl infused by pump. At 3, 6 and 24 hours post-FG injection times, animals were sacrificed by transcardiac perfusion and the brains were processed for FG immunostaining.
Statistical Analysis
The difference between transgenic mice and non-transgenic littermate controls for the appearance of the immobility behavior was analyzed by Kaplan-Meier Survival Analysis. The difference between two groups for counts was analyzed by the t test. Multiple comparisons among groups for spheroid number were performed by one-way ANOVA and Tukey’s post hoc analysis. Analysis of normality in population distributions of spheroid numbers was performed by Kolmogorov-Smirnov Normality test. All statistical analysis were performed using SigmaStat software (SPSS Science, Chicago, IL).
Results
Characterization of hLRRK2(R1441G) BAC transgenic mice
Two male hLRRK2(R1441G) BAC transgenic mice were received from Dr. Li’s colony at Weill-Cornell Medical College, and we expanded our colony in mice of the FVB strain obtained from Charles River. To determine the copy number and chromosomal insertion site(s) of the human LRRK2 gene in the two male breeder mice, fluorescence in situ hybridization (FISH) of metaphase chromosomes was performed on offspring of each (Mayo Clinic Cytogenetics Resource, Rochester, MN). This analysis demonstrated a single insertion of the transgene in the same location on chromosome 1 for offspring of both males (Fig 1A). We concluded that these two mice were from the same original founder line. We therefore conducted further matings exclusively with M3091 (CJL 1). We further characterized these mice by determining the cellular patterns of expression of the human transgene mRNA and identified expression in neurons of the striatum, SN pars compacta (SNpc) and SNpr as well as hippocampus and cingulate cortex (Fig 1B).
FIGURE 1.

Characterization of hLRRK2(R1441G) BAC transgenic mice. (A) Fluorescence In Situ Hybridization (FISH) of hLRRK2(R1441G) BAC transgenic mice. FISH was performed to determine the site of insertion of the human LRRK2 gene. Spleen cells from the offspring of the two breeder mice received from Dr. CJ Lee (named CJL1 and CJL2) were used. FISH images show that the human LRRK2 gene was inserted on a single mouse chromosome 1 in the two tested mice. (B) The localization of human LRRK2 mRNA in the brain of hLRRK2(R1441G) BAC transgenic mice was investigated by use of non-radioactive in situ hybridization with antisense riboucleotide probes specific to human LRRK2 mRNA. (A′) Upper row: Human LRRK2 mRNA localization at the level of striatum and cingulate cortex in the transgenic mice (hRG). The hLRRK2 mRNA was not detected in the non-transgenic litter mates (NT). Lower row: Higher magnification at the level of the striatum. Human LRRK2 mRNA was detected in neurons in the (hRG) but not in the NT. (B′) Upper row: Human LRRK2 mRNA was detected in the substantia nigra pars compacta (SNC) and in the substantia nigra pars lateralis (SNL) in the hRG but not in the NT. Expression was also observed in the SN reticulata. Lower row: Higher magnification of the SNL and SNC in the hRG mice. (C′) Human LRRK2 mRNA was also detected in the hippocampus (HIP) (left panel) and in the cingulate cortex (CgC) (right panel) of hRG. CA1, area CA1 of the hippocampus; DG, dentate gyrus. (C) Appearance of immobility behavior in the hLRRK2(R1441G) transgenic mice and their non-transgenic litter mates. Animals were tested for this behavior from the age of 6 to 14 months over a period of 2 years. The occurrence of immobility behavior on two separate observations at two or more weeks apart was scored as an occurrence of the behavioral phenotype and plotted as a Kaplan-Meier Survival Analysis. The first observation of immobility behavior occurred at the age of 10 months for the transgenic mice (HRG) and 12 months for their non-transgenic litter mates (NT). At the time of the final observation at 14 months the divergence of the two curves was significant (p = 0.002), By 14 months, 41% of HRG and 9% of the NT had shown the immobility behavior. (D) Western analysis of human LRRK2 expression in hLRRK2(R1441G) mice from our colony and hLRRK2(R1441G) mice from Jackson Laboratory (kindly provided by Dr. William Dauer). (A′) A Western blot containing brain lysates from transgenic (RG) and non-transgenic (NT) mice from our colony at Columbia University Medical Center (CUMC) (left panel) and from Jackson Lab (JAX) (right panel) was probed to detect both the human and murine forms of LRRK2. In the CUMC mice three transgenic mice (all studied within one year of arrival at our facility, RG1) show a band for the transgenic human form of LRRK2 (hLRRK2) just below the band for the endogenous murine form (mLRRK2). The hLRRK2 band is not detected in the non-transgenic (NT) littermate control. In the JAX mice a single transgenic mouse (RG) shows the band for the transgenic human form of LRRK2 (hLRRK2), whereas two non-transgenic mice do not. NS represents a non-specific band. (B′) Levels of hLRRK2 are compared between four CUMC transgenic mice (three studied within one year of arrival (RG1) and one after one year (RG)) and three JAX transgenic mice. Two JAX non-transgenic controls (NT) do not show the hLRRK2 band. Three of the CUMC mice show higher density hLRRK2 bands than the JAX mice.
While the primary purpose of this study was to identify the early anatomical features of the hLRRK2(R1441G) BAC transgenic phenotype, in the course of breeding these mice we did observe the immobility phenotype as originally described (Li et al., 2009). Immobility occurred as early as 10 months in the transgenics, but in most cases, it occurred by 12 months (Fig 1C). Notably, immobility did not occur in all transgenic mice; we observed it in only 40% of 29 mice examined. On the other hand, we also observed the behavior occasionally in the non-transgenic animals; about 10% of 35 animals displayed it. In the course of this study we became aware that many of our colleagues who had obtained this line through Jackson Labs were not observing the immobility behavior (Dr. William Dauer, personal communication). To try to gain some insight into the reasons for this difference in behavioral manifestations between mice obtained directly from the Weill-Cornell colony, such as our own, and those distributed through Jackson Labs, we obtained brain tissue from Jackson Labs mice (a kind gift from Dr. Dauer) and compared the expression of transgene protein in brain directly to that of Weill-Cornell mice (Fig 1D). We found that Jackson mice expressed less transgenic protein in brain (Fig 1D).
Assessment of the SN and nigrostriatal projection by light microscopy
In the original characterization of the mature hLRRK2(R1441G) BAC transgenic mice no abnormalities were observed in the number of dopaminergic neuron cell bodies in the SNpc, but a diminished number of the dopaminergic dendrites that emanate from these neurons and project ventrally into the SNpr was identified. These dendrites are known to arise from dopamine neurons of the ventral tier of the SNpc (Gerfen et al., 1987b). This ventral tier group is of interest because it is especially vulnerable to dopaminergic neurotoxins (Fitzpatrick et al., 2005), and to the pathology of PD as well (Gibb and Lees, 1991). We therefore examined in young hLRRK2(R1441G) BAC transgenic mice not only the total population of dopamine neurons in the SNpc by TH immunostaining, but also the distinct populations of the dorsal and ventral tiers, identified by CBN (Gerfen et al., 1987a) and AHD2 (McCaffery and Drager, 1994) immunostaining, respectively. These studies revealed no abnormalities in the number or distribution of the total population of dopamine neurons of the SN, demonstrated by TH immunostaining, or of the CBN- or AHD2-positive subpopulations (Fig 2A, C). In addition, we assessed the dendrites that project into the SNpr by both TH and AHD2 staining and found no abnormality in either their morphology or number (Fig 2B, C). This observation indicates that the loss of dendrites in the SNpr previously observed in the mature mice (Li et al., 2009) is a late-appearing feature of the phenotype. In keeping with the presence of intact populations of neuronal subtypes in the SNpc, we found no abnormalities in their striatal axonal projections, assessed at the regional level (Fig 2D). CBN immunostaining of the striatum demonstrates not only positive fibers projecting from the SN, but also intrinsic striatal neurons and their fibers. This staining identifies striatal striosomes as patches of diminished CBN expression (Gerfen et al., 1987a) and it demonstrated that there was no abnormality in the number, appearance or distribution of striosomes in the hLRRK2(R1441G) BAC transgenic mice (Fig 2D). Staining for AHD2 in the striatum revealed a previously described gradient of increasing fiber density from ventro-medial to the dorso-lateral quadrant (McCaffery and Drager, 1994) (Fig 2D). This gradient appeared normal in the hLRRK2(R1441G) BAC transgenic mice.
FIGURE 2.

Normal anatomical organization of the dopaminergic nigrostriatal system in hLRRK2(R1441G) BAC transgenic mice examined by tyrosine hydroxylase (TH), calbindin (CB) and aldehyde dehydrogenase (AHD2) immunostaining of the ventral mesencephalon and striatum. (A) Representative micrographs of coronal sections show normal anatomical organization of TH-positive neuronal cell bodies and dendrites (A′ and B′) in the substantia nigra pars compacta (SNpc) and substantia nigra pars reticulata (SNpr) in transgenic mice (RG) and non-transgenic (NT) litter mate controls. A normal pattern of CB immunostaining (C′ and D′) in the dorsal tier (dt) of the SNpc and AHD2 immunostaining (E′ and F′) in the ventral tier (vt) are observed. (B) Representative micrographs showing a normal number and distribution of TH-positive (A′ and B′) and AHD2-positive (C′ and D′) dendrites in the SNpr (red arrowheads) in transgenic mice. (C) Stereological counts do not show a significant difference in the number of TH-positive neurons in the SN between RG and NT mice. Bars represent the mean ± SEM (n = 4 mice/genotype). Quantification of TH-positive dendrites in the SNpr also did not show a significant difference between RG and NT mice. (n = 4 mice/genotype). (D) At a regional level, there is no difference in the pattern of immunostaining for TH (A′ and B′), CB (C′ and D′) and AHD2 (E′ and F′) in the striatum. Striosomes are indicated by arrows in C′ and D′; there was no apparent difference in their number, appearance or distribution in the RG mice. The dorso-ventral gradient of immunostaining for AHD2 was also preserved (E′ and F′).
Although normal patterns of striatal TH-positive staining were originally described in mature hLRRK2(R1441G) BAC transgenic mice at the regional level, abnormalities in TH-positive axons were identified at the single fiber level (Li et al., 2009). To determine whether this aspect of the abnormal phenotype could be observed in young transgenic mice, we examined TH-positive axons in the MFB, with particular attention to the presence of axon spheroids, swellings that are generally considered to indicate the presence of axon injury (Beirowski et al., 2010). Unexpectedly, we observed axonal spheroids in TH-positive axons of the MFB not only in transgenic mice, but also in their non-transgenic littermates and in normal, young adult C57BL/6 mice (Fig 3). There was no difference among the genotypes in the number of spheroids (Fig 3A), but we did identify a strain difference between C57BL/6 and FVB mice. While the area of the spheroids was normally distributed in the C57BL/6 mice, in the FVB mice, both transgenics and non-transgenics, the size distribution was bimodal due to the presence of a population of large spheroids (Fig 3B). In this respect, however, the non-transgenics and transgenics did not differ.
FIGURE 3.

Demonstration of a strain difference between C57BL/6 and FVB mice in the size distribution of axonal spheroids present in dopaminergic axons in the medial forebrain bundle (MFB). (A) There was no significant difference in the number of TH-positive axonal spheroids among the C57BL/6, FVB non-transgenic (NT) and FVB transgenic (RG) mice. Bars represent the mean ± SEM (n = 4 C57BL/6; n = 6 FVB NT; n = 6 FVB RG). (B) Analysis of the cross-sectional area of TH-positive axonal spheroids reveals that spheroid size in the C57BL/6 mice is normally distributed (Kolmogorov-Smirnov (KS) Normality Test p > 0.2). However, the sizes of spheroids in mice of the FVB strain, both NT and RG, were not normally distributed, and demonstrated a bimodal pattern due to populations of spheroids that were large, many of them greater than 4x the standard deviation (SD) above the mean for the C57BL/6 mice. In spite of the presence of these large spheroids, their number was not sufficient to result in a significant difference in spheroid size when the total populations of the three experimental groups were compared (C57BL/6: 13.5 ± 1.1 μm2 n = 10; FVB NT: 14.6 ± 1.8 μm2 n = 19; FVB RG: 12.9 ± 1.7 μm2 n = 13; p = 0.8, One Way ANOVA). (For illustrative purposes, the graph curves are best fits for data binned every 5.0 μm2. Normality tests, however were performed on non-binned, continuous data). (C) Representative micrographs of axonal spheroids in C57BL/6 mice (A′ and B′); arrowheads indicate the normal segment of the axon and the curved arrows indicate the axonal spheroid with vacuolated axoplasm. Examples of large axonal spheroids in NT mice (C′ and D′); arrowheads show the normal portion of the axon. Axonal spheroids in RG mice (E′ and F′) were frequently lobulated (straight arrows) and polymorphic; arrowheads in F′ show the normal segment of the axon.
Assessment of the SN and nigrostriatal projection by epifluorescent and confocal microscopy
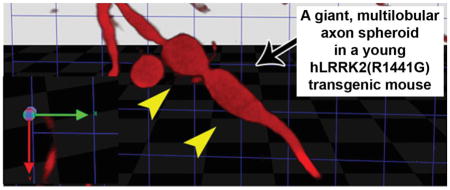
In the presence of injury or disease, axons may not express endogenous proteins that define their phenotype (Cheng et al., 2011; Wooten et al., 1978) and thus may not be identifiable by immunohistochemical staining. Therefore, if an analysis is based on immunostaining for endogenous proteins (such as TH) alone, the assessment may lead to a biased selection of axons in a subgroup that is healthier. We therefore undertook to analyze the three genotypes by using an anterograde tracer that is not subject to downregulation by injury. For this analysis we transfected SN neurons with AAV-Tau-tdTomato. Visualization of spheroids by this technique revealed that non-transgenic mice of both the C57BL/6 and FVB strains had small, simple spheroids that overlapped in their volume distribution (Fig 4A, B). Unique to the hLRRK2(R1441G) BAC transgenic mice were large (≥90 μm3) spheroids that were typically elongated and multi-lobular (Fig 4A, B). To better understand the cell biology of these “giant spheroids” we transfected SN neurons of hLRRK2(R1441G) BAC transgenic mice with AAV GFP-LC3, a fluorescent marker for autophagic vacuoles (AVs) (Kabeya et al., 2000; Mizushima, 2004), or AAV COX8-GFP, a marker for mitochondria (Misgeld et al., 2007). Both markers demonstrated punctate structures in giant spheroids of transgenic mice (Fig 5A, B). The use of AAV COX8-GFP also enabled us to quantify the number of mitochondria in transit in axons with giant spheroids as compared to adjacent normal axons. This analysis revealed that mitochondria were far less numerous in axons with giant spheroids as compared to normal axons without spheroids (Fig 5C).
FIGURE 4.

Assessment of spheroid volume and morphology by anterograde axonal labeling with AAV-Tau-tdTomato and confocal optical sectioning. (A) Spheroids labeled by Tau-tdTomato were optically sectioned in the Z-axis and then reconstructed digitally by use of Volocity software. The volume of the reconstructed spheroid was determined and each was rotated in the virtual space for optimal viewing. Axonal spheroids in the C57BL/6 (A′) and NT (B′) mice (black arrows) were simple ovoids in their morphology and similar in size. Unique to the RG mice were spheroids that were large, polymorphic and multi-lobular. Two representative spheroids are shown in two different rotational views; the left panel (C′ and E′) shows the frontal view (in the plane of the section face) of the spheroid (black arrows). The right panels (D′ and F′) show the same spheroids slightly rotated such that the right side of views C′ and D′ is moved towards the viewer (see axis arrows, lower left). The axonal spheroid in E′ is lobulated (yellow arrowheads). (B) Volume distributions of axonal spheroids observed in the C57BL/6, NT and RG mice. Only the RG mice showed ‘giant’ axonal spheroids which had a volume ≥4-fold larger than the standard deviation of the mean for the spheroids in the C57BL/6 mice. These “giant” spheroids in the RG mice had volumes ≥90 μm3.
FIGURE 5.

Cellular analysis of axonal spheroids of hLRRK2(R1441G) BAC transgenic mice in the medial forebrain bundle (MFB) injected with AAV-LC3-GFP, AAV-mCOX8-GFP and AAV-Tau-tdTomato. (A) Confocal images of LC3-GFP-positive (A′ and B′) axonal spheroids in the transgenic mice reveal LC3-GFP-positive puncta (arrows and arrows in inserts) representing autophagic vacuoles. Arrowheads in A′ and B′ indicate the axon connected to the axonal spheroid. (B) mCOX8-GFP positive puncta are also observed, indicating the presence of mitochondria. (C) Montage of micrographs acquired by conventional epifluorescence showing an axon with an axonal spheroid and two examples of adjacent axons without spheroids in the MFB of transgenic mice. The axon with the spheroid varied in its Z-axis position along its length, so the focal plane was adjusted to accommodate these changes and the multiple images were then ‘stitched’ together, as indicated by the green lines. Note the presence of mCOX8-GFP-positive puncta all along the adjacent axons (green arrows and inserts) while the axonal segment displaying a spheroid is devoid of mCOX8-GFP-positive puncta. Quantification of mCOX8-GFP positive puncta along axons is shown graphically; there were many more in adjacent axons without spheroids (Adjacent axons: 2.9 ± 0.8/100 μm axon length, n = 32; Axons with spheroids: 0.4 ± 0.4/100 μm axon length n = 5; p = 0.045, Mann-Whitney Rank Sum). (D) In mice 2 – 4 months of age, immunofluorescence staining for AT8 did not reveal the presence of abnormal phosphorylated tau in Tau-tdTomato-positive axonal spheroids as shown in this representative micrograph. Note the bizarre tortuosity of this spheroid-bearing axon in a hLRRK2(R1441G) BAC transgenic mouse.
We had previously shown in mature hLRRK2(R1441G) BAC transgenic mice that axonal spheroids could be immunolabeled with antibody AT8, which recognizes a phosphorylated tau epitope (Biernat et al., 1992). We therefore examined giant spheroids, identified by Tau-tdTomato, by immunostaining with AT8 in young mice. We found that the giant spheroids identified were negative for AT8 staining (Fig 5D), suggesting that the appearance of AT8-positivity is a late feature of the hLRRK2(R1441G) BAC transgenic axonopathy phenotype.
Assessment of the SN and nigrostriatal projection by transmission electron microscopy
To further characterize the subcellular features of axonal spheroids we performed transmission electron microscopy. In non-transgenic littermate control mice, small, simple ovoid spheroids were observed (Fig 6A), in keeping with the observations made at the light microscope level by brightfield and confocal microscopy. Similar ovoid spheroids were also observed in the transgenic mice (Fig 6A). However, in the transgenic mice, and only in these mice, giant spheroids were identified (Fig 6B). Their most distinguishing feature was that they were packed with AVs and multilamellar bodies (Fig 6B). Lysosomes were not observed. Ultrastructural analysis revealed other axonal abnormalities in addition to spheroids. Even in the absence of spheroids, AVs were observed in axons within the MFB in the transgenic mice (Fig 7A). In addition to AVs other abnormalities were observed, including enlargement of the periaxonal space (Fig 7B) and intra-axonal invagination of myelin (Fig 7B) as described in other forms of axonal injury (Anthes et al., 1995).
FIGURE 6.

Transmission electron microscopic analysis of axonal spheroids in the medial forebrain bundle (MFB) in the hLRRK2(R1441G) BAC transgenic mice and non-transgenic litter-mate controls. (A) A representative electron micrograph (A′) shows the normal ultrastructure of axons (A) in the MFB in non-transgenic mice (NT). In B′ and C′ examples are shown of small axonal spheroids (AS) such as were occasionally observed in thinly myelinated axons in the NT mice. Thus ultrastructural analysis confirms the simple, oval morphology observed by TH immunohistochemistry (Figure 2C) and by Tau-tdTomato anterograde labeling (Figure 3A). Note that the cytoskeleton of the normal portion of the axon (black arrowheads) becomes disrupted as it enters the spheroid. A similar type of simple spheroid morphology with disruption of cytoskeleton was observed in the hLRRK2(R1441G) BAC transgenic mice (RG) (D′ and E′). The RG mice also demonstrated another type of spheroid which was relatively devoid of cellular organelles and cytoskeletal elements, leaving large, clear electron-lucent swellings (F′ and G′). (B) Unique to the RG mice were giant spheroids that contained large numbers of autophagic vacuoles. In A′ a thinly myelinated axon (arrowheads) with well-organized cytoskeletal elements leads into a large spheroid that lacks myelin, contains disorganized cytoskeletal structures and is packed with autophagic vacuoles. The region in the white box is shown at higher magnification in B′. Numerous vacuoles with double membranes, characteristic of autophagic vacuoles (AV), are observed. Interspersed among them are numerous multilamellar bodies (MLB), frequently described in association with classic autophagic vacuoles (Hariri et al., 2000; Hornung et al., 1989; Nixon et al., 2005). In C′ an unmyelinated large spheroid (delineated by arrows) is also packed with numerous autophagic vacuoles. The region in the white box is shown at higher magnification in D′. A, axon; AS, axonal spheroid. Arrowheads always indicate the intact portion of the axon containing the axonal spheroids.
FIGURE 7.

Axonal pathology was also observed in non-spheroidal structures of the axons in the medial forebrain bundle in the hLRRK2(R1441G) BAC transgenic mice. (A) In A′ a myelinated axon shows accumulation of autophagic vacuoles (arrows) in the space created between myelin sheaths. B′: Cross section of a neurite showing multiple autophagic vacuoles (arrows) and normal mitochondria (arrowheads). (B) In A′ a myelinated axon shows an increase in the periaxonal space with a large gap between the axolemma (asterisk) and the myelin sheath. Invaginations of myelin as well as islands of myelin are indicated by arrowheads in A′ and B′:
Axonal pathology may either precede pathology at the level of the neuron soma or occur subsequent to it, as a secondary event. To determine which was the case in the transgenic mice, we examined dopaminergic neurons of the SN by electron microscopy. No abnormalities of subcellular features were identified in the hLRRK2(R1441G) BAC transgenic mice (Fig 8).
FIGURE 8.

Transmission electron microscopic analysis of the substantia nigra in hLRRK2(R1441G) BAC transgenic mice (RG) and their non-transgenic litter mates (NT). TH-positive dopaminergic neuronal cell bodies in the SNpc, identified by electron dense deposits of immunogold-silver labeling for TH, showed a normal ultrastructure in both the NT (A′) and RG (B′) mice. Note that the neuron of the RG mouse is shown at higher magnification, and has normal endoplasmic reticulum (ER), Golgi apparatus (G), mitochondria (M) and nucleus (N). TH-positive dendrites (dendrite: D) in the SNpr of RG mice also appeared normal (C′).
Functional assessment of retrograde axonal transport by the nigrostriatal projection
We sought to determine whether these morphologic abnormalities of axons were associated with a functional disturbance of retrograde axonal transport in vivo. For this analysis, we examined the number of neurons in transgenics that were retrogradely labeled with FG at 6 hours following intra-striatal injection. We validated the use of FG for this purpose by determining that this technique could detect alterations in neuron number and retrograde transport following injections of 6OHDA (intra-striatal) (Fig 9B) and colchicine (into the MFB) (Fig 9C), respectively. No abnormalities of the retrograde transport of FG were detected in transgenic mice either 2–4 or 12 months of age (Fig 9D, E).
FIGURE 9.

Analysis of retrograde transport of Fluorogold (FG) by nigrostriatal axons in hLRRK2(R1441G) BAC transgenic mice. (A) The time course of retrograde transport of FG, and the maximum number of labeled axons, was assessed in FVB mice. The maximum number of FG labeled neurons was about 4200 (shown as the red dotted line), determined as the mean number of labeled neurons on post-injection days 1, 2, 3 and 10. Maximal labeling was achieved at 1 day post-injection. At 6 hours post-injection 75% of the maximum number of neurons were labeled. Fewer neurons were retrogradely labeled in the C67Bl strain (3003 ± 77 (SEM)). The ability of FG retrograde labeling to detect changes in the number of neurons in the SNpc, and the rate of retrograde transport by their axons, was assessed by treatment with 6OHDA (B) and colchicine (C), respectively. For the 6OHDA experiment, mice were injected into the striatum with 6OHDA, then with FG at 7 days post-lesion, and then sacrificed at 6 hours post FG injection. As predicted, the lesion resulted in a significant decrease in the number of FG-labeled neurons in the SNpc (Vehicle: 3197 ± 508; 6OHDA: 975 ± 171; p = 0.006). For the colchicine experiment, mice were injected into the medial forebrain bundle with colchicine, then with FG 24 hours later, and then sacrificed at 6 hours post FG injection. Disruption of retrograde axonal transport with colchicine resulted in a significant decrease in the number of FG-labeled neurons in the SNpc (Vehicle: 3732 ± 127; Colchicine: 52 ± 21; p = 0.001). Assessment of retrograde transport of FG in both young (2–4 month) (D) and aged (12 month) (E) hLRRK2(R1441G) BAC transgenic mice (RG) revealed no difference in the number of labeled neurons in the SN in comparison to non-transgenic littermate controls (NT).
Discussion
As part of overall characterization of these mice, preliminary to the performance of anatomical studies, we investigated several aspects of this line. We determined that the human transgene is inserted in one location, on chromosome 1. In addition, we demonstrated that that the human transgene is expressed in the SNpc. In this respect, its expression is more like that reported for human (Higashi et al., 2007a) than mouse (Higashi et al., 2007b; Melrose et al., 2007), as would be expected for a BAC transgene. We also confirmed the appearance of an immobility behavior as originally described (Li et al., 2009). We do not know the reason why investigators who have obtained this line from Jackson Labs do not observe the behavioral phenotype. Our colleague, Dr. Dauer, who did not observe the immobility behavior, performed FISH on the Jackson line and it was identical to what we observed: a single insertion on chromosome 1. The source of the mice for maintenance on the FVB background may be important. Li et al (Li et al., 2009) originally used FVB mice from Taconic; we used FVBs from Charles River; Dr. Dauer used FVBs from Jackson Labs. We directly compared by Western analysis the level of human transgenic LRRK2 in forebrains obtained from our mice to those that had been provided by Jackson Labs (courtesy of Dr. Dauer) and protein levels in our mice were greater. This difference in the level of protein expression may be relevant to the lack of a behavioral phenotype in the Jackson mice. Resolution of this issue will require further investigations that are beyond the scope of our purposes here.
In the initial description of the hLRRK2(R1441G) BAC transgenic mice a morphologic phenotype was identified at later ages. Although no abnormalities in the number of SN dopamine neurons or in the regional density of striatal TH immunostaining were observed (Li et al., 2009), at the single fiber level, two morphologic abnormalities of the SN dopaminergic system were identified. There was a reduction in the number of TH-positive dendrites in the SNpr, and the appearance of TH-positive and AT8-positive axonal spheroids and dystrophic neurites.
In the 2 – 4 month old mice investigated here we confirmed the presence of an axonopathy in the hLRRK2(R1441G) BAC transgenics based on the identification of giant, polymorphic axonal spheroids uniquely in these animals. Unlike the mature mice, this axonopathy was not revealed by TH immunostaining, but rather by the use of an anterograde axon tracing technique that is not dependent on expression of endogenous proteins. The reason for this difference between young and mature mice in this regard is unknown. Diminished expression following injury of endogenous axonal proteins that mediate neurotransmission functions is considered to be an adaptive response, permitting the neuron to devote its resources to recovery (Wooten et al., 1978). It is possible that in aged mice the capacity to achieve this protective response is impaired and TH expression persists.
The appearance of axonal spheroids is generally considered to be de facto evidence of axonal pathology, so we did not expect to observe them in normal adult C57BL/6 mice. However, small simple ovoid spheroids were observed in TH-immunostained axons in the MFB in these mice and they occurred in similar numbers in non-transgenic and transgenic mice of the FVB strain. The significance of these spheroids is unknown. It seems likely that the appearance of spheroids is a general occurrence in axonal populations, because they have been previously identified in normal mice and with increased frequency with age (Bridge et al., 2009)
In axons with giant, polymorphic spheroids we identified fewer mitochondria. This abnormality could be due to a defect at the level of the axon in mitochondrial transport, or at the level of the neuron soma in mitochondrial synthesis or trafficking. The significance of this observation is that the axonal arborizations of SN dopamine neurons are enormous (Matsuda et al., 2009), creating a tremendous demand for energy stores that must be met by axonally-directed mitochondria (Bolam and Pissadaki, 2012). Any compromise in the ability of an axon to transport mitochondria would therefore put the entire axonal system at risk. It is unknown whether this abnormality in mitochondrial axon trafficking is a primary disturbance in the hLRRK2(R1441G) BAC transgenic mice, or secondary to a more fundamental disturbance in axon function.
In addition to giant spheroids, we identified other evidence of an axonopathy in the hLRRK2(R1441G) BAC transgenic mice. We identified AVs in axons even in the absence of spheroid formation, and myelin invagination into axons, an abnormality that has previously been observed following axon injury (Anthes et al., 1995).
In the young mice, although these signs of axonopathy were observed, we identified no abnormality in dopaminergic dendrites in the SNpr, by either TH immunostaining or by ultrastructural analysis. We conclude that the loss of these dendrites, observed in the mature mice (Li et al., 2009), is a later feature of the phenotype. Our observations in the young mice indicate that the decreased number of dendrites observed in older animals is not due to a developmental abnormality, but is more likely to reflect a degenerative loss sometime between the ages examined here (2 – 4 months) and 9 – 10 months, the age studied in Li et al (Li et al., 2009).
This evidence that axonal pathology is the initial abnormality in the SN dopaminergic system in these transgenic mice leads us to suggest that the role of LRRK2 in the biology of axons may be of primary importance in the pathogenesis of PD. There is much evidence that LRRK2 plays a role in the development and maintenance of neurites, and axons in particular. MacLeod and colleagues first reported that several mutant forms of LRRK2 induced degeneration of neurites in primary cortical neuron cultures (MacLeod et al., 2006). In differentiated SH-SY5Y cells, Plowey and co-investigators observed that the G2019S mutant induced shortening of neurites in the presence of activation of autophagy (Plowey et al., 2008). In addition to a role in neurite maintenance, LRRK2 has also been shown to regulate neurite growth. Sepulveda and colleagues demonstrated that LRRK2(G2019S) diminished growth cone motility, whereas a LRRK2 null mutation augmented it (Sepulveda et al., 2013). The mechanisms underlying these effects are not fully known, but LRRK2 regulation of the ezrin, radixin and moesin (ERM) proteins may play a role. These proteins are highly expressed in growth cones and regulate their growth dynamics (Paglini et al., 1998). Moesin was identified as a target for phosphorylation by LRRK2 in a kinase substrate screen (Jaleel et al., 2007). Ezrin and radixin were then identified as LRRK2 substrates as well. The physiologic role of LRRK2 in the phosphorylation of ERM proteins has been questioned based on the lack of an effect of LRRK2 inhibitors on basal levels of ERM protein phosphorylation in overexpression experiments in HEK293 cells (Nichols et al., 2009). Nevertheless, the possible physiological relevance is supported by the observation that the number of growth cone filopodia expressing the phosphorylated ERM proteins is reduced in hippocampal cultures derived from LRRK2 null mice (Parisiadou et al., 2009).
In view of the prominent appearance of AVs in giant spheroids, the question arises whether an abnormality in LRRK2 regulation of autophagy may be the primary cause of the axonopathy, or, alternatively, whether another more fundamental abnormality is the cause. The possibility that activation of autophagy may be a primary mediator of axonal destruction is made plausible by our observations that in both neurotoxin- and axotomy-induced retrograde axonal degeneration in the nigrostriatal dopaminergic projection in vivo, abrogation of autophagy by regionally selective knock-out of the critical mediator Atg7 results in a robust and persistent protection from axonal degeneration (Cheng et al., 2011). Yang and colleagues have likewise shown that inhibition of autophagy by either pharmacologic or shRNA-based knock-down of either Atg7 or beclin1 protects axons from degeneration (Yang et al., 2007). The possible disease relevance of the appearance of AVs in the axons of hLRRK2(R1441G) BAC transgenic mice is supported by the observations of Ramonet and colleagues who also observed autophagy in their transgenic mice expressing hLRRK2(G2019S) (Ramonet et al., 2011).
In keeping with the hypothesis that the LRRK2(R144G) mutant may mediate an axonopathy through a disturbance in autophagy, there is a great deal of evidence that LRRK2 plays a primary role in its regulation. LRRK2 has been localized to the membranes of AVs and multivesicular bodies in human cells by electron microscopy (Alegre-Abarrategui et al., 2009). Immunologic stimulation of mononuclear cells induces phosphorylation of LRRK2 and its association with AV membranes (Schapansky et al., 2014). Functionally, knock down of wildtype LRRK2 suppresses starvation-induced upregulation of autophagy in human cells (Alegre-Abarrategui et al., 2009). Mutant forms of LRRK2 have been reported to induce autophagy in a variety of contexts, including the R1441C mutation in human cells (Alegre-Abarrategui et al., 2009), and the G2019S mutation in SH-SY5Y cells (Plowey et al., 2008), HEK293 cells (Gomez-Suaga et al., 2012) and human fibroblasts (Bravo-San Pedro et al., 2013).
Evidence for early involvement of axons and their terminals has been reported for other genetic models of PD. In a model of synucleinopathy produced in rats by transduction of SN neurons with an AAV6 vector to induce expression of human wildtype synuclein, Lundblad and colleagues demonstrate diminished dopamine reuptake as early as 10 days post-injection (Lundblad et al., 2012), at which time they observe striatal axonal pathology (Decressac et al., 2012). In this model significant TH-positive or vesicular monoamine transporter 2-positive SN neuronal loss does not occur until 3 weeks (Decressac et al., 2012). In a BAC transgenic model produced in rats to express wildtype human synuclein Nuber et al first observed synuclein-positive axon spheroids in the striatum at 3 months of age (Nuber et al., 2013), and by 12 months, striatal dopamine levels were reduced by 70%. However, even by 18 months the extent of SN TH-positive neurons loss was only 40%.
The early involvement of axons in these genetic models of PD supports the concept that axons are involved early and predominantly in the disease as well. This concept has been based on imaging and postmortem studies that have estimated the involvement of either the number of SN dopamine neurons or striatal dopaminergic terminal markers at the time of disease onset (reviewed by Cheng et al (Cheng et al., 2010)). Kordower and colleagues examined both striatal terminal markers and SN neuron numbers in the same brains (Kordower et al., 2013). Strikingly, dopaminergic markers in the putamen were lost rapidly and virtually eliminated by 4 years after diagnosis, whereas the loss of melanized SN neurons lagged behind.
The concept that axons are involved early in PD has therapeutic implications, for both neuroprotective and restorative approaches. In devising a neuroprotective approach, the best strategy is to target the earliest features of the disease, so as to prevent as much progression and as many secondary consequences as possible. Therefore, in PD, an ideal strategy would be to target axon degeneration. The fact that a substantial number of SN dopamine neurons are still surviving at the time of PD diagnosis would suggest that initial restoration therapy does not require cell replacement, but rather on the reconstitution of the nigrostriatal projection. While it has been long believed that the adult mammalian central nervous system is incapable of long-range axon re-growth, recent observations have shown that re-growth can be achieved in the nigrostriatal projection. AAV-mediated transduction of SN dopamine neurons with constitutively active forms of the kinase Akt or the GTPase Rheb, both of which stimulate mTor activity, induces long-range growth that reaches striatal target and restores function (Kim et al., 2011; Kim et al., 2012). Thus the concept that axons are involved early in PD is ‘good news’ because it suggests that there are new opportunities for neuroprotection and restoration.
HIGHLIGHTS.
Mutations in LRRK2 are the most common genetic cause of Parkinson’s disease (PD).
Aged hLRRK2(RG) transgenics develop dopaminergic morphologic abnormalities of PD.
We find in young mice that the first abnormality is a nigrostriatal axonopathy.
The axonopathy is characterized by giant spheroids packed with autophagic vacuoles.
These observations add to the growing evidence that axons are involved early in PD.
Acknowledgments
This work was supported by NIH NINDS 1P50NS38370 Udall Center of Excellence for Research on Parkinson’s Disease. The BAC hLRRK2(R1441G) mice were generously made available to us by Dr CJ Li.
Abbreviations
- AHD2
aldehyde dehydrogenase 1A1
- AV
autophagic vacuole
- BAC
bacterial artificial chromosome
- CBN
Calbindin
- LRRK2
leucine-rich repeat kinase 2
- ERM
ezrin, radixin and moesin proteins
- FISH
fluorescence in situ hybridization
- FG
Fluorogold
- PB
phosphate buffer
- PBS
phosphate buffered saline
- PD
Parkinson disease
- MFB
medial forebrain bundle
- MT
medial terminal nucleus
- SN
substantia nigra
- SNpc
SN pars compacta
- SNpr
SN pars reticulata
- TH
tyrosine hydroxylase
Footnotes
Publisher's Disclaimer: This is a PDF file of an unedited manuscript that has been accepted for publication. As a service to our customers we are providing this early version of the manuscript. The manuscript will undergo copyediting, typesetting, and review of the resulting proof before it is published in its final citable form. Please note that during the production process errors may be discovered which could affect the content, and all legal disclaimers that apply to the journal pertain.
References
- Alegre-Abarrategui J, et al. LRRK2 regulates autophagic activity and localizes to specific membrane microdomains in a novel human genomic reporter cellular model. Hum Mol Gen. 2009;18:4022–34. doi: 10.1093/hmg/ddp346. [DOI] [PMC free article] [PubMed] [Google Scholar]
- Anthes DL, et al. Characterization of axonal ultrastructural pathology following experimental spinal cord compression injury. Brain Res. 1995;702:1–16. doi: 10.1016/0006-8993(95)01028-6. [DOI] [PubMed] [Google Scholar]
- Beirowski B, et al. Mechanisms of axonal spheroid formation in central nervous system Wallerian degeneration. J Neuropathol Exp Neurol. 2010;69:455–472. doi: 10.1097/NEN.0b013e3181da84db. [DOI] [PubMed] [Google Scholar]
- Biernat J, et al. The switch of tau protein to an Alzheimer-like state includes the phosphorylation of two serine-proline motifs upstream of the microtubule binding region. EMBO J. 1992;11:1593–1597. doi: 10.1002/j.1460-2075.1992.tb05204.x. [DOI] [PMC free article] [PubMed] [Google Scholar]
- Bolam JP, Pissadaki EK. Living on the edge with too many mouths to feed: why dopamine neurons die. Mov Disord. 2012;27:1478–83. doi: 10.1002/mds.25135. [DOI] [PMC free article] [PubMed] [Google Scholar]
- Bravo-San Pedro JM, et al. The LRRK2 G2019S mutant exacerbates basal autophagy through activation of the MEK/ERK pathway. Cell Mol Life Sci. 2013;70:121–36. doi: 10.1007/s00018-012-1061-y. [DOI] [PMC free article] [PubMed] [Google Scholar]
- Bridge KE, et al. Late onset distal axonal swelling in YFP-H transgenic mice. Neurobiol Aging. 2009;30:309–21. doi: 10.1016/j.neurobiolaging.2007.06.002. [DOI] [PubMed] [Google Scholar]
- Burke RE, et al. Acute and persistent suppression of preproenkephalin mRNA expression in the striatum following developmental hypoxic-ischemic injury. J Neurochem. 1994;62:1878–1886. doi: 10.1046/j.1471-4159.1994.62051878.x. [DOI] [PubMed] [Google Scholar]
- Cheng HC, et al. Akt suppresses retrograde degeneration of dopaminergic axons by inhibition of macroautophagy. J Neurosci. 2011;31:2125–2135. doi: 10.1523/JNEUROSCI.5519-10.2011. [DOI] [PMC free article] [PubMed] [Google Scholar]
- Cheng HC, et al. Clinical progression in Parkinson disease and the neurobiology of axons. Ann Neurol. 2010;67:715–725. doi: 10.1002/ana.21995. [DOI] [PMC free article] [PubMed] [Google Scholar]
- Decressac M, et al. Progressive neurodegenerative and behavioural changes induced by AAV-mediated overexpression of alpha-synuclein in midbrain dopamine neurons. Neurobiol Dis. 2012;45:939–53. doi: 10.1016/j.nbd.2011.12.013. [DOI] [PubMed] [Google Scholar]
- Fitzpatrick E, et al. Differential survival patterns among midbrain dopaminergic cells of MPTP-treated monkeys and 6OHDA-lesioned rats. Anat Embryol (Berl) 2005;210:101–23. doi: 10.1007/s00429-005-0003-y. [DOI] [PubMed] [Google Scholar]
- Gerfen CR, et al. The neostriatal mosaic: III. Biochemical and developmental dissociation of patch-matrix mesostriatal systems. J Neurosci. 1987a;7:3935–3944. doi: 10.1523/JNEUROSCI.07-12-03935.1987. [DOI] [PMC free article] [PubMed] [Google Scholar]
- Gerfen CR, et al. The neostriatal mosaic: II. Patch- and matrix-directed mesostriatal dopaminergic and non-dopaminergic systems. J Neurosci. 1987b;7:3915–3934. doi: 10.1523/JNEUROSCI.07-12-03915.1987. [DOI] [PMC free article] [PubMed] [Google Scholar]
- Gibb WR, Lees AJ. Anatomy, pigmentation, ventral and dorsal subpopulations of the substantia nigra, and differential cell death in Parkinson’s disease. J Neurol Neurosurg Psych. 1991;54:388–96. doi: 10.1136/jnnp.54.5.388. [DOI] [PMC free article] [PubMed] [Google Scholar]
- Gomez-Suaga P, et al. Leucine-rich repeat kinase 2 regulates autophagy through a calcium-dependent pathway involving NAADP. Hum Mol Gen. 2012;21:511–25. doi: 10.1093/hmg/ddr481. [DOI] [PMC free article] [PubMed] [Google Scholar]
- Greggio E, Cookson MR. Leucine-rich repeat kinase 2 mutations and Parkinson’s disease: three questions. ASN Neuro. 2009;1 doi: 10.1042/AN20090007. [DOI] [PMC free article] [PubMed] [Google Scholar]
- Hariri M, et al. Biogenesis of multilamellar bodies via autophagy. Mol Biol Cell. 2000;11:255–268. doi: 10.1091/mbc.11.1.255. [DOI] [PMC free article] [PubMed] [Google Scholar]
- Higashi S, et al. Localization of Parkinson’s disease-associated LRRK2 in normal and pathological human brain. Brain Res. 2007a;1155:208–19. doi: 10.1016/j.brainres.2007.04.034. [DOI] [PubMed] [Google Scholar]
- Higashi S, et al. Expression and localization of Parkinson’s disease-associated leucine-rich repeat kinase 2 in the mouse brain. J Neurochem. 2007b;100:368–81. doi: 10.1111/j.1471-4159.2006.04246.x. [DOI] [PubMed] [Google Scholar]
- Hornung JP, et al. Endocytosis and autophagy in dying neurons: An ultrastructural study in chick embryos. J Comp Neurol. 1989;283:425–437. doi: 10.1002/cne.902830310. [DOI] [PubMed] [Google Scholar]
- Jaleel M, et al. LRRK2 phosphorylates moesin at threonine-558: characterization of how Parkinson’s disease mutants affect kinase activity. Biochem J. 2007;405:307–317. doi: 10.1042/BJ20070209. [DOI] [PMC free article] [PubMed] [Google Scholar]
- Kabeya Y, et al. LC3, a mammalian homologue of yeast Apg8p, is localized in autophagosome membranes after processing. EMBO J. 2000;19:5720–5728. doi: 10.1093/emboj/19.21.5720. [DOI] [PMC free article] [PubMed] [Google Scholar]
- Kim SR, et al. Dopaminergic pathway reconstruction by Akt/Rheb-induced axon regeneration Ann. Neurol. 2011;70:110–120. doi: 10.1002/ana.22383. [DOI] [PMC free article] [PubMed] [Google Scholar]
- Kim SR, et al. AAV transduction of dopamine neurons with constitutively active Rheb protects from neurodegeneration and mediates axon regrowth. Mol Ther. 2012;20:275–286. doi: 10.1038/mt.2011.213. [DOI] [PMC free article] [PubMed] [Google Scholar]
- Kordower JH, et al. Disease duration and the integrity of the nigrostriatal system in Parkinson’s disease. Brain. 2013;136:2419–31. doi: 10.1093/brain/awt192. [DOI] [PMC free article] [PubMed] [Google Scholar]
- Lee S, et al. LRRK2 kinase regulates synaptic morphology through distinct substrates at the presynaptic and postsynaptic compartments of the Drosophila neuromuscular junction. J Neurosci. 2010;30:16959–69. doi: 10.1523/JNEUROSCI.1807-10.2010. [DOI] [PMC free article] [PubMed] [Google Scholar]
- Li Y, et al. Mutant LRRK2(R1441G) BAC transgenic mice recapitulate cardinal features of Parkinson’s disease. Nat Neurosci. 2009;12:826–828. doi: 10.1038/nn.2349. [DOI] [PMC free article] [PubMed] [Google Scholar]
- Lin CH, et al. LRRK2 G2019S mutation induces dendrite degeneration through mislocalization and phosphorylation of tau by recruiting autoactivated GSK3. J Neurosci. 2010;30:13138–49. doi: 10.1523/JNEUROSCI.1737-10.2010. [DOI] [PMC free article] [PubMed] [Google Scholar]
- Lundblad M, et al. Impaired neurotransmission caused by overexpression of alpha-synuclein in nigral dopamine neurons. Proc Natl Acad Sci USA. 2012;109:3213–9. doi: 10.1073/pnas.1200575109. [DOI] [PMC free article] [PubMed] [Google Scholar]
- MacLeod D, et al. The familial Parkinsonism gene LRRK2 regulates neurite process morphology. Neuron. 2006;52:587–593. doi: 10.1016/j.neuron.2006.10.008. [DOI] [PubMed] [Google Scholar]
- Matsuda W, et al. Single nigrostriatal dopaminergic neurons form widely spread and highly dense axonal arborizations in the neostriatum. J Neurosci. 2009;29:444–453. doi: 10.1523/JNEUROSCI.4029-08.2009. [DOI] [PMC free article] [PubMed] [Google Scholar]
- McCaffery P, Drager UC. High levels of a retinoic acid-generating dehydrogenase in the meso-telencephalic dopamine system. Proc Natl Acad Sci USA. 1994;91:7772–7776. doi: 10.1073/pnas.91.16.7772. [DOI] [PMC free article] [PubMed] [Google Scholar]
- Melrose HL, et al. A comparative analysis of leucine-rich repeat kinase 2 (Lrrk2) expression in mouse brain and Lewy body disease. Neuroscience. 2007;147:1047–58. doi: 10.1016/j.neuroscience.2007.05.027. [DOI] [PubMed] [Google Scholar]
- Misgeld T, et al. Imaging axonal transport of mitochondria in vivo. Nat Methods. 2007;4:559–61. doi: 10.1038/nmeth1055. [DOI] [PubMed] [Google Scholar]
- Mizushima N. Methods for monitoring autophagy. Int J Biochem Cell Biol. 2004;36:2491–2502. doi: 10.1016/j.biocel.2004.02.005. [DOI] [PubMed] [Google Scholar]
- Nichols RJ, et al. Substrate specificity and inhibitors of LRRK2, a protein kinase mutated in Parkinson’s disease. Biochem J. 2009;424:47–60. doi: 10.1042/BJ20091035. [DOI] [PMC free article] [PubMed] [Google Scholar]
- Nixon RA, et al. Extensive involvement of autophagy in Alzheimer disease: an immuno-electron microscopy study. J Neuropathol Exp Neurol. 2005;64:113–122. doi: 10.1093/jnen/64.2.113. [DOI] [PubMed] [Google Scholar]
- Nuber S, et al. A progressive dopaminergic phenotype associated with neurotoxic conversion of alpha-synuclein in BAC-transgenic rats. Brain. 2013;136:412–32. doi: 10.1093/brain/aws358. [DOI] [PMC free article] [PubMed] [Google Scholar]
- Paglini G, et al. Suppression of radixin and moesin alters growth cone morphology, motility, and process formation in primary cultured neurons. J Cell Biol. 1998;143:443–455. doi: 10.1083/jcb.143.2.443. [DOI] [PMC free article] [PubMed] [Google Scholar]
- Paisan-Ruiz C, et al. Cloning of the gene containing mutations that cause PARK8-linked Parkinson’s disease. Neuron. 2004;44:595–600. doi: 10.1016/j.neuron.2004.10.023. [DOI] [PubMed] [Google Scholar]
- Parisiadou L, et al. Phosphorylation of ezrin/radixin/moesin proteins by LRRK2 promotes the rearrangement of actin cytoskeleton in neuronal morphogenesis. J Neurosci. 2009;29:13971–13980. doi: 10.1523/JNEUROSCI.3799-09.2009. [DOI] [PMC free article] [PubMed] [Google Scholar]
- Plowey ED, et al. Role of autophagy in G2019S-LRRK2-associated neurite shortening in differentiated SH-SY5Y cells. J Neurochem. 2008;105:1048–1056. doi: 10.1111/j.1471-4159.2008.05217.x. [DOI] [PMC free article] [PubMed] [Google Scholar]
- Ramonet D, et al. Dopaminergic neuronal loss, reduced neurite complexity and autophagic abnormalities in transgenic mice expressing G2019S mutant LRRK2. PLoS One. 2011;6:e18568. doi: 10.1371/journal.pone.0018568. [DOI] [PMC free article] [PubMed] [Google Scholar]
- Sakaguchi-Nakashima A, et al. LRK-1, a C. elegans PARK8-related kinase, regulates axonal-dendritic polarity of SV proteins. Curr Biol. 2007;17:592–8. doi: 10.1016/j.cub.2007.01.074. [DOI] [PubMed] [Google Scholar]
- Schapansky J, et al. Membrane recruitment of endogenous LRRK2 precedes its potent regulation of autophagy. Hum Mol Gen. 2014;23:4201–14. doi: 10.1093/hmg/ddu138. [DOI] [PMC free article] [PubMed] [Google Scholar]
- Sepulveda B, et al. Short- and long-term effects of LRRK2 on axon and dendrite growth. PLoS One. 2013;8:e61986. doi: 10.1371/journal.pone.0061986. [DOI] [PMC free article] [PubMed] [Google Scholar]
- Wooten GF, et al. Immunochemical demonstration of reversible reduction in choline acetyltransferase concentration in rat hypoglossal nucleus after hypoglossal nerve transection. Nature. 1978;275:324–325. doi: 10.1038/275324a0. [DOI] [PubMed] [Google Scholar]
- Yang Y, et al. Induction of autophagy in neurite degeneration of mouse superior cervical ganglion neurons. Eur J Neurosci. 2007;26:2979–2988. doi: 10.1111/j.1460-9568.2007.05914.x. [DOI] [PubMed] [Google Scholar]
- Zimprich A, et al. Mutations in LRRK2 cause autosomal-dominant parkinsonism with pleomorphic pathology. Neuron. 2004;44:601–607. doi: 10.1016/j.neuron.2004.11.005. [DOI] [PubMed] [Google Scholar]