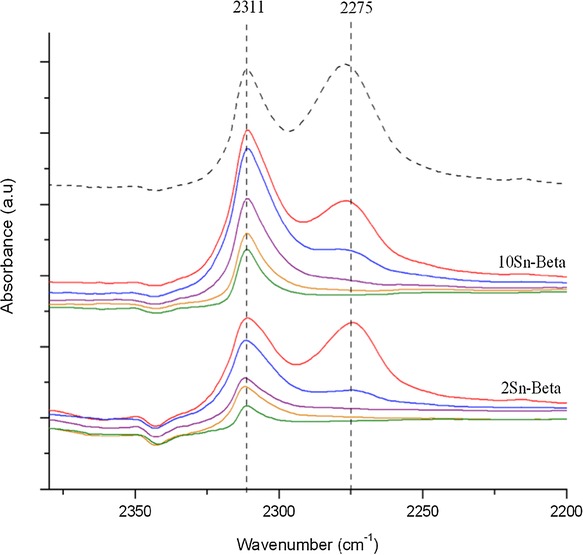
Figure 8.

In situ CD3CN desorption profile for 2 Sn-β (bottom) and 10 Sn-β (middle). CD3CN was desorbed under a dynamic vacuum at various temperature intervals, increasing from top to bottom, and all spectra are background-referenced against the dehydrated zeolite sample. A reference spectrum of physisorbed CD3CN/2Sn-β is provided (dashed line).
