

Abstract
Down syndrome (DS) arises from triplication of genes on human chromosome 21 and is associated with anomalies in brain development such as reduced production of neurons and increased generation of astrocytes. Here, we show that differentiation of cortical progenitor cells into astrocytes is promoted by DYRK1A, a Ser/Thr kinase encoded on human chromosome 21. In the Ts1Cje mouse model of DS, increased dosage of DYRK1A augments the propensity of progenitors to differentiate into astrocytes. This tendency is associated with enhanced astrogliogenesis in the developing neocortex. We also find that overexpression of DYRK1A upregulates the activity of the astrogliogenic transcription factor STAT in wild-type progenitors. Ts1Cje progenitors exhibit elevated STAT activity, and depletion of DYRK1A in these cells reverses the deregulation of STAT. In sum, our findings indicate that potentiation of the DYRK1A-STAT pathway in progenitors contributes to aberrant astrogliogenesis in DS.
Keywords: astrogliogenesis, Down syndrome, DYRK1A, neocortical progenitor, STAT
Introduction
Down syndrome (DS) occurs in approximately 1 in 700 live births 1 and is caused by trisomy for human chromosome 21. The disorder is characterized by abnormalities in neurological, skeletal, cardiovascular, and immunological systems 2–4. Particularly, individuals with DS commonly exhibit mental retardation 5. In DS neocortex and cerebellum, neuronal density and number are remarkably reduced 6,7, whereas abundance of astrocytes is increased 8,9. As these alterations are detected in prenatal and perinatal stages 10–12, the deficits associated with DS are likely the result of anomalies occurring during brain development.
During development of the mammalian neocortex, neural progenitor cells located in the ventricular zone (VZ) give rise to neurons and glia in a sequential manner. During early corticogenesis, neural progenitors expand their populations, and as development proceeds, they generate neurons. The neurogenic phase is followed by the gliogenic phase during which cortical progenitors give rise to glial progeny 13–19. The precise control of progenitor cell proliferation and differentiation is key in yielding the correct number of neurons and glia during corticogenesis. Accumulating evidence suggests that proliferation and differentiation of neural progenitors are deregulated in the DS brain. For example, the number of proliferating cells is reduced in the VZ of the lateral ventricle in DS 20,21. Neural progenitor cells derived from DS patients and DS-iPS cells give rise to less neurons but more astrocytes 22–24. Similar to abnormalities seen in the DS brain, mouse models of DS that are trisomic for large segments of mouse chromosome 16 orthologous to human chromosome 21 also show brain development defects and deregulation of neural progenitor proliferation/differentiation. Ts65Dn mouse model displays abnormal forebrain and cerebellar development with reduced number of neurons but increased number of astrocytes 24,25. Also, in the developing neocortex of Ts65Dn and Ts1Cje mouse models, reduced proliferation and neuronal differentiation of progenitors are observed 25,26. In addition, neurosphere cultures derived from embryonic brains of DS mouse models exhibit reduced proliferation and generate less neurons but more astrocytes 27,28. These studies suggest that proliferation and both neuronal and astroglial differentiation of DS progenitors are deregulated and that the deregulation of progenitor fate choices coordinately contributes to impaired neurogenesis and enhanced astrogliogenesis. In addition, astrocytes derived from DS-iPS cells suppress neuronal differentiation of progenitors as well as induce neuronal cell death 23. Thus, overproduction of astrocytes likely contributes to reduced number of neurons in DS brain. Nevertheless, the molecular basis underlying the deregulation of progenitor cell fate decisions, particularly enhanced production of astrocytes in DS, remains largely unknown.
DYRK1A (dual-specificity tyrosine-phosphorylated and regulated kinase 1A) is a proline-directed serine/threonine kinase encoded on human chromosome 21 and overexpressed in the fetal and adult DS brain 29. It plays a critical role in the development of the central nervous system 30–34. In Ts1Cje mice, increased dosage of DYRK1A causes impaired neuronal differentiation of progenitors during the neurogenic phase (E11–E13) 35. In this case, DYRK1A cooperates with DSCR1 (Down syndrome critical region 1, another human chromosome 21 gene overexpressed in DS) to suppress NFATc transcription factor and thereby neurogenesis 35. Besides its role in neuronal differentiation, increased dosage of DYRK1A has been reported to influence progenitor proliferation through control of cell cycle-related proteins 36,37. DYRK1A is thus closely associated with deregulation of progenitor fate determination in DS.
In this study, we find that increased dosage of DYRK1A contributes to elevated potential of Ts1Cje progenitors to differentiate into astrocytes and enhanced astrogliogenesis in the Ts1Cje neocortex. Further, we link the increased dosage of DYRK1A to dysregulation of STAT, a transcription factor critical for astrogliogenesis. Overexpression of DYRK1A in wild-type progenitors increases STAT3 phosphorylation at Ser727, a regulatory site that enhances STAT3 activity. In addition, the transcriptional activity of STAT is upregulated upon increased dosage of DYRK1A in progenitors. On the other hand, STAT3 Ser727 phosphorylation and STAT activity are elevated in Ts1Cje progenitors and reducing DYRK1A level attenuates the deregulation of STAT. In sum, our work identifies DYRK1A-STAT as a signaling pathway responsible for the differentiation of neural progenitors into astrocytes, with direct implication for the anomalies in brain development observed in DS.
Results
Enhanced astrocytic differentiation of Ts1Cje progenitors
Neurosphere cells derived from the Ts1Cje and Ts65Dn embryonic brains give rise to less neurons, but more astrocyte than those derived from euploid counterparts 27,28. This raises the possibility that not only impaired neuronal differentiation of progenitors but also increased potential of progenitor cells to differentiate into astrocytes may be involved in the observed phenotype. To test this hypothesis, we performed clonal analysis of neocortical progenitor cells to examine their astrogliogenic potential. GFP-expressing plasmid was introduced in embryonic day (E) 16 neocortices of Ts1Cje and their euploid littermates by in utero electroporation. GFP-introduced cortical cells were cultured in the presence of bFGF at a density that allows clear separation of cells and analysis of individual clones. The cellular composition of the GFP-labeled clones at 4 days in vitro (DIV) was then analyzed. Under these conditions, the vast majority (84.0%) of control euploid clones were nestin-positive, undifferentiated progenitor clones (Fig 1A and B). The remaining were composed of 6.8% of neuronal clones (Tuj1-positive neuron-containing clones without GFAP-positive astrocyte) and 12.4% of astroglial clones (GFAP-positive astrocyte-containing clones without Tuj1-positive cell) (Fig 1A and B). On the other hand, Ts1Cje progenitors gave rise to significantly more astroglial clones (27.0%) at the expense of progenitor clones (Fig 1A and B). Of note, mixed clones (clones containing both GFAP-positive and Tuj1-positive cells) were not observed under these conditions. Also, the average clone size of total clones was reduced in Ts1Cje cultures (5.3 ± 0.3 cells/clone in euploid versus 4.4 ± 0.2 cells/clone in Ts1Cje, P < 0.05 by a two-tailed Welch’s t-test), consistent with a previous study showing that Ts1Cje progenitors have deficits in proliferation 27. These observations excluded the possibility that higher number of astroglial clones generated from Ts1Cje progenitors is due to higher number of progenitor division cycles that could cause earlier appearance of neurons and thereafter astrocytes in individual clones 38. In addition, no GFP-labeled cells were found positive for cleaved caspase-3 in both conditions, thereby excluding apoptosis as an explanation for the observed phenotypes. Together, these results indicate that Ts1Cje neocortical progenitor cells have increased potential to differentiate into astrocytes.
Figure 1. Enhanced astrocytic differentiation of Ts1Cje progenitors.

- A, B The GFP-expressing plasmid was electroporated in E16 embryos of Ts1Cje and euploid littermates. Neocortical cell cultures were prepared immediately after electroporation. Representative images (A) of neocortical cells at DIV4 immunostained with antibodies against Tuj1 and GFAP. Percentage of each type of clones (neuronal, astroglial, and progenitor) is presented as mean ± SEM (n = 3–5 experiments) (B). ***P < 0.001 versus euploid by a two-tailed Student’s t-test. Scale bar, 50 μm.
- C, D Brain sections of P0 Ts1Cje and euploid littermates were immunostained with antibodies against GFAP (C) and S100β (D). Immunofluorescence intensities of GFAP and S100β in the VZ/SVZ of the neocortex were measured and plotted in the right panel (mean ± SEM, n = 3 brains). The mean values of the intensities of euploid mice were set to 1. *P < 0.05 versus euploid by a two-tailed Student’s t-test. Scale bars, 50 μm.
Having shown the higher tendency of Ts1Cje cortical progenitors to differentiate into astrocytes, we next asked whether increased astrogliogenesis takes place in the Ts1Cje neocortex. In the Ts1Cje neocortex at postnatal day (P) 0, we found a profound increase in GFAP and S100β immunoreactivities within the ventricular zone/subventricular zone (VZ/SVZ) when compared with those of the control euploid neocortices (Fig 1C and D). We also inspected the in vivo fate of progenitor cells in later stages of corticogenesis. For this, we labeled progenitor cells with GFP at E17 by in utero electroporation and examined their fate at P5 and P30. In P5 neocortices, a certain population of the GFP-labeled cells already migrated out from the VZ/SVZ and resided within the cortical plate (CP). Among the GFP-labeled cells in the CP, the vast majority (approx. 90%) was located at the upper part of the CP in control cortices (Fig 2A). On the other hand, in Ts1Cje cortices a sizable fraction of the GFP-labeled cells was found in the relatively lower part of the CP and displayed a bushy morphology that is reminiscent of mature astrocytes (Fig 2A). The bushy morphology of CP cells and their distribution in the lower part of the CP 39 raise the possibility that these GFP-labeled cells are astrocytes. Immunohistochemical analysis confirmed that a significantly larger fraction of the GFP-labeled cells in the CP of Ts1Cje mice was positive for GFAP and S100β, when compared to neocortices of euploid littermates (GFAP: 11.5 ± 2.2% in euploid versus 28.3 ± 5.1% in Ts1Cje; S100β: 10.4 ± 2.2% in euploid versus 22.6 ± 0.7% in Ts1Cje) (Fig 2B, C and E). In wild-type animals, most of the GFP-labeled cells in the CP were positive for Cux1, a marker for layer 2–4 neurons, whereas in the CP of Ts1Cje mice a significantly smaller fraction of GFP-labeled cells was positive for Cux1 (86.5 ± 2.0% in euploid versus 66.5 ± 2.2% in Ts1Cje) (Fig 2D and E). Similarly, in P30 neocortices of Ts1Cje mice, GFAP-positive populations of the total GFP-labeled cells were markedly increased (28.3 ± 2.2% in euploid versus 57.4 ± 3.1% in Ts1Cje, respectively). Conversely, a significant decrease in the proportion of cells positive for the neuronal marker NeuN was observed (67.9 ± 3.2% in euploid versus 39.2 ± 1.9% in Ts1Cje) (Fig 2F–I). Of note, no GFP-labeled cells were found positive for cleaved caspase-3 in both euploid and Ts1Cje neocortices. Also, less than 1% of GFP/GFAP-positive cells expressed the proliferation marker Ki67 (1 out of 105 cells and 1 out of 122 cells in euploid and Ts1Cje, respectively), suggesting that these astrocytes were not in the cycling state and that their increased abundance in the Ts1Cje neocortex is unlikely due to enhanced proliferation. Our results suggest increased astrogliogenesis, with a corresponding reduction in neurogenesis, at later stages of corticogenesis in Ts1Cje mice.
Figure 2. Enhanced astrogliogenesis in the Ts1Cje neocortex.

The GFP-expressing plasmid was electroporated in E17 embryos of Ts1Cje and euploid littermates, and brains were harvested at P5 (A–E) or P30 (F–I).
- Representative images of GFP-labeled cells throughout the entire cerebral wall in the brains of Ts1Cje (right) and euploid littermates (left).
- GFP-labeled cells in electroporated neocortices immunostained with anti-GFAP antibody. Shown are high-magnification images of the regions indicated by arrowheads (a–d) in (A).
- GFP-labeled cells in electroporated Ts1Cje neocortices immunostained with anti-S100β antibody.
- GFP-labeled cells in electroporated euploid neocortices immunostained with anti-Cux1 antibody.
- Quantification of the fraction of GFP-positive cells in the CP that were also positive for GFAP, S100β, and Cux1.
- Representative images of GFP-labeled cells throughout the entire cerebral wall in the brains of Ts1Cje (right) and euploid littermates (left).
- GFP-labeled cells in electroporated neocortices immunostained with anti-GFAP and anti-NeuN antibodies. Shown are high-magnification images of the regions indicated by arrowheads (a’–d’) in (F).
- GFP-labeled cells with bushy morphology in electroporated Ts1Cje neocortices immunostained with anti-S100β antibody.
- Quantification of the fraction of GFP-positive cells that were also positive for GFAP and NeuN.
Data information: Scale bars: 100 μm (A), 20 μm (B, C, D), 200 μm (F), or 50 μm (G, H). Data are presented as mean ± SEM (n = 3 brains for each group). *P < 0.05, **P < 0.01 versus euploid by a two-tailed Student’s t-test.
Overexpression of DYRK1A leads to enhanced astrocytic differentiation of progenitor cells
Dyrk1a that encodes for a proline-directed serine/threonine kinase lies within human chromosome 21 and is overexpressed in the fetal and adult DS brain 29. As assessed by immunohistochemistry, DYRK1A immunoreactivities were detected in neural progenitor cells and immature neurons of the embryonic neocortex, as well as mature neurons of the adult brain (Appendix Fig S1), consistent with previous studies 35,40. DYRK1A expression in astrocytes is also reported 41. We first examined a potential role of DYRK1A in astrocytic differentiation of progenitors. For this, we carried out clonal analysis of wild-type progenitors electroporated with DYRK1A. To our surprise, when DYRK1A was introduced into E16 progenitors, an increased percentage of astroglial clones, with a corresponding reduction in progenitor clones, was found when compared with that in control (Fig 3A and B). In contrast, expression of a kinase-dead form of DYRK1A (DYRK1A (KD)) had no effect on the proportion of astroglial clones (Fig 3A and B), indicating that kinase activity of DYRK1A is required for this phenotype. Of note, the average size of total clones was not significantly different between DYRK1A-overexpressing and control cultures (4.6 ± 0.3 cells/clone in control versus 4.4 ± 0.2 cells/clone in DYRK1A, P = 0.64 by a two-tailed Welch’s t-test). In both conditions, no GFP-labeled cells were found positive for cleaved caspase-3. We also assessed the levels of DYRK1A in electroporated cortical progenitors. For this, DIV2 neocortical cell cultures prepared from E16-electroporated neocortices were immunostained with antibodies against DYRK1A. DYRK1A immunofluorescence intensity in electroporated progenitors was ∼1.5-fold stronger than the intensity displayed by the endogenous protein (Fig EV1A and B). These results suggest that a modest increase in DYRK1A levels in progenitors is sufficient to promote their differentiation into astrocytes, at least partly in an instructive manner. To further link DYRK1A to differentiation of progenitors into astrocytes, we performed clonal analysis in the presence of CNTF (ciliary neutrotrophic factor) that induces astrocytic differentiation of progenitors through activation of JAK-STAT pathway. Even under astrogliogenic condition, overexpression of DYRK1A (WT), but not of DYRK1A (KD), resulted in a significant increase in the percentage of astroglial clones (Fig 3C). Thus, DYRK1A overexpression potentiates the astrogliogenic machinery of neural progenitors through JAK-STAT signaling.
Figure 3. Overexpression of DYRK1A results in enhanced astrocytic differentiation of cortical progenitors.

- A–C Plasmids expressing DYRK1A and GFP were electroporated in E16 embryos. Neocortical cell cultures were prepared immediately after electroporation. Shown are representative images of neocortical cells at DIV4 immunostained with antibodies against Tuj1 and GFAP (A). Percentage of each type of clones (neuronal, astroglial, and progenitor) is presented in (B) as mean ± SEM (n = 4 experiments). In (C), a similar experiment as in (A) was performed in the presence of CNTF. Neocortical cells were stimulated with CNTF at DIV3, and immunostained with antibodies against Tuj1 and GFAP at DIV5. Percentage of each type of clones (neuronal and astroglial) is presented as mean ± SEM (n = 4 experiments).
- D–G Plasmids expressing DYRK1A and GFP were electroporated in E17 embryos, and brains were harvested at P5. Representative images of GFP-labeled cells throughout the entire cerebral wall in the brains are shown in (D). (E) GFP-labeled cells in electroporated neocortices immunostained with anti-GFAP antibody. Shown are high-magnification images of the regions indicated by arrowheads (a–f) in (D). (F) GFP-labeled cells in electroporated control neocortices immunostained with anti-Cux1 antibody. (G) Quantification of the fraction of GFP-positive cells in the CP that were also positive for GFAP and Cux1. Data are presented as mean ± SEM (n = 3 brains for each group).
- H–K Plasmids expressing DYRK1A and GFP were electroporated in E17 embryos, and brains were harvested at P30. Representative images of GFP-labeled cells throughout the entire cerebral wall in brains are shown in (H). Dashed line outlines the ventricular surface. (I) GFP-labeled cells in electroporated neocortices immunostained with anti-GFAP and anti-NeuN antibodies. Shown are high-magnification images of the regions indicated by arrowheads (a’–f’) in (H). (J) GFP-labeled cells with bushy morphology in DYRK1A-electroporated neocortices immunostained with anti-S100β antibody. (K) Quantification of the fraction of GFP-positive cells that were also positive for GFAP, S100β, and NeuN. Data are presented as mean ± SEM (n = 3 brains for each group).
Data information: *P < 0.05, **P < 0.01, ***P < 0.001 by a two-tailed Student’s t-test. Scale bars: 50 μm (A, I, J), 100 μm (D), 20 μm (E, F), or 200 μm (H).
Figure EV1. Expression level of DYRK1A in cortical progenitors electroporated with the DYRK1A and DYRK1A shRNA-expressing plasmids.
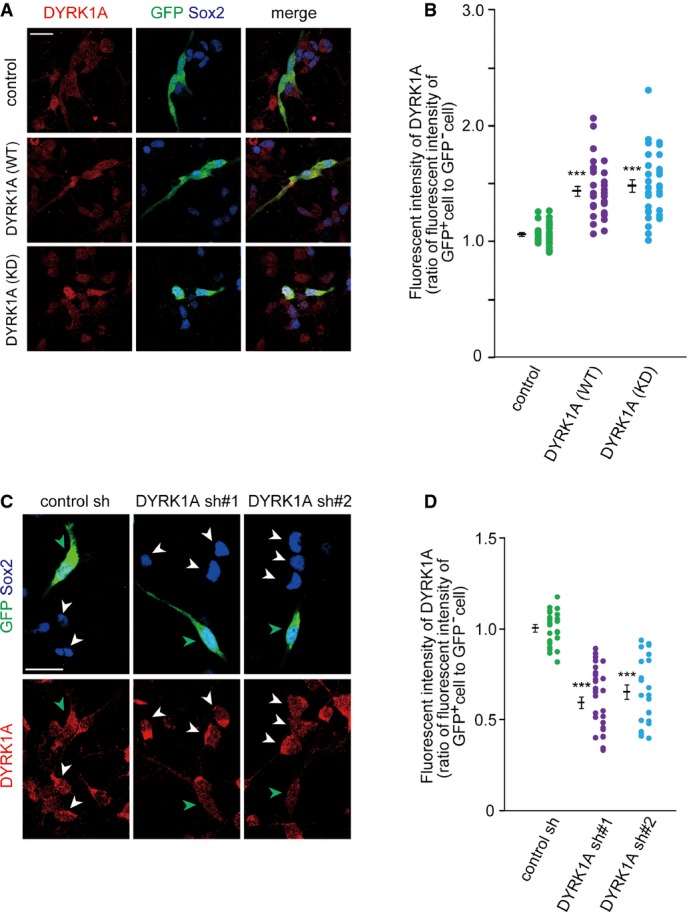
- A, B Plasmids expressing DYRK1A and GFP were electroporated in E16 wild-type embryos. Neocortical cell cultures were prepared immediately after electroporation, and the cells at DIV2 were immunostained with antibodies against GFP, DYRK1A, and Sox2. Representative images are shown (A). Immunofluorescence intensity of DYRK1A (B) in individual GFP-positive cells and that in nearby GFP-negative cells were measured, and the ratio of the intensity values is plotted.
- C, D Plasmids expressing shRNA against DYRK1A was electroporated, together with the GFP-expressing plasmid, in E16 Ts1Cje embryos. Neocortical cell cultures were prepared immediately after electroporation, and the cells at DIV2 were immunostained with antibodies against GFP, DYRK1A, and Sox2. Representative images are shown (C). Green and white arrowheads indicate GFP-positive and GFP-negative progenitors, respectively. Immunofluorescence intensity of DYRK1A (D) in individual GFP-positive cells and that in nearby GFP-negative cells were measured, and the ratio of the intensity values is plotted.
Data information: Data are obtained from two independent experiments. ***P < 0.001 by a two-tailed Welch’s t-test. Scale bars, 20 μm.
We next examined the in vivo effect of DYRK1A overexpression on astrogliogenesis. Plasmids encoding DYRK1A and GFP were co-electroporated into E17 neocortices. The pups were harvested at P5 and P30. At P5, among the GFP-labeled CP cells in DYRK1A-introduced neocortices, a sizable population of cells showed a bushy morphology and was positive for GFAP (Fig 3D, E and G). Conversely, a significant decrease in the proportion of Cux1-positive cells was observed in the same samples (Fig 3F and G). We did not observe any increase in the number of cleaved caspase-3-positive cells following DYRK1A electroporation. Also, in both control and DYRK1A-overexpressing neocortices, few GFAP-positive cells expressed Ki67 (3 out of 105 cells and 3 out of 136 cells in control and DYRK1A, respectively), suggesting that astrocyte proliferation was not promoted upon DYRK1A overexpression. At P30, significantly more GFP-labeled cells in the DYRK1A-introduced neocortices were positive for GFAP and S100β, and significantly less GFP-labeled cells were labeled for NeuN (Fig 3H–K). As expected, overexpression of DYRK1A (KD) had no significant effect on the proportion of GFP-labeled cells positive for GFAP, S100β, and NeuN (Fig 3H–K). Together, these results indicate that DYRK1A overexpression results in enhanced astrogliogenesis at the expense of neurogenesis in the perinatal neocortex.
Brains of DS patients and DS mouse models display enhanced astrogliosis 9,24 (see also Fig EV2D). To confirm that the increased proportion of GFP-labeled cells positive for GFAP in DYRK1A-introduced brains is not due to enhanced astrogliosis, we examined several hallmarks of reactive astrocytes such as upregulation of GFAP, alteration of astrocytic morphology, and activation of neighboring microglia. For this purpose, P30 neocortices electroporated at E17 were immunostained with antibodies against GFAP and MAC2 (a marker for activated microglial cells). We found that GFAP immunofluorescence intensity of GFP-labeled astrocytes in DYRK1A-introduced brains was similar to that of control astrocytes (Fig EV2A). Further, Sholl analysis 42 of GFAP-positive glial processes demonstrated that astrocytic morphology was not altered following DYRK1A overexpression (Fig EV2B). Also, almost no MAC2-positive cells were observed in both control and DYRK1A-overexpressed brains (Fig EV2C). Thus, the increased number of astrocytes in DYRK1A-overexpressing neocortices is not due to enhanced astrogliosis but rather augmented astrogliogenesis.
Figure EV2. Effects of DYRK1A on a reactive response in astrocytes.

- A–C Plasmids expressing DYRK1A and GFP were electroporated in E17 embryos, and brains were harvested at P30. Immunofluorescence intensity (A) of GFAP in individual GFP- and GFAP-positive cells was measured and plotted. Data are obtained from three brains. Sholl analysis (B) of GFAP-positive glial process of GFP- and GFAP-positive cells. Data are presented as mean ± SEM (n = 20 cells from 3 brains in each group). (C) Representative images of neocortices immunostained with antibodies against GFP and MAC2. Note that no MAC2-positive cells were observed in these neocortices. Scale bar, 200 μm.
- D Representative image of P30 Ts1Cje neocortex (without electroporation) immunostained with antibodies against MAC2. High-magnification images of the regions indicated by arrowheads (a, b) are shown to the right. Scale bars, 50 μm.
Knockdown of DYRK1A in Ts1Cje progenitors attenuates their differentiation into astrocytes
As described above, overexpression of DYRK1A in wild-type progenitors phenocopied the aberrant astrocytic differentiation of Ts1Cje progenitors. This raised the possibility that abnormal astrocytic differentiation of Ts1Cje progenitors may be caused by overexpression of DYRK1A. To test this possibility, we examined the effect of DYRK1A knockdown using DNA-based RNAi plasmids 35 on astrocytic differentiation of Ts1Cje progenitors. Consistent to our previous report, introduction of two different shRNA constructs significantly abolished the expression of the protein in Ts1Cje progenitors prepared from the E16 neocortex (Fig EV1C and D). Control and DYRK1A-depleted Ts1Cje neocortices were then subjected to clonal analysis. We found a significant decrease in astroglial clones following DYRK1A knockdown (Fig 4A and B). Furthermore, in P5 Ts1Cje neocortices electroporated with DYRK1A shRNA at E17, the GFAP- and S100β-positive fractions of GFP-labeled CP cells were significantly lower when compared to those in control shRNA-introduced neocortices (Fig 4C–F). On the other hand, co-electroporation of DYRK1A insensitive to DYRK1A shRNA#1 35 almost completely reversed the effect of DYRK1A shRNA#1 in both clonal analysis and in vivo experiments (Fig 4). Taken together, our data suggest that increased dosage of DYRK1A is responsible for the increased potential of Ts1Cje progenitors to differentiate into astrocytes and for the increased astrogliogenesis in the Ts1Cje neocortex.
Figure 4. Knockdown of DYRK1A results in decreased astrocytic differentiation of Ts1Cje progenitors.

- A, B Plasmids expressing GFP, DYRK1A shRNA, and shRNA-resistant DYRK1A (DYRK1A-res) as indicated were electroporated in E16 Ts1Cje embryos, and neocortical cell cultures were prepared immediately after electroporation. Shown are representative images of neocortical cells at DIV4 immunostained with antibodies against Tuj1 and GFAP. (B) Percentage of each type of clones (neuronal and astroglial) is presented as mean ± SEM (n = 3–6 experiments).
- C–F E17 Ts1Cje embryos were electroporated with the indicated plasmids, and the brains were harvested at P5. Representative images of GFP-labeled cells throughout the entire cerebral wall in the brains are shown in (C). (D) GFP-labeled cells in electroporated neocortices immunostained with anti-GFAP antibody. Shown are high-magnification images of the regions indicated by arrowheads (a–h) in (C). Quantification of the fraction of GFP-positive cells in the CP that were also positive for GFAP (E) and S100β (F).
Data information: Data are presented as mean ± SEM (n = 3–4 brains for each group, E and F). *P < 0.05, **P < 0.01 by a two-tailed Student’s t-test. Scale bars, 50 μm (A), 100 μm (C), or 20 μm (D).
Overexpression of DYRK1A enhances Ser727 phosphorylation of STAT3 and STAT transcriptional activity in progenitors
The JAK-STAT signaling pathway is crucial for the astrogliogenic differentiation machinery in neural progenitor cells 43–45. STAT3, a member of STAT family, is a major component of the pathway, and its activation promotes astrocytic differentiation of cortical progenitors 46. STAT3 transcriptional activity is regulated by phosphorylation of two key residues, Tyr705 and Ser727. Tyr705 phosphorylation, typically elicited by JAK, is involved in STAT3 dimerization and activation 47, while Ser727 phosphorylation enhances STAT3 activity 48. Consistent with previous data 49, we found that STAT3 as well as Ser727- and Tyr705-phosphorylated STAT3 is preferentially expressed in progenitor cells, with no detectable expression in neurons (Fig EV3). Noticeably, we found that Ser727 phosphorylation levels of STAT3, but not Tyr705, were significantly increased in the Ts1Cje neocortex at P0 when compared to that in the euploid littermate neocortex, as assessed by immunoblot analysis (Fig 5A and B). This observation suggests deregulation of STAT signaling in Ts1Cje progenitors.
Figure EV3. Expression of STAT3 and its phosphorylated forms in cultured progenitor cells.
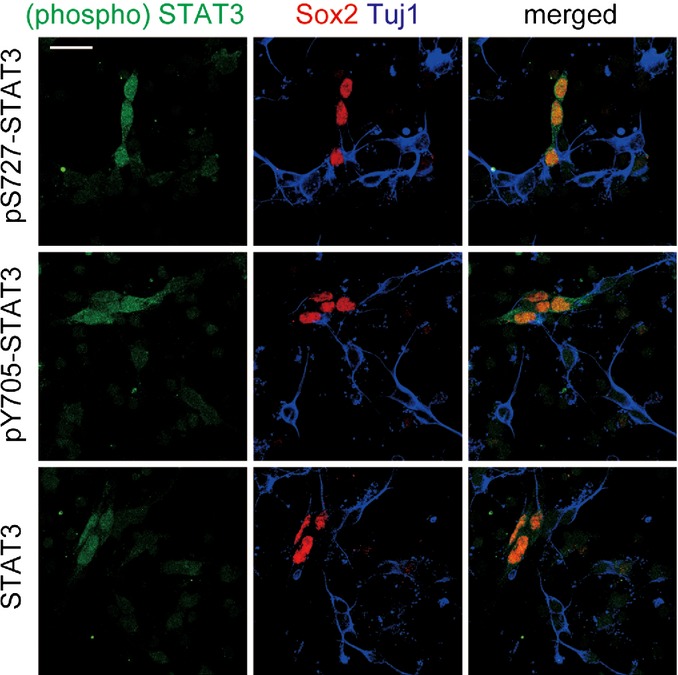
Neocortical cells prepared from E16 embryos were fixed at DIV1 and immunostained with antibodies against either STAT3 or its phosphorylated forms, Sox2 and Tuj1. Representative images are shown. Scale bar, 20 μm.
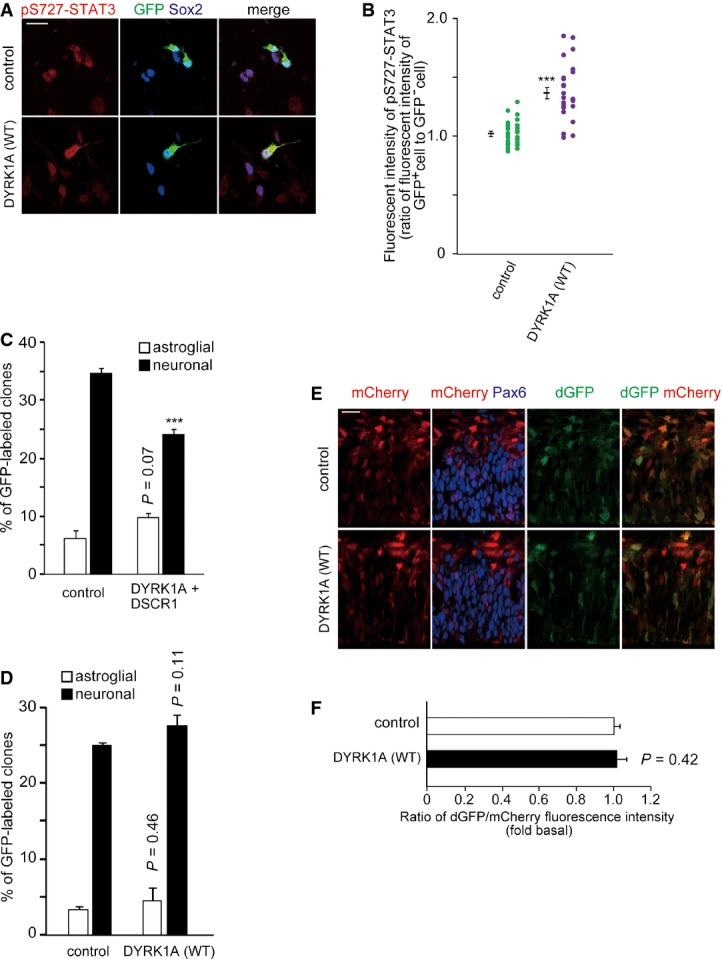
Figure 5. Overexpression of DYRK1A results in an increase in STAT activity and Ser727 phosphorylation levels of STAT3.

- A, B Whole-cell lysates of the P0 neocortex of Ts1Cje mice and euploid littermates were subjected to immunoblotting with the indicated antibodies. The band intensities quantified are plotted in (B) (mean ± SEM, n = 4 for euploid and n = 3 for Ts1Cje). *P < 0.05 by a two-tailed Student’s t-test.
- C, D Plasmid expressing DYRK1A was electroporated, together with the GFP-expressing plasmid, in E16 embryos. Neocortical cell cultures were prepared immediately after electroporation, and the cells at DIV2 were immunostained with antibodies against GFP, pS727-STAT3, and Sox2. Representative images are shown in (C). Immunofluorescence intensity of pS727-STAT3 (D) in individual GFP-positive cells and that in nearby GFP-negative cells were measured, and the ratio of the intensity values is plotted. Data are obtained from two independent experiments. ***P < 0.001 by a two-tailed Welch’s t-test.
- E–G DYRK1A-expressing plasmid was electroporated, together with the GF1L-dGFP reporter construct and mCherry-expressing plasmid, in E16 embryos. The E17 brain sections were stained with antibodies against GFP and Pax6. Images around the VZ are shown in (E). Magnified images of the cells are shown in (F). The ratio of the fluorescence intensity of dGFP to that of mCherry (G) in the soma of individual cells expressing mCherry is shown as mean ± SEM (n = 3 embryos). *P < 0.05, **P < 0.01 by a two-tailed Student’s t-test.
Data information: Scale bars: 20 μm (C, E), or 5 μm (F).
It has been reported that DYRK1A phosphorylates Ser727 of STAT3 in vitro and in a heterologous expression system using cultured mammalian cells 50,51. Based on these data, we hypothesize that increased dosage of DYRK1A is responsible for increased Ser727 phosphorylation in Ts1Cje progenitors. We then examined the effect of DYRK1A overexpression in progenitors on Ser727 phosphorylation of STAT3. E16 cortical progenitors were electroporated with DYRK1A-expressing plasmid, cultured for 2 days, and subjected to immunostaining with antibodies against STAT3 and its phosphorylated forms. DYRK1A overexpression upregulated the levels of phospho-Ser727 STAT3 levels (1.04 ± 0.02-fold in control versus 1.41 ± 0.03-fold in DYRK1A (WT)) (Fig 5C and D), whereas expression of DYRK1A (KD) had no effect (Fig 5C and D). In contrast, DYRK1A overexpression had no significant effect on Tyr705 phosphorylation as well as on the total levels of STAT3 (total STAT3: 1.02 ± 0.02-fold in control versus 0.97 ± 0.02-fold in DYRK1A (WT), P = 0.10 versus control by a two-tailed Welch’s t-test; pY705-STAT3: 1.01 ± 0.02-fold in control versus 1.01 ± 0.02-fold in DYRK1A (WT), P = 0.77 versus control by a two-tailed Welch’s t-test).
We further evaluated STAT activity in progenitors with increased dosage of DYRK1A. For this purpose, we utilized a reporter construct that drives expression of destabilized GFP (dGFP) under the control of 2.5-kb GFAP promoter (GF1L) containing a STAT-binding motif 45. We co-electroporated the GFIL-dGFP plasmid together with a plasmid expressing mCherry through constitutive CAG promoter into E16 neocortices and examined dGFP and mCherry expression at E17. In this system, mCherry serves as a transfection control, as its expression level correlates with that of co-electroporated plasmids 52,53. The ratio of dGFP fluorescent intensity to mCherry intensity was used to quantify the relative STAT activity in individual cells. When the DYRK1A-expressing plasmid was electroporated, a marked increase in STAT activity levels was observed in DYRK1A-introduced Pax6-positive progenitor cells (Fig 5E–G). Importantly, mean immunofluorescence intensity of mCherry among the individual GFP-labeled progenitors counted was not significantly different between control and DYRK1A-overexpressing condition (control, 75.1 ± 15.5; DYRK1A (WT), 64.0 ± 16.2 in arbitrary unit), while mean immunofluorescence intensity of dGFP was increased upon DYRK1A overexpression (control, 29.2 ± 8.2; DYRK1A (WT), 122.7 ± 24.9 in arbitrary unit). On the other hand, when the GF1L promoter with a point mutation in the STAT-binding motif (GF1L-SBSPM; 45) was used, dGFP was barely detectable in both control and DYRK1A-introduced progenitors (Fig EV4A). These results confirm that dGFP expression in GF1L-dGFP-electroporated progenitors is reflective of STAT activity. Altogether, we conclude that overexpression of DYRK1A enhances Ser727 phosphorylation of STAT3 as well as STAT activity in neural progenitors.
Figure EV4. Expression of dGFP in the cortical progenitors electroporated with the GF1L-SBSPM-dGFP plasmid.
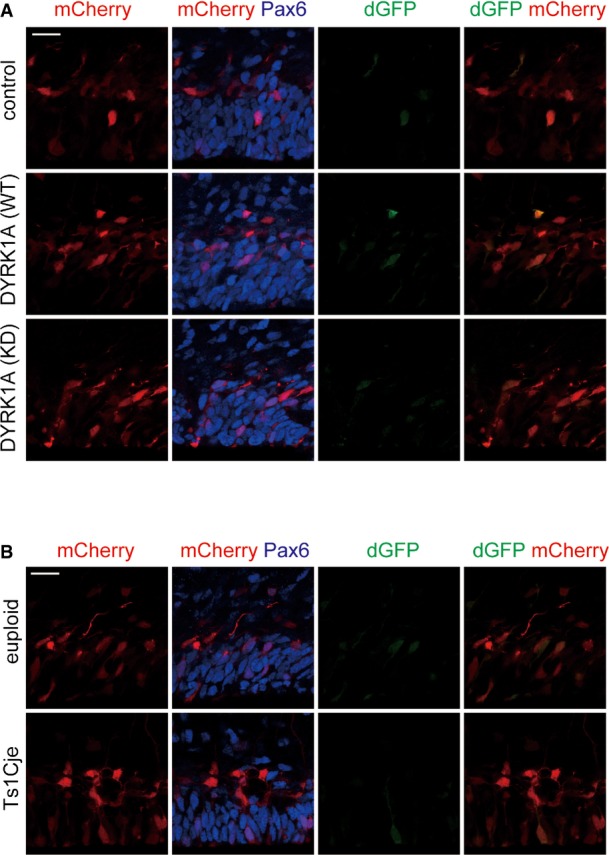
- DYRK1A-expressing plasmid was electroporated, together with the GF1L-dGFP reporter construct with a mutation in STAT-binding site (GF1L-SBSPM) and mCherry-expressing plasmid, in E16 wild-type embryos. The E17 brain sections were stained with antibodies against GFP and Pax6. Images around the VZ are shown. Scale bar, 20 μm.
- The GF1L-SBSPM-dGFP reporter construct was electroporated, together with mCherry-expressing plasmid, in E16 embryos of Ts1Cje and euploid littermates. The E17 brain sections were stained with antibodies against GFP and Pax6. Images around the VZ are shown. Scale bar, 20 μm.
DYRK1A-mediated potentiation of STAT activity in Ts1Cje progenitors
Based on findings that increasing DYRK1A levels in progenitors leads to increased Ser727 phosphorylation of STAT3 and STAT transcriptional activity, we then sought to investigate a potential involvement of DYRK1A in enhanced Ser727 phosphorylation of STAT3 in the Ts1Cje neocortex. Knockdown of DYRK1A in Ts1Cje progenitors in culture caused a decrease in Ser727 phosphorylation, as assessed by immunostaining (Fig 6A and B), whereas Tyr705 phosphorylation and total STAT3 levels were not significantly changed. Thus, enhanced Ser727 phosphorylation on STAT3 in Ts1Cje progenitors is caused by increased dosage of DYRK1A. Furthermore, we examined STAT activity in Ts1Cje progenitors by introducing GF1L-dGFP and CAG-mCherry plasmids. We found a marked increase in STAT activity in Pax6-positive progenitor cells of the Ts1Cje neocortex at E17 (Fig 7A–C). On the other hand, dGFP was barely detectable in both euploid and Ts1Cje progenitors when GF1L-SBSPM was used (Fig EV4B). Importantly, STAT activity levels were remarkably attenuated when DYRK1A shRNA was co-electroporated in Ts1Cje progenitors (Fig 7D–F). The effect was almost completely reversed by the introduction of DYRK1A insensitive to DYRK1A shRNA#1 (Fig 7D–F). In sum, increased dosage of DYRK1A is critical for the potentiation of STAT activity in Ts1Cje progenitors.
Figure 6. Knockdown of DYRK1A results in a decrease in Ser727 phosphorylation levels of STAT3 in Ts1Cje progenitors.

- A, B Plasmid expressing DYRK1A shRNA was electroporated, together with the GFP-expressing plasmid, in Ts1Cje E16 embryos. Neocortical cell cultures were prepared immediately after electroporation, and the DIV2 cells were immunostained with antibodies against GFP, pS727-STAT3, and Sox2. Representative images are shown in (A). Green and white arrowheads indicate GFP-positive and GFP-negative progenitors, respectively. Immunofluorescence intensity of pS727-STAT3 (B) in individual GFP-positive cells and that in nearby GFP-negative cells were measured, and the ratio of the intensity values is plotted. Data are obtained from two independent experiments. ***P < 0.001 by a two-tailed Welch’s t-test. Scale bar, 20 μm.
Figure 7. Knockdown of DYRK1A results in attenuation of STAT activity in Ts1Cje progenitors.

- A–C The GF1L-dGFP reporter construct was electroporated, together with mCherry-expressing plasmid, in E16 embryos of Ts1Cje and euploid littermates. The E17 brain sections were stained with antibodies against GFP and Pax6. Images around the VZ are shown in (A). Magnified images of the cells are shown in (B). The ratio of the fluorescence intensity of dGFP to that of mCherry (C) in the soma of individual cells expressing mCherry is shown as mean ± SEM (n = 3–5 embryos). ***P < 0.001 by a two-tailed Student’s t-test.
- D–F The GF1L-dGFP reporter construct and mCherry-expressing plasmid were electroporated with the indicated plasmids in E16 embryos of Ts1Cje mice. The E17 brain sections were stained with antibodies against GFP and Pax6. Images around the VZ are shown in (D). Magnified images of the cells are shown in (E). The ratio of the fluorescence intensity of dGFP to that of mCherry (F) in the soma of individual cells expressing mCherry is shown as mean ± SEM (n = 3–5 embryos). **P < 0.01 by a two-tailed Student’s t-test.
Data information: Scale bars: 20 μm (A, D), or 5 μm (B, E).
Discussion
The present study examined the effects of increased dosage of DYRK1A on astrocytic differentiation of cortical progenitors in the context of DS. In the Ts1Cje mouse model of DS, we found by clonal analysis that neocortical progenitors exhibit increased potential to differentiate into astrocytes. Importantly, depletion of DYRK1A in Ts1Cje progenitors counterbalanced the enhancement of astrocytic differentiation. Furthermore, a modest (∼1.5-fold) overexpression of DYRK1A in wild-type progenitor cells promotes their differentiation into astrocytes, suggesting an instructive role for DYRK1A in this process. Together with data showing DYRK1A-mediated activation of the astrogliogenic transcription factor STAT, we conclude that increased dosage of DYRK1A in Ts1Cje progenitors enhances astrogliogenic differentiation through STAT signaling pathway. Consistent with the idea, the Ts1Cje mice showed an overproduction of astrocytes and a corresponding reduction in neurogenesis at later stages of corticogenesis, and the astrogliogenic phenotypes can be attenuated by depletion of DYRK1A. We also found that overexpression of DYRK1A in wild-type progenitors at later stages of corticogenesis recapitulates the astrogliogenic phenotype observed in the Ts1Cje neocortex. Furthermore, STAT activity in cortical progenitors was increased in both Ts1Cje neocortex in a DYRK1A-dependent manner and in the DYRK1A-introduced wild-type neocortex. Taken together, these observations link the overproduction of astrocytes in the Ts1Cje neocortex to the enhanced astrocytic differentiation of progenitors caused by increased dosage of DYRK1A through the STAT signaling pathway.
The JAK-STAT signaling pathway plays a crucial role in astrocytic differentiation of neural progenitor cells 43–45. Transcriptional activity of STAT3, a major component of the pathway 46, is regulated by phosphorylation of two key residues, Tyr705 and Ser727. Several kinases such as JNK, p38, and DYRK1A are known to phosphorylate Ser727 in vitro and in heterologous expression system using cultured mammalian cells 54. Nevertheless, whether these protein kinases dictate Ser727 phosphorylation of STAT3 in vivo in a physiological or pathophysiological context remains totally unknown. In the present study, we found potentiation of STAT activity and increased STAT3 Ser727 phosphorylation in Ts1Cje progenitors and we were able to decrease this phosphorylation by depleting DYRK1A. Thus, increased dosage of DYRK1A contributes to Ser727 phosphorylation/activity of STAT3 in vivo in the context of DS. Interestingly, we found that knockdown of DYRK1A in euploid progenitors had no significant effect on STAT3 Ser727 phosphorylation (0.99 ± 0.01-fold in control sh versus 0.98 ± 0.01-fold in DYRK1A sh#1, P = 0.76 versus control by a two-tailed Welch’s t-test). DYRK1A knockdown in euploid progenitor cells had also minimal to no effect on their astrocytic differentiation when compared with that in Ts1Cje progenitors (Fig 4). Thus, DYRK1A unlikely contributes to astrocytic differentiation of normal progenitor cells. In contrast, increased dosage of DYRK1A in DS progenitors impacts their differentiation into astrocytes.
In the present study, we demonstrate that DYRK1A overexpression promotes STAT3 Ser727 phosphorylation, STAT activity, and astroglial differentiation of E16 or later stage progenitor cells (Figs 3and 5). Similarly, DYRK1A overexpression promotes STAT3 Ser727 phosphorylation at E13–14 (Fig EV5A and B). Thus, DYRK1A modifies the astrogliogenic machinery in both E13 and E16 progenitors. Combined with data showing that overexpression of DYRK1A and DSCR1 in progenitors during neurogenic phase suppresses neuronal differentiation (35 and Fig EV5C), overexpression of DYRK1A likely impairs neuronal fate acquisition and modifies the astrogliogenic machinery of neural progenitors. However, STAT activity and astroglial differentiation of progenitor cells are not affected at E13 (Fig EV5C–F). It is well known that signaling events downstream and/or upstream of STAT are suppressed during the neurogenic phase 16,18,55. Therefore, it is not surprising that STAT activity and astroglial differentiation of progenitor cells are suppressed in earlier stages of corticogenesis such as at E13–14 despite increased dosage of DYRK1A and STAT Ser727 phosphorylation. In this context, we hypothesized that the neurogenic phase in DS progenitor cells may be shortened due to DYRK1A’s dual actions: DYRK1A/DSCR1-mediated delay in neuronal differentiation and DYRK1A-STAT-mediated enhancement of astrocytic differentiation of progenitors. Together with the impaired proliferation of progenitors 36,37, these events may contribute to reduced neuronal production and increased astroglial generation in DS.
Figure EV5. Effect of DYRK1A overexpression in E13 cortical progenitors on STAT3 phosphorylation level, STAT activity, and astrocytic differentiation.
- A, B Plasmid expressing DYRK1 A was electroporated, together with the GFP-expressing plasmid, in E13 embryos. Neocortical cell cultures were prepared immediately after electroporation, and the cells at DIV1 were immunostained with antibodies against GFP, pS727-STAT3, and Sox2. Representative images are shown (A). Scale bar, 20 μm. Immunofluorescence intensity of pS727-STAT3 (B) in individual GFP-positive cells and that in nearby GFP-negative cells were measured, and the ratio of the intensity values is plotted. Data are obtained from two independent experiments. ***P < 0.001 by a two-tailed Welch’s t-test.
- C, D Plasmids expressing GFP, DYRK1A, and DSCR1 as indicated were electroporated in E13 embryos, and neocortical cell cultures were prepared immediately after electroporation. After DIV4, the cells were fixed and immunostained with antibodies against Tuj1 and GFAP. Percentage of astroglial clones is presented as mean ± SEM (n = 3–4 experiments). ***P < 0.001 by a two-tailed Student’s t-test.
- E, F DYRK1A-expressing plasmid was electroporated, together with the GF1L-dGFP reporter construct and mCherry-expressing plasmid, in E13 embryos. The E14 brain sections were stained with antibodies against GFP and Pax6. Images around the VZ are shown (E). Scale bars, 20 μm. (F) The ratio of the fluorescence intensity of dGFP to that of mCherry in the soma of individual cells expressing mCherry is shown as mean ± SEM (n = 3–4 embryos).
In summary, our study uncovers DYRK1A-STAT as a signaling pathway responsible for the differentiation of neural progenitors into astrocytes. We advance that increased dosage of DYRK1A leads to enhanced phosphorylation and activation of STAT that, in turn, promotes aberrant astrogliogenesis in the DS neocortex. As DS astrocytes have been recently shown to impair neuronal differentiation and survival 23, enhanced astrogliogenesis likely has a critical role in disease phenotypes/pathogenesis of DS and represent a potential therapeutic target for DS. By virtue of its multiple roles in progenitor fate determination, DYRK1A stands as a promising therapeutic target to ameliorate neurodevelopmental defects in DS.
Materials and Methods
Animals
Ts1Cje mice (C57BL/6J background) were a kind gift from Dr. Kazuhiro Yamakawa (RIKEN, Brain Science Institute). Ts1Cje mice were maintained by crossing carrier males with C57BL/6J females. A genotyping of Ts1Cje mouse was performed by polymerase chain reaction (PCR) as previously described 56. All mice were housed under 12-hour light – 12-hour dark cycle and ad libitum access to food and water. All animal experiments were conducted in accordance with guidelines set by The University of Tokyo and approved (permit number 21-01) by the Committee on Animal Care and Use of the Graduate School of Science in The University of Tokyo.
Plasmids
The pCAGIG plasmid (expressing GFP under the control of the CAG promoter) is a kind gift from Dr. Takahiko Matsuda (Kyoto University). Plasmids expressing mCherry, DYRK1A, and DSCR1 under the control of the CAG promoter were generated as described 35. Plasmids encoding DYRK1A shRNA were generated as described 35. For constructing GF1L-dGFP and GF1L-SBSPM-dGFP plasmids, the coding sequence of destabilized GFP (dGFP) was amplified by PCR using TOP-dGFP plasmid (a kind gift from Dr. Anjen Chenn, University of Illinois; 53) as a template. The amplified fragment was inserted into the downstream of the GFAP promoter by replacing the luciferase coding sequence of GF1L/pGL3 and GF1L-SBSPM/pGL3 plasmids (kind gifts from Dr. Kinichi Nakashima, Kyushu University; 45).
Antibodies
The following antibodies were used for immunostaining. Rabbit anti-DYRK1A (1:100; sc-28899, Santa Cruz Biotechnology), mouse anti-DYRK1A (1:250; H00001859, Abnova), rat anti-GFP (1:2,000; 04434-34, Nacalai Tesque), rabbit anti-GFP (1:2,000; A11122, Invitrogen), goat anti-Sox2 (1:200; sc-17320, Santa Cruz Biotechnology), rabbit anti-Pax6 (1:1,000; PRB-278P, Covance), rabbit anti-Ki67 (1:250; NCL-Ki67p, Novocastra Laboratories), rabbit anti-pS727-STAT3 (1:500; #9134, Cell Signaling Technology), rabbit anti-pY705-STAT3 (1:500; #9131, Cell Signaling Technology), mouse anti-STAT3 (1:200; 610189, BD Biosciences), mouse anti-nestin (1:1,000; 556309, BD Bioscience), mouse anti-Tuj1 (1:3,000; MMS-435P, Covance), rabbit anti-Tuj1 (1:3,000; PRB-435P, Covance), rabbit anti-GFAP (1:1,000; G9269, Sigma-Aldrich), mouse anti-GFAP (1:1,000; G3893, Sigma-Aldrich), rabbit anti-cleaved caspase-3 (1:500; #9661, Cell Signaling Technology), mouse anti-S100β (1:100; S2532, Sigma-Aldrich), rabbit anti-Cux1 (1:100; sc-13024, Santa Cruz Biotechnology), rabbit anti-Tbr1 (1:1,000; ab31940, Abcam), rabbit anti-BLBP (1:500; AB9558, Chemicon), rabbit anti-Map2 (1:1,000; ab5622, Millipore), rat anti-MAC2 (1:500; CL8942AP, CEDARLANE), and mouse anti-NeuN (1:1,000; MAB377, Chemicon).
The following antibodies were used for immunoblotting. Rabbit anti-DYRK1A (1:2,000; sc-28899, Santa Cruz Biotechnology), rabbit anti-pS727-STAT3 (1:1,000; #9134, Cell Signaling Technology), rabbit anti-pY705-STAT3 (1:1,000; #9131, Cell Signaling Technology), mouse anti-STAT3 (1:2,000; 610189, BD Biosciences), rabbit anti-GFAP (1:1,000; G9269, Sigma-Aldrich), and mouse anti-β-actin (1:50,000; A1978, Sigma-Aldrich).
In utero electroporation
DNA solution in PBS containing 0.01% Fast Green was injected into the lateral ventricles of mouse embryos. Thereafter, electroporation (five 50-msec square pulse with 950-msec intervals; Nepa gene, CUY21-EDIT) was carried out with forceps-type electrodes (Nepa gene, CUY650P3 for E13, or CUY650P5 for E16 and E17). The electroporation voltage used was 40 V (E13) or 50–55 V (E16 and E17). Final concentrations of the plasmids used were as follows: 5 μg/μl plasmids expressing GFP (pCAGIG), 0.5 μg/μl DYRK1A, 0.5 μg/μl DSCR1, 0.5 μg/μl DYRK1A with silent mutations, 2 μg/μl CAG-mCherry, 5 μg/μl GF1L-dGFP, 5 μg/μl GF1L-SBSPM-dGFP, and 5 μg/μl DYRK1A shRNA.
Immunohistochemistry
Brains were fixed with 4% paraformaldehyde in PBS for 30 min at room temperature (for E17 brains) or 2 h (for postnatal brains) and cryoprotected in 30% sucrose in PBS overnight at 4°C. Thereafter, the brains were embedded in a solution of a 2:1 mixture of 30% sucrose/PBS and OCT compound (Sakura), frozen by liquid nitrogen, and stored at −80°C until use. Thick cryosections (20 μm) were made. Brain sections were washed with PBS, incubated with blocking solution (3% [w/v] BSA, 5% [v/v] FBS, and 0.2% [w/v] Triton X-100 in PBS) and then incubated with primary antibodies overnight at 4°C. The sections were then incubated with Alexa488/Cy3/Cy5-conjugated secondary antibodies overnight at 4°C and mounted in a Prolong Gold mounting solution (Invitrogen). For staining with Pax6, Cux1, MAC2, GFAP, and S100β, brain sections were pretreated with HistoVT One solution (Nacalai Tesque) for 15 min at 70°C. For staining with NeuN, brain sections were pretreated with a Tris/EDTA solution (10 mM Tris and 1 mM EDTA, pH 9.0) for 15 min at 70°C. Images were obtained with a 10× or 63× objective (Plan-Apochromat; Zeiss) on Zeiss LSM 5 confocal microscope.
Cell culture and transfection
For analysis of expression levels of DYRK1A, STAT3, and its phosphorylated forms in cortical progenitors, E16 embryos were electroporated with plasmids encoding GFP, DYRK1A, and DYRK1A shRNA. Following electroporation, neocortical cells were prepared and cultured as described 57. Neocortical cells were fixed at DIV1 or DIV2 with 4% paraformaldehyde in PBS for 30 min at 37°C, permeabilized with 0.2% Triton X-100 in PBS for 5 min, blocked with 3% BSA/0.2% Triton X-100 in PBS, and incubated with primary antibodies in the blocking solution at 4°C overnight. The coverslips were then incubated with Alexa-488/Cy3/Cy5-conjugated secondary antibodies for 2 h at room temperature and mounted in a Prolong Gold mounting solution (Invitrogen). Fluorescence images were obtained by using Zeiss LSM5 confocal microscope.
For clonal analysis, E13 or E16 embryos were electroporated with plasmids encoding GFP, DYRK1A, and DYRK1A shRNA, and then, neocortical progenitors were prepared immediately. The neocortical cells containing GFP-labeled cells were diluted with neocortical cells derived from the non-electroporated littermates. The cells were plated at a density of 0.2 × 10⁶ cells on sterile coverslips precoated with poly-D-lysine and laminin overnight in wells of 24-well plates. GFP expression was used to confirm that the electroporated cells were well isolated from each other so that clones could be unambiguously identified. The cells were maintained in DMEM/F12 supplemented with N2, B27, and bFGF (20 ng/ml). Half of the medium was replaced with fresh medium at DIV2, and bFGF was added (final concentration 10 ng/ml) at DIV1 and DIV3. At DIV4, cultures were fixed and subjected to immunostaining. In CNTF-stimulating condition, CNTF is added (final concentration 50 ng/ml) 48 h before the cell fixation. Clones were divided into three groups: astroglial clones (GFAP-positive astrocyte-containing clones without Tuj1-positive cell), neuronal clones (Tuj1-positive neuron-containing clones without GFAP-positive cell), and progenitor clones (clones containing nestin- or Sox2-positive cells only). Note that mixed clone (clone containing both GFAP-positive and Tuj1-positive cells) was not observed under the condition. In the plating condition used, 20–60 clones per well were observed. Also, more than 100 clones are analyzed in each condition.
STAT activity assay in cortical progenitors
E16 embryos were electroporated with the CAG-mCherry plasmid, either GF1L-dGFP or GF1L-SBSPM-dGFP plasmids, and various plasmids as indicated. The embryos were harvested 24 h later. The brain cryosections (20 μm) were immunostained with antibodies against Pax6 and GFP. Images of GFP and mCherry in the individual sections were obtained under identical parameters with a 63× objective (Plan-Apochromat; Zeiss) on a Zeiss LSM 5 confocal microscope. Mean fluorescence intensity of mCherry and GFP in the soma of individual cells expressing mCherry was measured using Zeiss Zen2010 Software. In addition, the average background fluorescence intensity was measured in individual sections using areas with no electroporated cells present and was subtracted from the mCherry and GFP intensity measurements. Cells with saturated signal were not used for the analysis. The ratio of fluorescence intensity of GFP to that of mCherry in individual cells was calculated and defined as STAT activity levels.
Sholl analysis
All GFP- and GFAP-positive image stacks from transfected astrocytes were taken as described above. An overlay of concentric circles centered on the cell soma was positioned using Adobe Illustrator CS5, and all intersections of the GFAP-immunoreactive processes with the lines of the graticule were counted. The starting radius was 5 μm and the ending radius was 55–100 μm; the interval between consecutive radii was 5 μm.
Statistical analysis
All bar graphs were plotted as mean ± SEM. Direct comparisons were made using a two-tailed Student’s or Welch’s t-test. The significance level was set at P < 0.05 for all tests.
Acknowledgments
We would like to thank Dr. Kazuhiro Yamakawa for Ts1Cje mice. We also thank Drs. Takahiko Matsuda, Kinichi Nakashima, and Anjen Chenn for plasmids. This work was supported in part by Grants-in-Aid for Young Scientists (B), Scientific Research (C) (N.K.), and Exploratory Research (K.S.) from the Ministry of Education, Culture, Sports, Science, and Technology of Japan, and research grants from the Mitsubishi Foundation, Takeda Science Foundation (N.K.), Daiichi Sankyo Foundation of Life Science (K.S.), and the Canadian Institutes of Health Research (M.D.N).
Author contributions
NK performed experiments. NK, MDN, and KS designed experiments and wrote the manuscript.
Conflict of interest
The authors declare that they have no conflict of interest.
Supporting Information
Appendix
Expanded View Figures PDF
Review Process File
References
- Canfield MA, Honein MA, Yuskivm N, Xing J, Mai CT, Collins JS, Devine O, Petrini J, Ramadhani TA, Hobbs CA, et al. National estimates and race/ethnic-specific variation of selected birth defects in the United States, 1999–2001. Birth Defects Res A Clin Mol Teratol. 2006;76:747–756. doi: 10.1002/bdra.20294. [DOI] [PubMed] [Google Scholar]
- Antonaraki SE, Lyle R, Dermitzakis ET, Reymond A, Deutsch S. Chromosome 21 and Down syndrome: from genomics to pathophysiology. Nat Rev Genet. 2004;5:725–738. doi: 10.1038/nrg1448. [DOI] [PubMed] [Google Scholar]
- Hasle H, Clemmensen IH, Mikkelsen M. Risks of leukaemia and solid tumours in individuals with Down’s syndrome. Lancet. 2000;355:165–169. doi: 10.1016/S0140-6736(99)05264-2. [DOI] [PubMed] [Google Scholar]
- Roizen NJ, Patterson D. Down’s syndrome. Lancet. 2003;361:1281–1289. doi: 10.1016/S0140-6736(03)12987-X. [DOI] [PubMed] [Google Scholar]
- Chapman RS, Hesketh LJ. Behavioral phenotype of individuals with Down syndrome. Ment Retard Dev Disabil Res Rev. 2000;6:84–95. doi: 10.1002/1098-2779(2000)6:2<84::AID-MRDD2>3.0.CO;2-P. [DOI] [PubMed] [Google Scholar]
- Mann DMA, Yates PO, Marcyniuk B, Ravindra CR. Loss of neurons from cortical and subcortical areas in Down’s syndrome patients at middle age: quantitative comparisons with younger Down’s patients and patients with Alzheimer’s disease. J Neurol Sci. 1987;80:79–89. doi: 10.1016/0022-510x(87)90223-1. [DOI] [PubMed] [Google Scholar]
- Tanzi RE. Neuropathology in the Down’s syndrome brain. Nat Med. 1996;2:31–32. doi: 10.1038/nm0196-31. [DOI] [PubMed] [Google Scholar]
- Griffin WS, Stanley LC, Ling C, White L, MacLeod V, Perrot LJ, White CL, 3rd, Araoz C. Brain interleukin 1 and S-100 immunoreactivity are elevated in Down syndrome and Alzheimer disease. Proc Natl Acad Sci USA. 1989;86:7611–7615. doi: 10.1073/pnas.86.19.7611. [DOI] [PMC free article] [PubMed] [Google Scholar]
- Guidi S, Bonasoni P, Ceccarelli C, Santini D, Gualtieri F, Ciani E, Bartesaghi R. Neurogenesis impairment and increased cell death reduce total neuron number in the hippocampal region of fetuses with Down syndrome. Brain Pathol. 2008;18:180–197. doi: 10.1111/j.1750-3639.2007.00113.x. [DOI] [PMC free article] [PubMed] [Google Scholar]
- Golden JA, Hyman B. Development of the superior temporal neocortex is anomalous in trisomy 21. J Neuropathol Exp Neurol. 1994;53:513–520. doi: 10.1097/00005072-199409000-00011. [DOI] [PubMed] [Google Scholar]
- Schmidt-Sidor B, Wisniewski KE, Shepard TH, Sersen EA. Brain growth in Down syndrome subjects 15 to 22 weeks of gestational age and birth to 60 months. Clin Neuropathol. 1990;9:181–190. [PubMed] [Google Scholar]
- Weitzdoerfer R, Dierssen M, Fountoulakis M, Lubec G. Fetal life in Down syndrome starts with normal neuronal density but impaired dendritic spines and synaptosomal structure. J Neural Transm Suppl. 2001;61:59–70. doi: 10.1007/978-3-7091-6262-0_5. [DOI] [PubMed] [Google Scholar]
- Breunig JJ, Haydar TF, Rakic P. Neural stem cells: historical perspective and future prospects. Neuron. 2011;70:614–625. doi: 10.1016/j.neuron.2011.05.005. [DOI] [PMC free article] [PubMed] [Google Scholar]
- Gräff J, Kim D, Dobbin MM, Tsai LH. Epigenetic regulation of gene expression in physiological and pathological brain processes. Physiol Rev. 2011;91:603–649. doi: 10.1152/physrev.00012.2010. [DOI] [PubMed] [Google Scholar]
- Kriegstein A, Alvarez-Buylla A. The glial nature of embryonic and adult neural stem cells. Annu Rev Neurosci. 2009;32:149–184. doi: 10.1146/annurev.neuro.051508.135600. [DOI] [PMC free article] [PubMed] [Google Scholar]
- Martynoga B, Drechsel D, Guillemot F. Molecular control of neurogenesis: a view from the mammalian cerebral cortex. Cold Spring Harb Perspect Biol. 2012;4:a008359. doi: 10.1101/cshperspect.a008359. [DOI] [PMC free article] [PubMed] [Google Scholar]
- Miyata T, Kawaguchi D, Kawaguchi A, Gotoh Y. Mechanisms that regulate the number of neurons during mouse neocortical development. Curr Opin Neurobiol. 2010;20:22–28. doi: 10.1016/j.conb.2010.01.001. [DOI] [PubMed] [Google Scholar]
- Okano H, Temple S. Cell types to order: temporal specification of CNS stem cells. Curr Opin Neurobiol. 2009;19:112–119. doi: 10.1016/j.conb.2009.04.003. [DOI] [PubMed] [Google Scholar]
- Poduri A, Evrony GD, Cai X, Walsh CA. Somatic mutation, genomic variation, and neurological disease. Science. 2013;341:1237758. doi: 10.1126/science.1237758. [DOI] [PMC free article] [PubMed] [Google Scholar]
- Contestabile A, Fila T, Ceccarelli C, Bonasoni P, Bonapace L, Santini D, Bartesaghi R, Ciani E. Cell cycle alteration and decreased cell proliferation in the hippocampal dentate gyrus and in the neocortical germinal matrix of fetuses with Down syndrome and in Ts65Dn mice. Hippocampus. 2007;17:665–678. doi: 10.1002/hipo.20308. [DOI] [PubMed] [Google Scholar]
- Lu J, Lian G, Zhou H, Esposito G, Steardo L, Delli-Bovi LC, Hecht JL, Lu QR, Sheen V. OLIG2 over-expression impairs proliferation of human Down syndrome neural progenitors. Hum Mol Genet. 2012;21:2330–2340. doi: 10.1093/hmg/dds052. [DOI] [PMC free article] [PubMed] [Google Scholar]
- Briggs JA, Sun J, Shepherd J, Ovchinnikov DA, Chung TL, Nayler SP, Kao LP, Morrow CA, Thakar NY, Soo SY, et al. Integration-free induced pluripotent stem cells model genetic and neural developmental features of Down syndrome etiology. Stem Cells. 2013;31:467–478. doi: 10.1002/stem.1297. [DOI] [PubMed] [Google Scholar]
- Chen C, Jiang P, Xue H, Peterson SE, Tran HT, McCann AE, Parast MM, Li S, Pleasure DE, Laurent LC, et al. Role of astroglia in Down’s syndrome revealed by patient-derived human-induced pluripotent stem cells. Nat Commun. 2014;5:4430. doi: 10.1038/ncomms5430. [DOI] [PMC free article] [PubMed] [Google Scholar]
- Lu J, Esposito G, Scuderi C, Steardo L, Delli-Bovi LC, Hecht JL, Dickinson BC, Chang CJ, Mori T, Sheen V. S100B and APP promote a gliocentric shift and impaired neurogenesis in Down syndrome neural progenitors. PLoS ONE. 2011;6:e22126. doi: 10.1371/journal.pone.0022126. [DOI] [PMC free article] [PubMed] [Google Scholar]
- Chakrabarti L, Galdzicki Z, Haydar TF. Defects in embryonic neurogenesis and initial synapse formation in the forebrain of the Ts65Dn mouse model of Down syndrome. J Neurosci. 2007;27:11483–11495. doi: 10.1523/JNEUROSCI.3406-07.2007. [DOI] [PMC free article] [PubMed] [Google Scholar]
- Ishihara K, Amano K, Takaki E, Shimohata A, Sago H, Epstein CJ, Yamakawa K. Enlarged brain ventricles and impaired neurogenesis in the Ts1Cje and Ts2Cje mouse models of Down syndrome. Cereb Cortex. 2010;20:1131–1143. doi: 10.1093/cercor/bhp176. [DOI] [PubMed] [Google Scholar]
- Moldrich RX, Dauphinot L, Laffaire J, Vitalis T, Hérault Y, Beart PM, Rossier J, Vivien D, Gehrig C, Antonarakis SE, et al. Proliferation deficits and gene expression dysregulation in Down’s syndrome (Ts1Cje) neural progenitor cells cultured from neurospheres. J Neurosci Res. 2009;87:3143–3152. doi: 10.1002/jnr.22131. [DOI] [PubMed] [Google Scholar]
- Trazzi S, Mitrugno VM, Valli E, Fuchs C, Rizzi S, Guidi S, Perini G, Bartesaghi R, Ciani E. APP-dependent upregulation of Ptch1 underlies proliferation impairment of neural precursors in Down syndrome. Hum Mol Genet. 2011;20:1560–1573. doi: 10.1093/hmg/ddr033. [DOI] [PubMed] [Google Scholar]
- Guimera J, Casas C, Estivill X, Pritchard M. Human minibrain homologue (MNBH/DYRK1): characterization, alternative splicing, differential tissue expression, and overexpression in Down syndrome. Genomics. 1999;57:407–418. doi: 10.1006/geno.1999.5775. [DOI] [PubMed] [Google Scholar]
- Becker W, Sippl W. Activation, regulation, and inhibition of DYRK1A. FEBS J. 2011;278:246–256. doi: 10.1111/j.1742-4658.2010.07956.x. [DOI] [PubMed] [Google Scholar]
- Dierssen M. Down syndrome: the brain in trisomic mode. Nat Rev Neurosci. 2012;13:844–858. doi: 10.1038/nrn3314. [DOI] [PubMed] [Google Scholar]
- Haydar TF, Reeves RH. Trisomy 21 and early brain development. Trends Neurosci. 2012;35:81–91. doi: 10.1016/j.tins.2011.11.001. [DOI] [PMC free article] [PubMed] [Google Scholar]
- Park J, Chung KC. New perspectives of Dyrk1A role in neurogenesis and neuropathologic features of Down syndrome. Exp Neurobiol. 2013;22:244–248. doi: 10.5607/en.2013.22.4.244. [DOI] [PMC free article] [PubMed] [Google Scholar]
- Tejedor FJ, Hämmerle B. MNB/DYRK1A as a multiple regulator of neuronal development. FEBS J. 2011;278:223–235. doi: 10.1111/j.1742-4658.2010.07954.x. [DOI] [PubMed] [Google Scholar]
- Kurabayashi N, Sanada K. Increased dosage of DYRK1A and DSCR1 delays neuronal differentiation in neocortical progenitor cells. Genes Dev. 2013;27:2708–2721. doi: 10.1101/gad.226381.113. [DOI] [PMC free article] [PubMed] [Google Scholar]
- Soppa U, Schumacher J, Ortiz VF, Pasqualon T, Tejedor FJ, Becker W. The Down syndrome-related protein kinase DYRK1A phosphorylates p27(Kip1) and Cyclin D1 and induces cell cycle exit and neuronal differentiation. Cell Cycle. 2014;13:2084–2100. doi: 10.4161/cc.29104. [DOI] [PMC free article] [PubMed] [Google Scholar]
- Yabut O, Domogauer J, D’Arcangelo G. Dyrk1A overexpression inhibits proliferation and induces premature neuronal differentiation of neural progenitor cells. J Neurosci. 2010;30:4004–4014. doi: 10.1523/JNEUROSCI.4711-09.2010. [DOI] [PMC free article] [PubMed] [Google Scholar]
- Shen Q, Wang Y, Dimos JT, Fasano CA, Phoenix TN, Lemischka IR, Ivanova NB, Stifani S, Morrisey EE, Temple S. The timing of cortical neurogenesis is encoded within lineages of individual progenitor cells. Nat Neurosci. 2006;9:743–751. doi: 10.1038/nn1694. [DOI] [PubMed] [Google Scholar]
- Ge WP, Miyawaki A, Gage FH, Jan YN, Jan LY. Local generation of glia is a major astrocyte source in postnatal cortex. Nature. 2012;484:376–380. doi: 10.1038/nature10959. [DOI] [PMC free article] [PubMed] [Google Scholar]
- Hämmerle B, Elizalde C, Tejedor FJ. The spatio-temporal and subcellular expression of the candidate Down syndrome gene Mnb/Dyrk1A in the developing mouse brain suggests distinct sequential roles in neuronal development. Eur J Neurosci. 2008;27:1061–1074. doi: 10.1111/j.1460-9568.2008.06092.x. [DOI] [PubMed] [Google Scholar]
- Martí E, Altafaj X, Dierssen M, de la Luna S, Fotaki V, Alvarez M, Pérez-Riba M, Ferrer I, Estivill X. Dyrk1A expression pattern supports specific roles of this kinase in the adult central nervous system. Brain Res. 2003;964:250–263. doi: 10.1016/s0006-8993(02)04069-6. [DOI] [PubMed] [Google Scholar]
- Sholl DA. Dendritic organization in the neurons of the visual and motor cortices of the cat. J Anat. 1953;87:387–406. [PMC free article] [PubMed] [Google Scholar]
- Bonni A, Sun Y, Nadal-Vicens M, Bhatt A, Frank DA, Rozovsky I, Stahl N, Yancopoulos GD, Greenberg ME. Regulation of gliogenesis in the central nervous system by the JAK-STAT signaling pathway. Science. 1997;278:477–483. doi: 10.1126/science.278.5337.477. [DOI] [PubMed] [Google Scholar]
- Rajan P, McKay RD. Multiple routes to astrocytic differentiation in the CNS. J Neurosci. 1998;18:3620–3629. doi: 10.1523/JNEUROSCI.18-10-03620.1998. [DOI] [PMC free article] [PubMed] [Google Scholar]
- Nakashima K, Yanagisawa M, Arakawa H, Kimura N, Hisatsune T, Kawabata M, Miyazono K, Taga T. Synergistic signaling in fetal brain by STAT3-Smad1 complex bridged by p300. Science. 1999;284:479–482. doi: 10.1126/science.284.5413.479. [DOI] [PubMed] [Google Scholar]
- He F, Ge W, Martinowich K, Becker-Catania S, Coskun V, Zhu W, Wu H, Castro D, Guillemot F, Fan G, et al. A positive autoregulatory loop of Jak-STAT signaling controls the onset of astrogliogenesis. Nat Neurosci. 2005;8:616–625. doi: 10.1038/nn1440. [DOI] [PMC free article] [PubMed] [Google Scholar]
- Levy DE, Darnell JE., Jr Stats: transcriptional control and biological impact. Nat Rev Mol Cell Biol. 2002;3:651–662. doi: 10.1038/nrm909. [DOI] [PubMed] [Google Scholar]
- Wen Z, Zhong Z, Darnell JE., Jr Maximal activation of transcription by Statl and Stat3 requires both tyrosine and serine phosphorylation. Cell. 1995;82:241–250. doi: 10.1016/0092-8674(95)90311-9. [DOI] [PubMed] [Google Scholar]
- Yoshimatsu T, Kawaguchi D, Oishi K, Takeda K, Akira S, Masuyama N, Gotoh Y. Non-cell-autonomous action of STAT3 in maintenance of neural precursor cells in the mouse neocortex. Development. 2006;133:2553–2563. doi: 10.1242/dev.02419. [DOI] [PubMed] [Google Scholar]
- Li D, Jackson RA, Yusoff P, Guy GR. Direct association of sprouty-related protein with an EVH1 domain (SPRED) 1 or SPRED2 with DYRK1A modifies substrate/kinase interactions. J Biol Chem. 2010;285:35374–35385. doi: 10.1074/jbc.M110.148445. [DOI] [PMC free article] [PubMed] [Google Scholar]
- Matsuo R, Ochiai W, Nakashima K, Taga T. A new expression cloning strategy for isolation of substrate-specific kinases by using phosphorylation site-specific antibody. J Immunol Methods. 2001;247:141–151. doi: 10.1016/s0022-1759(00)00313-6. [DOI] [PubMed] [Google Scholar]
- Hatanaka Y, Hisanaga S, Heizmann CW, Murakami F. Distinct migratory behavior of early- and late-born neurons derived from the cortical ventricular zone. J Comp Neurol. 2004;479:1–14. doi: 10.1002/cne.20256. [DOI] [PubMed] [Google Scholar]
- Woodhead GJ, Mutch CA, Olson EC, Chenn A. Cell-autonomous beta-catenin signaling regulates cortical precursor proliferation. J Neurosci. 2006;26:12620–12630. doi: 10.1523/JNEUROSCI.3180-06.2006. [DOI] [PMC free article] [PubMed] [Google Scholar]
- Qi QR, Yang ZM. Regulation and function of signal transducer and activator of transcription 3. World J Biol Chem. 2014;5:231–239. doi: 10.4331/wjbc.v5.i2.231. [DOI] [PMC free article] [PubMed] [Google Scholar]
- Miller FD, Gauthier AS. Timing is everything: making neurons versus glia in the developing cortex. Neuron. 2007;254:357–369. doi: 10.1016/j.neuron.2007.04.019. [DOI] [PubMed] [Google Scholar]
- Amano K, Sago H, Uchikawa C, Suzuki T, Kotliarova SE, Nukina N, Epstein CJ, Yamakawa K. Dosage-dependent over-expression of genes in the trisomic region of Ts1Cje mouse model for Down syndrome. Hum Mol Genet. 2004;13:1333–1340. doi: 10.1093/hmg/ddh154. [DOI] [PubMed] [Google Scholar]
- Sanada K, Tsai LH. G protein βγ subunits and AGS3 control spindle orientation and asymmetric cell fate of cerebral cortical progenitors. Cell. 2005;122:119–131. doi: 10.1016/j.cell.2005.05.009. [DOI] [PubMed] [Google Scholar]
Associated Data
This section collects any data citations, data availability statements, or supplementary materials included in this article.
Supplementary Materials
Appendix
Expanded View Figures PDF
Review Process File