Abstract
Super-enhancers (SEs), which are composed of large clusters of enhancers densely loaded with the Mediator complex, transcription factors (TFs), and chromatin regulators, drive high expression of genes implicated in cell identity and disease, such as lineage-controlling TFs and oncogenes 1, 2. BRD4 and CDK7 are positive regulators of SE-mediated transcription3,4,5. In contrast, negative regulators of SE-associated genes have not been well described. Here we report that Mediator-associated kinases cyclin-dependent kinase 8 (CDK8) and CDK19 restrain increased activation of key SE-associated genes in acute myeloid leukaemia (AML) cells. We determined that the natural product cortistatin A (CA) selectively inhibited Mediator kinases, had antileukaemic activity in vitro and in vivo, and disproportionately induced upregulation of SE-associated genes in CA-sensitive AML cell lines but not in CA-insensitive cell lines. In AML cells, CA upregulated SE-associated genes with tumour suppressor and lineage-controlling functions, including the TFs CEBPA, IRF8, IRF1 and ETV6 6, 7, 8. The BRD4 inhibitor I-BET151 downregulated these SE-associated genes, yet also has antileukaemic activity. Individually increasing or decreasing expression of these TFs suppressed AML cell growth, providing evidence that leukaemia cells are sensitive to dosage of SE-associated genes. Our results demonstrate that Mediator kinases can negatively regulate SE-associated gene expression in specific cell types and can be pharmacologically targeted as a therapeutic approach to AML.
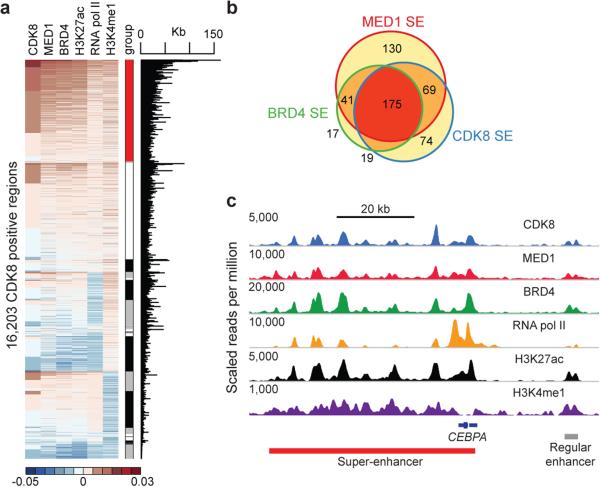
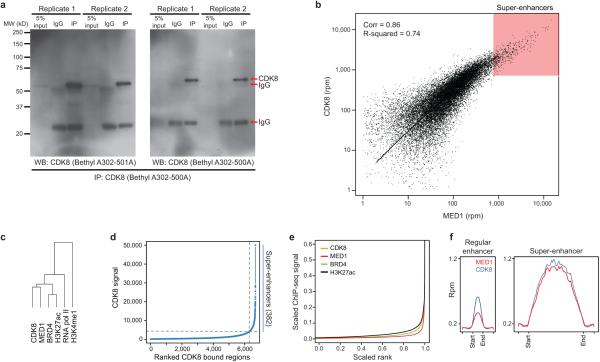
CDK8 associates with CCNC (Cyclin C), MED12, and MED13 to form a CDK8 module that can reversibly associate with the 26-subunit Mediator complex 9. Because SEs are disproportionately loaded with Mediator2, we examined whether CDK8, as a Mediator-associated kinase, might regulate SE function. Using chromatin immunoprecipitation followed by sequencing (ChIP-seq), we mapped the genome-wide occupancy of CDK8, along with known SE-associated factors and histone modifications, in the AML cell line MOLM-14. Semi-supervised hierarchical clustering revealed that CDK8 most closely associated with MED1, followed by BRD4 and H3K27ac, at putative enhancer elements marked with H3K4me1 (red bar, Fig. 1a, Extended Data Fig. 1a-c). A fraction of these regions were particularly large and loaded with CDK8, MED1 and BRD4, suggesting they may represent SEs. Consistent with this notion, the majority of CDK8, MED1, BRD4 and H3K27ac ChIP-seq signal was disproportionately located on a small number of SEs identified by each factor separately (Extended Data Fig. 1d-f). These SEs significantly overlapped (Fig. 1b,c, Supplementary Table 1). Genes associated with these SEs were enriched with gene ontology (GO) terms pertinent to haematopoiesis, cellular differentiation, and transcription, supporting the notion that SEs regulate cellular identity (Supplementary Data Table 1).
Figure 1. CDK8 is asymmetrically loaded at SEs in MOLM-14 cells.
(a) Clustering of total ChIP-seq signal of CDK8, MED1, BRD4, H3K27ac, RNA pol II, and H3K4me1 on CDK8 positive regions. Each respective cluster is ordered by CDK8 signal. The red bar indicates the cluster most highly enriched for the factors listed above. (b) Overlap between SEs independently identified by ChIP-seq signal for CDK8, MED1 and BRD4 based on the collapsed superset of regions identified by any one factor. (c) ChIP-seq binding profiles at the CEBPA locus.
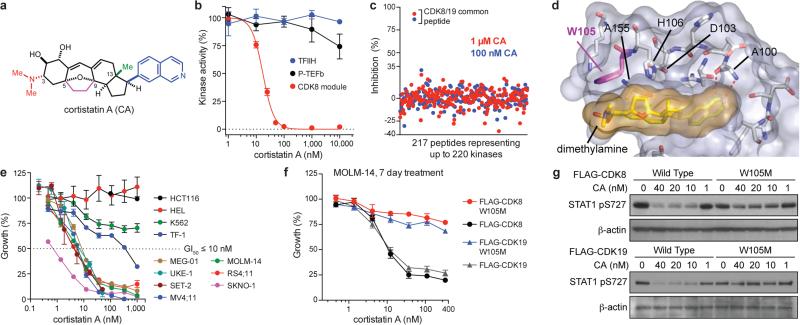
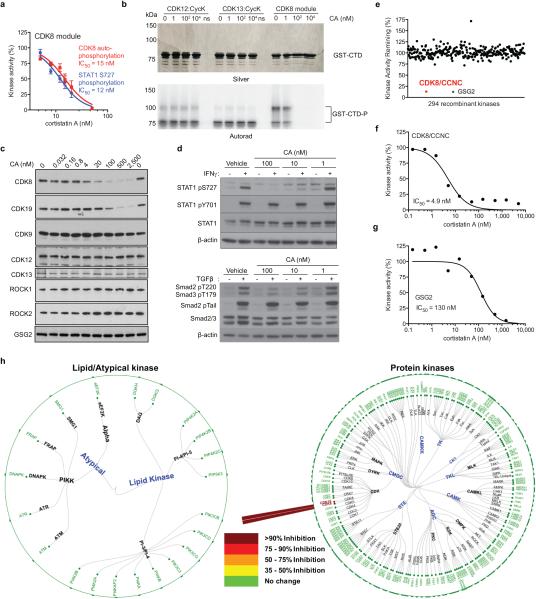
To determine whether pharmacologic inhibition of Mediator kinases regulates SE function and inhibits AML proliferation, in analogy to BRD4, we characterized CA (Fig. 2a) as an inhibitor of CDK8 and its paralog CDK19 (77% identical overall and 94% in the catalytic domain). CA was reported to bind CDK8 and CDK19, as well as ROCK1 and ROCK2, as individual proteins in vitro10. We synthesized CA11,12 and determined that it potently inhibited the kinase activity of the CDK8 module in vitro (IC50 = 12 nM, Fig. 2b, Extended Data Fig. 2a). In contrast, CA did not inhibit other transcriptional cyclin-dependent kinases CDK7 (TFIIH), CDK9 (P-TEFb), CDK12, or CDK13 in vitro, nor did it bind CDK9, CDK12, CDK13, ROCK1 or ROCK2 up to 2,500 nM in MOLM-14 cell lysate (Fig. 2b, Extended Data Fig. 2b,c). In cells, CA dose-dependently inhibited phosphorylation of known CDK8 substrates STAT1 S72713 (IC50 < 10 nM), Smad2 T220 and Smad3 T17914 (IC50 < 100 nM) (Extended Data Fig. 2d). No kinase substrates have been reported for CDK19.
Figure 2. CA suppresses AML cell proliferation by inhibiting Mediator kinases.
(a) CA structure with N,N-dimethylamine red, C5–C9 ethano bridge magenta, C13-methyl green and isoquinoline blue. (b) Phosphorylation of the RNA pol II C-terminal domain (mean ± s.e.m., n=3 biological replicates, one of two experiments shown, autorad in Supplementary Figure 1). (c) Kinome profiling in MOLM-14 lysate (mean, n=2 biological replicates, experiment performed once, values < 35% indicate no change). (d) CA binding pocket of CDK8 from CA-CDK8-CCNC crystal structure (semi-transparent surface; CA in gold, CDK8 in grey) with contact residues and CA in stick representation. Dotted red lines indicate H-bonds. (e) Effect of CA on growth of indicated cell lines (mean ± s.e.m., n=3 biological replicates, one of two experiments shown). (f) Sensitivity of MOLM-14 cells to CA upon expression of indicated kinases (mean ± s.e.m., n=3 biological replicates, one of two experiments shown). (g) Immunoblot showing IFN-γ-stimulated STAT1 S727 phosphorylation in MOLM-14 cells expressing indicated kinases and treated with CA (one of two experiments shown, full scan in Supplementary Figure 1).
We more broadly evaluated CA selectivity in cell lysate (KiNativ)15 and in vitro, which collectively tested 387 kinases. At 100-times the CDK8 IC50, CA was fully selective in MOLM-14 cell lysate for CDK8/CDK19 and in vitro only inhibited CDK8/CCNC and GSG2, the latter of which we disqualified as a cellular target of CA (Fig. 2c, Extended Data Fig. 2c,e-h, Supplementary Table 2, Supplementary Information). CA also exhibited high affinity binding (Kd = 195 ± 15.8 pM), slow binding kinetics (koff = 6.35×10⁻⁵ ± 8.15×10⁻⁶ s−1, kon = 3.26×10⁵ ± 1.54×10⁴ s−1M−1) and a long residence time (262 ± 34 min) in its interaction with CDK8/CCNC in vitro.
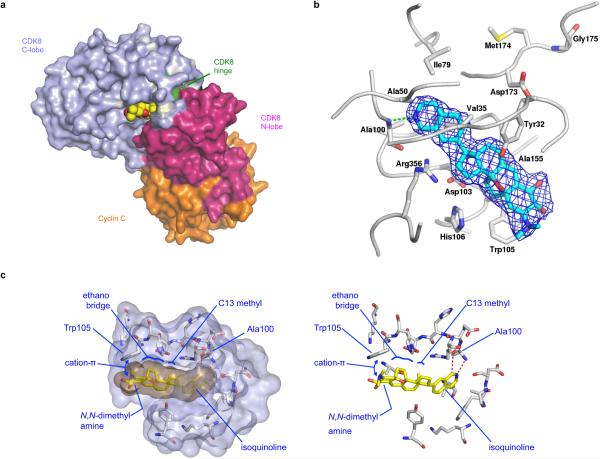
To understand how CA inhibits CDK8, we obtained a high-resolution (2.4 Å) crystal structure of a CA/CDK8/CCNC ternary complex (Fig. 2d, Extended Data Fig. 3). CA exhibits exquisite shape complementarity with the ATP-binding pocket of CDK8. In particular, the isoquinoline of CA forms N-H and CH-O hydrogen bonds with Ala 10016, the C5–C9 ethano bridge and the C13-methyl group of CA occupy deep hydrophobic crevices in the ATP-binding site, and the protonated C3 N,N-dimethylamine of CA engages in an apparent cation-π interaction with Trp 10517.
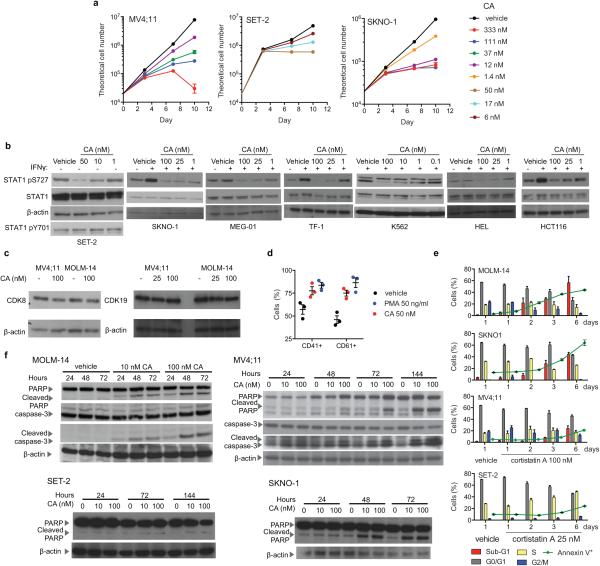
We investigated the antiproliferative activity of CA and observed that it inhibited the proliferation (GI50 < 10 nM) of several myeloid, mixed-lineage, and megakaryoblastic leukaemia cell lines harbouring diverse oncogenic contributors, including MLL-fusions (MOLM-14, MV4;11, and RS4;11), RUNX1-RUNX1T1 (SKNO-1), JAK2V617F (SET-2 and UKE-1) and BCR-ABL (MEG-01) (Fig. 2e, Extended Data Table 1, Extended Data Fig. 4a). CA inhibited CDK8 kinase activity in both sensitive and insensitive cell lines with similar potency and did not alter CDK8 or CDK19 protein levels (Extended Data Fig. 4b,c). Although SET-2 and HEL cell lines harbour the JAK2V617F mutation and MEG-01 and K562 harbour the BCR-ABL translocation, megakaryoblastic cell lines SET-2 and MEG-01 cells were sensitive to CA whereas erythroleukaemia-derived cell lines HEL and K562 were not, suggesting that cell lineage may be a contributing determinant for CA sensitivity18. The phenotypic effects of CA were cell line-dependent. CA treatment increased megakaryocyte markers CD41 and CD61 on SET-2 cells, whereas CA treatment of MOLM-14, MV4;11, and SKNO-1 cells increased cleaved PARP levels, Annexin V staining and the sub-G1 cell population, consistent with apoptosis (Extended Data Fig. 4d-f).
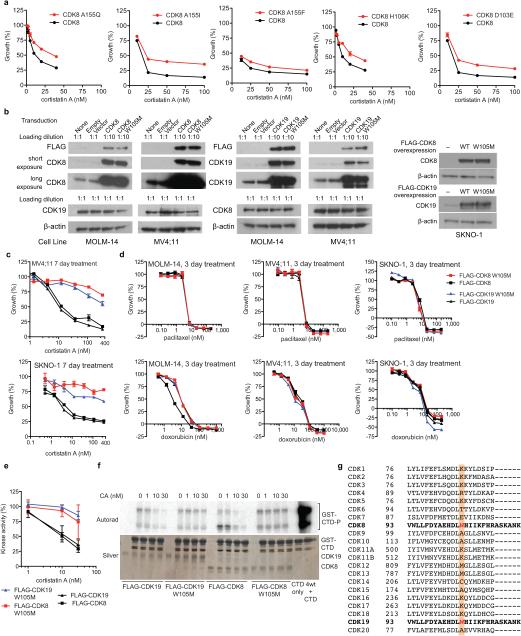
We confirmed that Mediator kinases mediate the antiproliferative activity of CA by identifying a point mutant of CDK8 and CDK19, W105M, that maintained catalytic activity but specifically conferred resistance to CA (Fig. 2e,f, Extended Data Figs. 5a-f). Notably, CDK8 and CDK19 are the only mammalian CDKs with Trp (or any aromatic amino acid) at residue 105 (Extended Data Fig. 5g), underscoring the importance of the putative cation-π interaction.
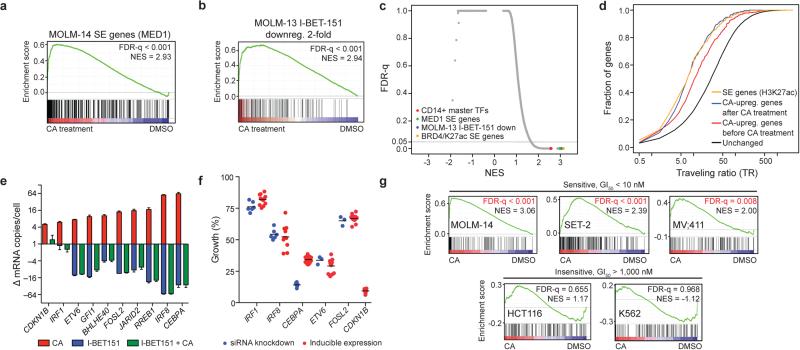
Next, we used CA to investigate whether Mediator kinase activity regulates SE-associated gene expression in AML cells. Global gene expression profiling in MOLM-14 cells treated with CA revealed that genes upregulated by CA at 3 hours were highly enriched for association with SEs by gene set enrichment analysis (GSEA)19 (Fig. 3a,b, Extended Data Fig. 6a, Supplementary Table 3). These SE-associated gene sets ranked among the most significantly enriched compared to all other signatures tested (Fig. 3c). Genes upregulated (≥1.2-fold) by CA were disproportionately associated with SEs in MOLM-14 cells (49/251, 20%) compared to regular enhancers (173/5034, 3%) (Extended Data Fig. 6b, Fisher's exact test, p < 2.2 × 10⁻¹⁶). In contrast, of 102 genes downregulated (≥ 1.2-fold) by CA, only three were identified as SE-associated (3/251, 1%). Additionally, the association between CA upregulated genes (≥1.2-fold) and SE-associated genes correlated with CDK8 occupancy (Fisher's exact test, p = 2.5 × 10⁻⁸), consistent with the notion that SEs are direct targets of CA treatment in MOLM-14 cells (Extended Data Fig. 6b).
Figure 3. CA disproportionately increases transcription of SE-associated genes.
(a-b) GSEA plots show that genes upregulated upon 3h CA treatment of MOLM-14 cells are significantly enriched in (a) MOLM-14 SE-associated genes (SE genes) and (b) genes downregulated by IBET-151 ≥2-fold in MOLM-13 cells. Red bars in b indicate H3K27ac SE genes in MOLM-14 cells in GSEA leading edge (22 genes, Fisher's exact test, p = 1.2 × 10⁻³). (c) Scatterplot of false discovery rate (FDR-q) versus normalized enrichment score (NES) for indicated gene sets evaluated by GSEA (n = 3,867), including C2 of MSigDB. (d) Cumulative distribution plots of RNA pol II TR. (e) Change in mRNA copy number/cell of selected SE genes after 3 h treatment (red and blue bars) or after 6 h I-BET151 treatment with CA treatment for the final 3 h (green bar) (mean ± s.e.m., n=3 biological replicates, one of two experiments shown). (f) Effect of change in expression of selected SE genes on MOLM-14 cell growth (mean ± s.e.m., with n=3 biological replicates for siETV6 and siFOSL2 and 6 for other siRNA knockdowns, 24 for FLAG-CEBPA and 12 for other inducible expressions, one of 2-6 experiments shown). (g) GSEA of SE genes in CA-treated cells. Regions of CDK8 and H3K27Ac co-enrichment identify SE genes in each cell line.
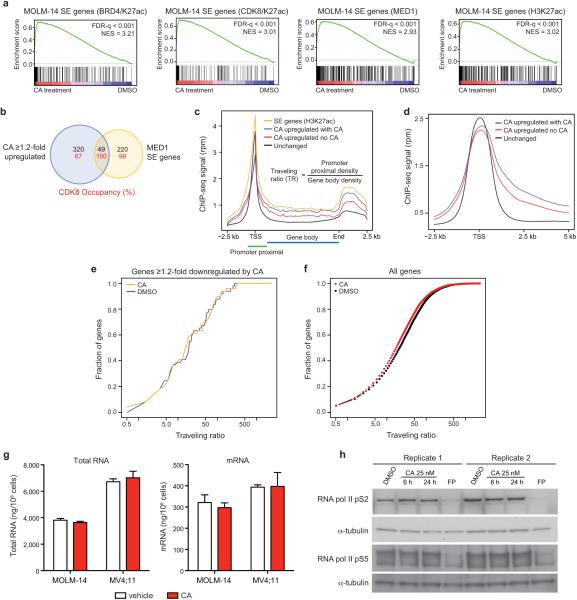
Because SE-associated genes are more highly expressed compared to regular enhancer-associated genes, we determined whether genes upregulated by CA had elongating RNA pol II and reduced traveling ratios (TR20, ratio of RNA pol II ChIP-seq reads in the proximal promoter versus the gene body). Indeed, CA upregulated genes exhibited reduced baseline TR (2.40-fold, p < 2.2 × 10⁻¹⁶, red vs. black curve, Fig. 3d, Extended Data Fig. 6c,d), consistent with CA upregulating active genes, including those associated with SEs. CA treatment further reduced the TR of these “CA upregulated” genes to a level similar to all SE-associated genes (yellow curve), in agreement with their increased expression after CA treatment (1.48-fold, p = 7.6 × 10⁻⁴, blue vs. red curve, Fig. 3d). Genes downregulated by CA experienced insignificant changes in TR (Extended Data Fig. 6e). Global effects of CA on RNA pol II TR, RNA pol II CTD phosphorylation, mRNA and total RNA levels were modest or negligible (Extended Data Fig. 6f-h).
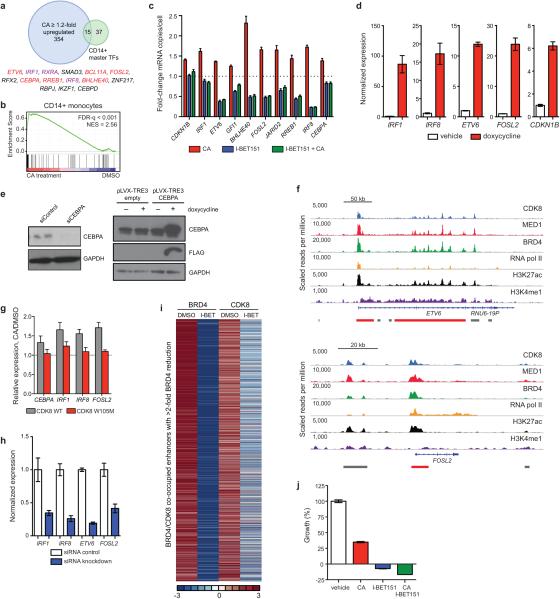
We then examined whether upregulation of SE-associated genes might contribute to the antiproliferative activity of CA. SE-associated genes upregulated by CA were enriched in lineage-controlling master TFs identified in related CD14+ monocytes1, including tumour suppressors IRF1, IRF8, CEBPA, and ETV6 (Fig. 3e, Extended Data Fig. 7a-c). Increased expression of these genes individually, as well as SE-associated genes FOSL2 and CDKN1B, inhibited the proliferation of MOLM-14 cells (Fig. 3f, Extended Data Fig. 7d,e). ChIP-seq data revealed CDK8 occupancy at each gene's nearby SE (CEBPA, Fig. 1c; and ETV6 and FOSL2, Extended Data Fig. 7f). Furthermore, expression of CA-resistant CDK8 W105M prevented upregulation of SE-associated genes by CA (Extended Data Fig. 7g). Therefore, upregulation of SE-associated genes, through Mediator kinase inhibition, could contribute to the antiproliferative activity of CA.
Growth of several AML cell lines was sensitive to CA and the BRD4 inhibitor I-BET151 (Extended Data Table 1). The opposing effects of these inhibitors on SE-associated gene expression (Fig. 3b, red ticks are SE-associated genes, Fig. 3e, Extended Data Fig. 7c), however, suggest that AML cells might depend on a precise “dosage” of SE-associated gene expression. Indeed, MOLM-14 cell growth was inhibited by either reduced or increased expression of the same SE-associated genes, many of which were upregulated by CA and downregulated by I-BET151 (Fig. 3e,f and Extended Data Fig. 7c-e,h). Despite having opposing effects on SE-associated genes, CA and I-BET151 co-treatment did not normalize transcription of these genes. Instead, I-BET151-induced transcriptional effects dominated, suggesting a dependence on BRD4 for CA-induced transcription (Fig. 3e and Extended Data Fig. 7c). Consistent with this, I-BET151 caused reduced occupancy of BRD4 and CDK8 on enhancer regions, and CA and I-BET151 co-treatment inhibited MOLM-14 cell growth (Extended Data Fig. 7i,j).
We extended our gene expression, ChIP-seq, and SE analysis to additional cell lines that were sensitive (SET-2 and MV4;11) and insensitive (HCT116 and K562) to CA and found that only the sensitive cell lines showed statistically significant enrichment of SE-associated genes among those upregulated by CA (Fig. 3g). These results support upregulation of SE-associated genes as contributing to the antiproliferative effects of CA. However, we cannot exclude the contribution of other factors.
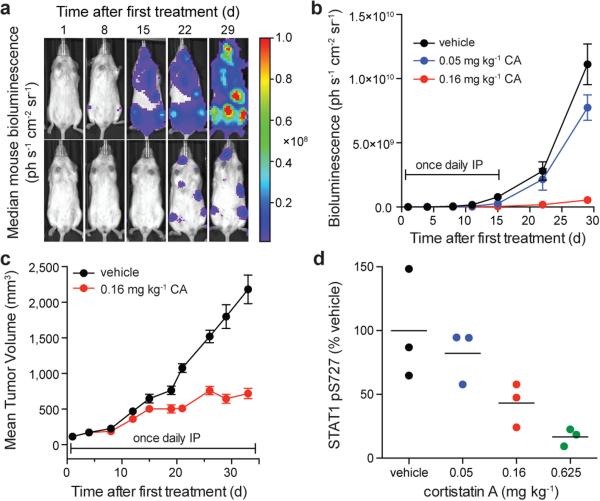
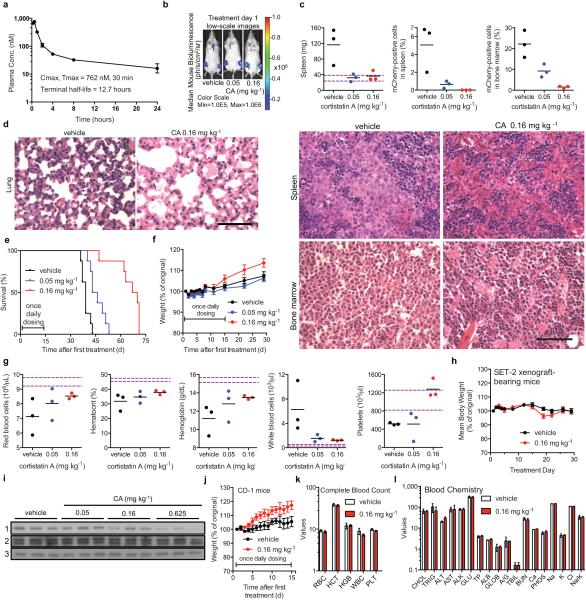
Finally, we assessed CA's in vivo antileukaemic activity. We first determined that CA had acceptable pharmacokinetic properties in mice for once-daily intraperitoneal (IP) dosing (Extended Data Fig. 8a) and then measured its efficacy in a disseminated human AML model21. CA afforded a dose-dependent reduction in disease progression (p < 0.0001), spleen weight, leukaemia cell burden, and survival (29.5-day median extension in survival, p < 0.0001, Fig. 4a,b and Extended Data Fig. 8b-e). Efficacious dosing was well-tolerated, with no loss in body weight or deleterious effects in peripheral blood of leukaemia-bearing or healthy, immunocompetent (CD-1) mice (Extended Fig. 8f,g,j-l). In a second AML model using SET-2 cells, CA afforded a 71% tumour volume reduction, also with no loss in body weight (Fig. 4c, Extended Data Fig. 8h). We confirmed that CA inhibited CDK8 in vivo by observing a dose-dependent reduction in STAT1 S727 phosphorylation in NK cells, which have CDK8-dependent constitutively phosphorylated STAT1 S727 (Fig. 4d, Extended Data Fig. 8i)22.
Figure 4. CA inhibits AML progression and CDK8 in vivo.
(a) Bioluminescent images of mice bearing MV4;11 leukaemia cells. Mouse with median bioluminescence shown, treatment as in (b). Color scale 1.00×10⁶ to 1.00×10⁸. (b) Mean ± s.e.m., n=11 mice; p < 0.0001 for both doses on day 33 vs. vehicle, two-way ANOVA. (c) Mice harbouring SET-2 AML xenograft tumours and treated as indicated. Mean ± s.e.m., n=10 mice; 71% tumour growth inhibition on day 33, p < 0.0001, two-tailed t-test. (d) Densitometric analysis of STAT1 pS727 in NK cells isolated from the spleen of C57BL/6 mice treated with CA or vehicle (n=3 mice), STAT1 pS727 normalized to actin, p = 0.011 for 0.625 mg kg−1, one-way ANOVA, experiment performed once.
Although SE-associated genes are expressed at high levels, our results with CA show that a subset is restrained from even higher expression by Mediator kinase activity. CA's specificity, potency, favourable pharmacokinetics and long residence time make it a useful in vitro and in vivo probe of Mediator kinases and a promising lead for development of therapeutics.
Methods
Cell Culture
All media was supplemented with 100 U/mL penicillin and 100 μg/mL streptomycin. Cell line media: MV4;11, RS4;11, K562, HEL, MOLM-14, MEG-01 in RPMI-1640, 10% FBS; SET-2 in RPMI-1640, 20% FBS; UKE-1 in RPMI-1640, 10% FBS, 10% horse serum and 1 μM hydrocortisone; SKNO-1 and TF-1 in RPMI-1640, 10% FBS, and 10 or 2 ng/mL GM-CSF, respectively; HaCaT in DMEM, 10% FBS; and HCT116 in McCoy's 5A, 10% FBS (proliferation assay) or DMEM, 10% FBS (gene expression study). Sources: HepG2, MV4;11, RS4;11, MEG-01, TF-1, HCT116 and K562 from ATCC; SKNO-1 from DSMZ; HEL, UKE-1 and SET-2 from Ross Levine; and HaCaT, MV4;11-mCLP, and MOLM-14 from Van Wilson, Andrew Kung, and Scott Armstrong, respectively. MOLM-14 cells were authenticated by STR profiling and flow cytometry. All cell lines were routinely tested for mycoplasma.
Reagents
Compounds were stored under argon at –80 °C in 100% DMSO. Vehicle represents 0.1% DMSO unless otherwise specified. Sources: IFN-γ (PHC4031, Life Technologies), TGF-β1 (R&D Systems), paclitaxel (LC Laboratories), I-BET151 (Tocris), PMA (Calbiochem), and doxorubicin and puromycin (Sigma-Aldrich). Immunoblot antibodies: anti-FLAG (F1804), anti-Actin (A5060) and anti-CDK19 (HPA007053) from Sigma-Aldrich; anti-Smad2/3 (8685), anti-Smad2 pTail (3108), anti-STAT1 (9172), anti-phospho-STAT1 Tyr701 (9170) and anti-phospho-STAT1 Ser727 (9177), anti-CEBPA (2843), anti-ROCK1 (4035), anti-ROCK2 (9029), anti-CDK8 (4101), anti-caspase-3 (9662) anti-PARP (9532) and anti-CDK9 (2316) from Cell Signaling Technology (CST); anti-phospho-Smad2/3 T220/T179 (600-401-C48) from Rockland; anti-CDK12 (NB100-87012) and anti-CDK13 (NB100-68268) from Novus; and anti-CDK8 (A302-501A) and anti-Haspin (A302-241A) from Bethyl. ChIP antibodies: RNA pol II (Rpb1 N terminus, sc-899X lot B2713) from Santa Cruz; MED1 (A300-793A lot A300-793A-2), BRD4 (A301-985A lot A301-985A50-3), and CDK8 (A302-500A lot A302-500A-1) from Bethyl; and H3K4me3 (ab8580 lot 1308511), H3K27Ac (ab4729 lot GR104852-1), and H3K4me1 (ab8895 lot GR61306-1) from Abcam.
Kinase Assays
Data was quantified with ImageJ and plotted and fitted with GraphPad Prism 6.0. For STAT1 transactivation domain (TAD), 750 ng of GST-STAT1 TAD (residues 639-750) was incubated with ~50 ng recombinant CDK8 module at 30 °C for 8 min in kinase buffer (25 mM Tris pH 8, 2 mM DTT, 100 μM cold ATP, 100 mM KCl, 10 mM MgCl2 and 2.5 μCi [γ-32P] ATP (Perkin Elmer) per reaction). The assay included 2.5% DMSO, which did not inhibit kinase activity. 12% SDS-PAGE gels were subsequently silver stained, exposed for 18 h on a Phosphor Screen and imaged (Typhoon 9400, GE Life Sciences). For pol II CTD, 400 ng of GST-CTD (murine sequence) was incubated with ~40 ng recombinant CDK8 module, 25 ng TFIIH, or 40 ng P-TEFb at 30°C for 60 min in kinase buffer. Kinase amounts were chosen to give similar total pol II CTD signal. 9% SDS-PAGE gels were silver stained and exposed as above. In vitro FLAG-CDK8 kinase assays used ~40 ng kinase and 500 ng GST-CTD. CDK12(714-1063):CycK(1-267) and CDK13(694-1039):CycK (1-267) were expressed in insect cells and used at ~500 nM per reaction. These regions of CDK12/13 encompass the kinase domains (including the C-terminal extension helix) and the cyclin boxes, and are fully phosphorylated in the T-loop. For STAT1 or Smad2/3, cells were treated with compound for 1 h followed by IFN-γ or TGF-β1 for 1 h, then washed twice with cold PBS, and lysed (RIPA buffer with inhibitors R0278, P8340, P0044, P5762 Sigma-Aldrich). Standard immunoblotting followed. All experiments were performed twice.
Protein purification
Buffers for purification and elution of recombinant proteins included 0.25 mM PMSF, 1 mM DTT, 1 mM benzamidine, and 1 mM sodium metabisulfite. TFIIH was captured from HeLa nuclear extract using a monoclonal antibody for the p89 subunit immobilized to Protein A Sepharose (GE). Final purification of peptide-eluted TFIIH was performed on a 1 mL HiTrap Heparin HP (GE) resulting in 0.1-0.2 μM TFIIH. P-TEFb was purified as described 23 with a Superdex 200 polishing resulting in ~0.5 μM P-TEFb.Recombinant CDK8 module was purified as described24 with omission of the glycerol gradient.STAT1 TAD and pol II CTD were expressed as N-terminal GST fusion proteins in E. coli BL21-CodonPlus cells to OD600 0.5, then induced with 0.5 mM IPTG for 4 h at 30 °C and batch affinity purified with Glutathione Sepharose 4B (GE). Cells were lysed in H/E buffer (50 mM Tris pH 7.9, 0.5 M NaCl, 0.5 mM EDTA, 10% glycerol, 0.5% NP-40), immobilized on Glutathione Sepharose 4B in H/E buffer for 3 h at 4 °C, washed with ~100 column volumes (CV's) of High Salt Buffer (50 mM Tris pH 7.9, 1 M NaCl, 0.5 mM EDTA, 0.5% NP-40, 8 mM CHAPS), 0.5 M HEGN (20 mM HEPES pH 7.6, 0.5 M KCl, 0.1 mM EDTA, 10% glycerol, 0.02% NP-40) and 0.15M HEGN (20 mM HEPES pH 7.6, 0.15 M KCl, 0.1 mM EDTA, 10% glycerol, 0.02% NP-40). Fusion proteins were eluted in 2 × CV's of 30 mM reduced L-glutathione in GSH elution buffer (80 mM Tris pH 7.9, 0.15 M KCl, 0.1 mM EDTA, 10% glycerol, 0.02% NP-40). The GST-pol II-CTD was further purified by Superdex 200 polishing. FLAG-CDK8 WT and W105M mutants were expressed in MOLM-14 cells, captured using anti-FLAG M2 affinity resin (Sigma-Aldrich), and eluted with 1 mg/mL FLAG peptide in 0.15 M HEGN in 1 × CV twice. FLAG peptide elutions were stained with SYPRO Ruby to standardize kinase amounts. Purifications contained Cyclin C but not MED12 or MED13 (data not shown).
Native Kinase Capture Immunoblot and Native Kinome-wide Profiling
Experiments were performed as previously described15,25. 5 × 10⁸ MOLM-14 cells were washed twice with 10 mL cold PBS and resuspended in 1 mL cold kinase buffer (20 mM HEPES pH 7.4, 150 mM NaCl, 0.5% Triton X-100, with inhibitors 11697498001, Roche and P5726, Sigma). Cells were lysed by sonication (2 × 10 s pulses with a 30 s break) and centrifuged (16,000 × g, 10 min). The supernatant was desalted through a column (732-2010, Biorad) and the eluted lysate was diluted to 5 mg/ml with kinase buffer. For each treatment, 475 μL of the lysate was pre-incubated with 10 μL MnCl2 (1 M) and 5 μL compound to the desired concentration at room temperature for 30 min. Uninhibited kinases were captured with 10 μL ActivX desthiobiotin-ATP probe (0.25 mM; 88311, Pierce) at room temperature for 10 min. Samples were mixed with 500 μL urea (8 M; 818710, Millipore) and 50 μL streptavidin agarose (20359, Thermo) for 60 min at room temperature on a nutator. Beads were washed twice with a 1:1 mixture of kinase buffer and 8 M urea, and collected by centrifugation (1,000 × g, 1 min). Proteins were eluted from the beads with 100 μL 2× LDS sample buffer (NP0007, Life) at 95 °C for 10 min. Samples were analysed by standard immunoblotting and HRP detection. Experiment was performed twice. Native kinome profiling was performed with MOLM-14 cell lysate according to the KiNativ Method by ActivX Biosciences. For each peptide quantitated, the change in MS signal for the treated samples relative the MS signal for the control samples was expressed as percentage inhibition. The results correspond to one experiment of duplicates for each CA concentration. The percentage changes in MS signal reported are statistically significant (Student T-test score <0.04).
Recombinant Kinome-wide Selectivity Profiling and IC50 determination
A radiometric protein kinase assay was used (PanQinase activity assay; performed by ProQinase GmbH) as described26. IC50 determination for CDK8/CCNC (8.3 nM with 1.0 μM ATP and 1.0 μg/50uL of substrate RBER-IRStide) was performed as duplicate measurements and IC50 was calculated using Prism 5.04 with sigmoidal response, top fixed at 100% and bottom at 0% with least-squares fitting.
Binding and Kinetics
Measurements listed were made using the Proteros reporter displacement assay as previously described27. 0.62 nM CDK8/CCNC was preincubated with a reporter probe at a concentration equal to its binding affinity (Kd) in 20 mM MOPS [pH 7.0], 1 mM DTT, and 0.01% Tween20 (final reaction volume 10 μl in black polypropylene U bottom plates, Corning 4514). After transfer of serially diluted CA, probe displacement was monitored for 60 min. Kd values were calculated using the Cheng-Prusoff equation from the IC50 values obtained from the percentage displacement values at the last time point measured. Association rate constant was calculated from the decay rate of probe displacement. Dissociation rate constant was determined as the product of Kd × association rate constant. Residence time was calculated as 1/koff. Error was determined by Gaussian error propagation from the IC50 error. Experiment was performed once.
Crystallization, Data Collection, and Refinement
Human CDK8/CCNC were expressed and purified as previously described27. Co-crystals at a protein concentration of 11.3 mg/ml with 1 mM CA were obtained in 20% PEG 3350 and 0.20 M sodium formate at 20° C and shock-frozen with 25% ethylene glycol as cryoprotectant. Diffraction data were collected at the SWISS LIGHT SOURCE (SLS, Villigen, Switzerland), beamline X06SA with a wavelength of 1.00004 Å at 100 K, and processed using XDS and XSCALE28. The structure was solved by molecular replacement 29, subsequent model building and refinement (including TLS refinement) was performed with COOT30 and CCP431,32. The Rfree validation was based on a subset of about 3.4% of the reflections omitted during refinement. Waters were included at stereochemically reasonable sites. Final refinement cycles led to a model with Rwork value 21.7% and Rfree value 26.6%. All main-chain angles of non-glycine residues fall into the conformationally most favoured (93.2%), additionally allowed (6.6%) or generously allowed (0.2%) regions of the Ramachandran plot. Graphical figures were prepared using PyMOL33. Values in parenthesis in Extended Data Table 2 refer to the highest resolution-shell.
Cell Growth Assay
All suspension cells were plated (96-well) in triplicate at 5,000 to 30,000 cells/well for testing (n = 3). Viable cell number was estimated after 3, 7, and 10 days by counting viable cells from one vehicle well, generating a cell dilution series, transferring 20 μL/well in duplicate to a 384-well plate, and performing a linear regression to CellTiter-Glo (Promega) response (SPECTRAmax M3, Molecular Devices). Cells from all wells were also 4-fold diluted in media and transferred in duplicate for CellTiter-Glo measurement. On days 3 and 7, an equal volume for all wells were split-back with fresh media and compound, such that the resulting cell density for the vehicle well matched the initial seeding density. For days 7 and 10, estimated cell number represents the split-adjusted theoretical cell number. HCT116 were plated (96-well) in triplicate at 250 cells/well. Cells were incubated in the presence of vehicle, 1 μM paclitaxel, or compound. On day 7, CellTiter-Blue (Promega) response was measured and values were normalized to vehicle (100% growth) and paclitaxel (0% growth). For growth assays with inhibitors, n=3 for each concentration with two independent experiments, averaged for Extended Data Table 1, and one experiment shown for graphs of percent growth vs. concentration and time, Fig. 2e and Extended Data Fig. 4a.
Flow Cytometric Analysis
Cells were plated (6-well) in triplicate at 150,000 cells/mL for 1-day, 2-day, and 3-day timepoints. For the 6-day timepoint, cells were plated at 35,000 cells/mL and diluted to 150,000 cells/mL with media and compound on day 4. For cell cycle, cells were washed twice with PBS, fixed with 70% ethanol at 4 °C overnight, washed with PBS, and stained with 50 μg/mL propidium iodide (eBioscience) for 1 h at 37°C. For apoptosis, cells were stained using Annexin V-FITC (BD Pharmingen) and 7-AAD (Miltenyi Biotec). Samples were acquired on a BD LSR II and analysed using FlowJo v7.6.5. For the SET-2 differentiation assay, cells were cultured in triplicate with either 50 nM CA, 50 ng/mL PMA (positive control), or vehicle for three days. Cell pellets were collected at 4°C, washed three times with cold PBS, and stained with anti-CD61-PE (ab91128) or anti-CD41-PerCP (ab134373). For each experiment, n=3 biological replicates with two independent experiments and one shown.
Plasmids, Mutagenesis, Packaging, Transduction, Selection, and siRNA
5'-FLAG-tagged CDK8 and CDK19 were cloned from pBabe.puro.CDK8.flag34 (Addgene 19758) and F-CDK8L (Addgene 24762) into pLVX-EF1alpha-IRES-mCherry and pLVX-EF1alpha-IRES-ZsGreen (Clontech) and transformed into E. coli (One Shot Stbl3, Invitrogen). Point mutations were introduced by whole plasmid PCR (QuikChange II XL Site-Directed Mutagenesis Kit, Agilent). pLVX lentiviral vectors were co-transfected with psPASx and pMD2.G (Addgene) in 293T cells. After 48 h, viral supernatants were collected and passed through a 0.45 μm filter (Millipore). For transductions, 24-well plates were coated with 500 μL of 20 μg/ml RetroNectin (Clontech) at 4°C overnight, blocked with 2% BSA for 30 minutes, washed with PBS, and 300-500 μL of viral supernatant was added. The plates were centrifuged (2000 × g, 1.5 h) and then set in an incubator. After 2 h, viral supernatant was removed and 500 μL/well of 200,000 cells/mL was added. After 1-3 days, the cells were expanded and isolated by FACS. FLAG-CEBPA (gift from Jarrod Marto), FLAG-IRF1 (PlasmID, HMS, HsCD00045286), FLAG-IRF8 (PlasmID HMS, HsCD00438293), ETV6-Myc-FLAG (Origene, SC118922), CDKN1b-Myc-FLAG (Origene, SC117607), and FOSL2-Myc-FLAG (Origene, SC110898) were cloned into the Tet-On inducible system pLVX-TRE3G-mCherry or pLVX-TRE3G-ZsGreen (Clontech), transformed into E. coli (Stellar Competent Cells, Clontech), packaged into lentiviral vectors and cotransduced with regulator vector pLVX-EF1a-Tet3G. After one week of selection with puromycin (1 μg/ml) and G418 (400 μg/ml), cells were plated in the presence of 100 ng/mL doxycycline to assess 7-day growth via Cell-Titer Glo. SiRNA against CEBPA (Ambion s2888), IRF1 (Ambion s7501), ETV6 (Ambion s4867 and s4866), FOSL2 (Ambion s5345), and IRF8 (Ambion s7098) or scrambled control (Ambion 4390843) were introduced into cells by electroporation (Amaxa Nucleofector II, Program T-019). After 24 hours, cells were plated to assess 3 or 4-day growth via Cell-Titer Glo. Knockdown efficiency was assessed after 24 hours by immunoblot or after 48 hours by ddPCR. Results shown in Fig. 3g represent a single transduction or a single electroporation. SiRNA electroporation and inducible expression cell growth assays were performed 2-6 times. For ETV6, two siRNAs were tested with data for siRNA s4867 shown in figures.
Gene Expression, Gene Ontology and GSEA
Leukaemia cells were plated (12-well) in triplicate at 500,000 to 800,000 cells/mL and incubated in the presence of vehicle or CA (25 nM 3 h for K562, MOLM-14 and MV4;11; 10 nM 24 h for MOLM-14; 25 nM 4 h for SET-2, n=3 for each cell line). Cells were then washed twice with cold PBS, and snap frozen. RNA was isolated (RNeasy Plus Microkit, Qiagen or TRIzol, Life Technologies), processed, and, for K562, MOLM-14, and MV4;11, hybridized to the Human U133 Plus 2.0 microarray (Affymetrix). Microarrays were processed with Bioconductor packages affyQCReport 35 for quality control and affy for background correction, summarization, and normalization using rma36. Probe sets present in at least 1 sample (based on affy mas5call) and for which the interquartile range was >log2(1.2) were retained for further analysis. The limma Bioconductor package37 was used for differential expression (DE) analysis of CA-treated vs DMSO control samples (Benjamini-Hochberg38 adjusted p-value <0.05). SET-2 and HCT116 gene expression was measured by RNA-seq. SET-2 RNA-seq libraries were prepared and processed using the Ion Torrent workflow. Reads were aligned in two passes, first with rnaStar 39 (v.2.3.0e) then with BWA40 (v.0.7.5a) for remaining unmapped reads, both using default parameters. Mapped reads were merged and counted using HTSeq41 (v.0.5.3p3) with -s yes -m intersection-strict. The Bioconductor package DESeq42 was used for DE analysis (FDR < 0.05 and 2-fold change) and normalization. HCT116 cells were grown to approximately 80% confluence and were treated with either 100 nM CA or DMSO for 3 h (n=3). Cells were then washed twice with cold PBS and scraped into TRIzol reagent (Life Technologies). After harvesting the RNA, it was further purified using an RNeasy mini kit (Qiagen) with an on-column DNase I digestion. Libraries for Illumina sequencing were generated via the Illumina TruSEQ stranded mRNA prep kit. Samples were run in a single lane on an Illumina HiSEQ 2000 sequencer with a single read flow cell using 1x 50bp reads and a 6-cycle index read. Reads were mapped to the hg19 reference genome using Tophat2 v. 2.0.6 with custom settings including the setting of –-library-type fr-firstrand to appropriately account for the stranded nature of the protocol. HTSeq v. 0.6.1 was used to obtain read counts over annotated genes and differentially expressed genes were called by DESeq v. 1.10.1 with a padj value of less than 0.01. Counts were normalized for GSEA using the limma voom function 43. Expression data for the I-BET151 comparison were downloaded from ArrayExpress (https://www.ebi.ac.uk/arrayexpress/, accession:E-MTAB-774) and processed files used as is. Gene lists were submitted to the DAVID web server (http://david.abcc.ncifcrf.gov) for functional annotation44. GSEA version 2.0919 was carried out using signal-to-noise on natural values as the metric. Signatures included curated gene sets (C2, v.3) downloaded from the Broad's MSigDB as well as signatures curated from in-house and published data sets.
ChIP-seq
Untreated cells or cells treated with CA (25 nM, 6 h), iBET-151 (500 nM, 6 h) or vehicle were crosslinked for 10 min at room temperature by addition of one-tenth of the volume of formaldehyde solution (11% formaldehyde, 50 mM HEPES pH 7.4, 100 mM NaCl, 1 mM EDTA, 0.5 mM EGTA) to the media followed by 5 min quenching with 125 mM glycine. For CDK8 and MED1 ChIPs, cells were instead centrifuged, resuspended in serum-free media, and crosslinked at room temperature by addition of an equal volume of 2% formaldehyde in serum-free media for 10 min followed by quenching with 125 mM glycine for 5 min. Cells were then washed twice with cold PBS and snap frozen. ChIP was performed essentially as previously described2. Briefly, cells were lysed with lysis buffer 1 (50 mM HEPES pH 7.4, 140 mM NaCl, 1 mM EDTA, 10% glycerol, 0.5% NP-40, and 25% Triton X-100) and washed with lysis buffer 2 (10 mM Tris-HCl pH 8.0, 200 mM NaCl, 1 mM EDTA, and 0.5 mM EGTA). For H3K4me3, H3K27me3, H3K27Ac, H3K4me1, and pol II, the nuclei were resuspended in 10 mM Tris-HCl pH 8.0, 100 mM NaCl, 1 mM EDTA pH 8.0, 0.5 mM EGTA, 0.1% Na-deoxycholate, and 0.2% SDS, sheared for 2 min (Branson S220D sonifier, pulse, 0.7 s on, 1.3 s off, 12-14 watts) on wet ice, and then Triton X-100 was added to 1% v/v. For MED1 and CDK8, the nuclei were resuspended in 50 mM Tris-HCl pH 7.5, 140 mM NaCl, 1 mM EDTA, 1 mM EGTA, 0.1% SDS, and 1% Triton X-100 then sheared for 4 min (pulse, 0.7 s on, 1.3 s off, 10-12 watts) on wet ice. Sonicated lysates were cleared and incubated overnight at 4 °C with Protein G magnetic Dynal beads (50 μL) pre-bound with the indicated antibodies (5 μg). Beads were washed with sonication buffer, sonication buffer with 500 mM NaCl, LiCl wash buffer (20 mM Tris-HCl pH 8.0, 1 mM EDTA, 250 mM LiCl, 0.5% NP-40, 0.5% sodium deoxycholate,) and TE. Bound complexes were eluted with 50 mM Tris-HCl pH 8.0, 10 mM EDTA, 1% SDS at 65 °C and reverse crosslinked at 65°C. RNA and protein were digested using RNAse A and proteinase K, respectively, and DNA was purified using Qiagen MinElute columns. Libraries for Illumina sequencing were prepared using the Illumina TruSeq ChIP Sample Preparation kit with the following exceptions. After end-repair and A-tailing, ChIP DNA or whole cell extract DNA was ligated to Illumina RNA adaptors with unique indices. Alternatively, libraries were prepared using the KAPA Hyper Prep Kit for Illumina and ligated to unique Bioo Scientific NEXTflex barcode adaptors. Following ligation, libraries were amplified with 16-18 cycles of PCR and were then size-selected using a 2% gel cassette in the Pippin Prep System from Sage Science. For histone modifications and RNA pol II, DNA fragments of size 200-500bp were captured. For CDK8 and MED1, DNA fragments of size 200-450bp were captured. Libraries were quantified by qPCR utilizing the KAPA Biosystems Illumina Library Quantification kit. Libraries with distinct indexes were then combined in equimolar ratios and run together in a lane on the Illumina HiSeq 2500 for 40 bases in single read mode.
ChIP-seq Data Analysis
ChIP-seq data sets were aligned using Bowtie (v0.12.8)45 to build version NCBI37/HG19 of the human genome (-n 1 -m 1 --best --strata). Duplicate reads were removed using Picard tools (version 1.88). For CDK8, peaks were called with both SPP46 and MACS version 1.447 using default significance cut-off values. SPP cross-correlation analysis was used for both quality control48 and to set the strand shift parameter for MACS. Regions of interest identified by both peak callers were retained and merged. Regions overlapping >70% with RepeatMasker regions (downloaded Nov. 16, 2012 from UCSC) were excluded from further analysis. Retained regions were annotated by overlap with RefSeq genes (genomic coordinates downloaded from UCSC refgene table Apr. 26, 2013) using bedtools49. Retained regions were assigned to one of the following categories: (1) promoter = TSS-500bp to TSS+200bp, (2) body = TSS+201bp to TES, (3) proximal enhancer = TSS-5kb to TSS-501bp, and (4) 3' UTR = TES+1bp to TES+5kb. All other regions were termed “desert” hits. Any gene satisfying the overlap criteria was included in the corresponding category. Traveling ratios were calculated essentially as described50. Briefly, mapped read coordinates were first extended 3' to 200 bases to capture the full fragment coverage. The RefSeq coordinates used for annotation were then used to count extended pol II reads falling in the range of TSS-30bp to TSS+300bp and those falling in the remainder of the gene body (TSS+301 to TES). Very short transcripts (<630bp) were excluded, as were cases with very low counts in both regions. Input reads were subtracted and counts were scaled to reads per kilobase. Transcripts sharing identical TSS and TES coordinates were represented a single time in the count statistics. ChIP-seq tracks were smoothed by calculating the density per million mapped reads in 300bp bins at 50bp intervals and were visualized using Integrative Genomics Viewer. ChIP-seq density maps were generated using ngsplot (v2.08)51. Heatmap of semi-supervised clustering in Fig. 1a of total signal on CDK8 positive regions was carried out as follows: (1) peaks were individually identified for each of the 6 ChIPs using MACS2 at default p-value cutoff; (2) all peaks were combined and merged into non-redundant regions using mergeBed (-d 0); (3) within each unique region, ChIP reads were counted and matched input reads were subtracted after scaling each to million mapped reads; (4) clusters were grouped by ChIPs represented in a given region into 64 categories in the following order : H3K4me1, H3K27ac, Pol II, MED1, and BRD4; (5) each group was ordered by decreasing CDK8 signal per region; and (6) ChIP samples were clustered by Euclidean distance of ChIP signal per region after median centring and normalization. A similar approach was used for BRD4 and CDK8 ChIPs in MOLM-14 cells treated with DMSO or I-BET151. In this case, non-promoter-associated regions in which I-BET151 treatment reduced BRD4 signal > 2-fold were ordered by log2 fold-change.
Irreproducibility Discovery Rate (IDR) Analysis
Reproducibility of two independent H3K27Ac ChIP-seq experiments carried out in cells treated with either DMSO or CA for 3hrs was assessed according to the pipeline developed for the ENCODE project (https://sites.google.com/site/anshulkundaje/projects/idr) 52. IDR was determined as recommended on peaks called by SPP46 at FDR < 0.5. At this threshold, SPP reported between 180,000 and 300,000 peaks, depending on the exact combination of sample and input, most of which are expected to be noise. Under both treatment conditions, the number of high-confidence peaks (IDR threshold < 0.01 for true replicates and pseudo-replicate self-consistency tests and < 0.0025 for pseudo-replicate pooled-consistency analysis) identified based on signal value in the replicates and pseudo-replicates was within the recommended 2-fold range, indicating good reproducibility. The number of peaks with IDR < 0.01 in the true replicates was used to make the final selection of distinct, non-chrM pooled replicate peaks. Regions within 200nt of each other were merged to generate the final peaks list. The same approach was used to determine reproducible peaks in two independent BRD4 and CDK8 ChIP experiments in MOLM-14 cells treated with DMSO or I-BET151.
Identification of SEs
MED1 signal was measured in active enhancers (i.e., regions enriched in both H3K4me1 and H3K27ac) after extending MED1 ChIP-seq reads 100 bases in a strand-aware fashion. Enhancer regions were sorted based on their MED1 signal and the inflection point of the curve determined. Enhancers with MED1 signal above the inflection point were retained as SEs2. In a separate approach, using only the MED1 ChIP-seq data and the ROSE software from the Young laboratory1, we found > 80% agreement with our K4me1+/K27ac+ MED1 SEs. ROSE was used thereafter to identify SEs using BRD4, H3K27ac (± CA, 3 h), and CDK8 ChIP-seq on peaks called by MACS 1.4. For K562 and HCT116, H3K27ac ChIP samples and their matched inputs were downloaded from the ENCODE project repository at UCSC (sample identifiers and references in Supplementary Table 1). For HCT116, CDK8 ChIP-seq data and matched input was downloaded from GSE3825853. SE-associated genes were assigned to the nearest expressed transcript, based on H3K27ac signal in a 500nt window centered on the TSS1. For Extended Data Fig. 1e, we normalized each experiment's signal (after adjusting to million mapped reads and subtracting input signal) to show values from independent ChIP-seq experiments on a common scale. Normalized signal for each enhancer, x, is thus (x - minimum)/(maximum - minimum). Each ChIP-seq experiment yielded different numbers of enhancer regions so we mapped each experiment's enhancer ranks to [0,1] by calculating (rank-1)/(maximum rank - 1).
RNA Levels, Digital Droplet PCR (ddPCR), and qRT-PCR
Total RNA was isolated from 500,000 MOLM-14 cells (RNeasy Plus Mini Kit, Qiagen) and quantified by Nanodrop. mRNA was subsequently isolated (Dynabeads mRNA Purification Kit, Life Technologies) and quantified by Nanodrop. For ddPCR, total RNA was reverse-transcribed into cDNA (High Capacity cDNA Reverse Transcriptase Kit, Applied Biosystems) and used (ddPCR Supermix for Probes, no dUTP, Bio-Rad 186-3024) with TaqMan FAM probes for genes of interest and ACTB (VIC) as the reference gene. Droplets were generated in the QX200 Droplet Generator, thermocycled, and read on the QX200 Droplet Reader. Total RNA per cell was measured by isolating total RNA from 106 cells using the mirVana miRNA Isolation Kit (Life Technologies) and quantifying by Nanodrop. The difference in copy numbers of specific mRNAs before and after treatment (Fig 3e) was determined relative to copies of ACTB mRNA per cell. Probes used (Life Technologies): CEBPA (Hs00269972_s1), ETV6 (Hs00231101_m1), IRF1 (Hs00971960_m1), IRF8 (Hs00175238_m1), RREB1 (Hs01002873_m1), CDKN1B (Hs01597588_m1), GFI1 (Hs00382207_m1), JARID2 (Hs01004460_m1), BHLHE40 (Hs01041212_m1), and ACTB (4325788). qRT-PCR for checking siRNA knockdown was performed with iTaq Universal Probes Supermix (Bio-Rad), n=3, or by ddPCR.
In Vivo Studies
Studies were performed at Charles River Laboratories (CRL) and Dana Farber Cancer Institute (DFCI) where indicated and approved by Harvard University and each institution's respective animal care and use committee. For pharmacokinetic studies, serial blood samples from 7 week old male CD-1 mice (n=3 per timepoint) were collected (no blinding) into K2EDTA tubes, centrifuged, transferred into 96-well plates (matrix tubes), stored at –20 °C, and analysed by HPLC/MS/MS (in-life performed at CRL). Study size was determined by the need for three blood samples per timepoint with three blood samples collected per mouse. The MV4;11 xenograft model were performed as previously described21 (in-life performed at DFCI) Two million MV4;11-mCLP cells were injected into the tail vein of 7-week-old female NOD-SCID-IL2Rcγnull (NSG) mice (The Jackson Laboratory) and tumour burden was assessed by bioluminescence imaging (BLI) using an IVIS Spectrum system (Caliper Life Sciences). 7 days post injection, leukaemia establishment was documented by BLI and mice were assigned to groups to achieve a similar mean BLI and treated IP with vehicle (20% hydroxypropyl-β-cyclodextrin) or CA once daily for 15 days. After 30 days, blood counts were obtained (Hemavet 950 F, Drew Scientific) and spleen, femur, and peripheral blood cells were collected and analysed by flow cytometry (LSR Fortessa, BD Biosciences) from 3 mice/group. The mice and a portion of the spleen were preserved in bouins after body cavities were opened and visceral organs exposed. Samples from all organs were then dissected and placed in 9 cassettes/mouse. Tissues were paraffin embedded, sectioned at 6 microns and stained with haematoxylin and eosin. Survival was measured as the time from therapy initiation until moribund state. We selected 11 mice per group to match previous survival analysis in the model21 (n=8) and to have 3 additional mice per group for disease burden comparison. Blinding was only done for histopathology analysis. For the SET-2 xenograft model (in-life performed at CRL), 8 to 12 week old female SCID Beige mice (Charles River) were injected subcutaneously in the flank with 107 SET-2 cells in 50% matrigel (0.2 mL/mouse). When tumours reached an average size of 80-120 mm3, mice were assigned to groups to achieve a similar mean tumour size and treatment commenced without blinding. Tumour volumes were measured using calipers and calculated as (width2 × length)/2. Percent tumour growth inhibition was calculated as mean volumes of (vehicle-treatment)/(vehicle-initial)×100. We selected 10 mice per group to safeguard against the IACUC requirement to stop dosing a group if >10% mortality occurs. For safety testing (in-life performed at DFCI), 8 week old female CD-1 mice were treated once daily without blinding for 15 days and weighed daily. Two hours after the last dose, blood counts were obtained and blood chemistry was analysed. Three mice per group were selected as a minimum for comparison. For STAT1 pS727 inhibition, 6 to 10 week old female C57BL/6 mice were treated once daily for two days (in-life at CRL, not blinded). One hour after the second dose, NK cells were isolated by dissociation of spleenocytes from isolated spleens, lysis of erythrocytes, and isolation of DX5+ cells (MiniMACS CD49b, Miltenyi Biotec) and analyzed by immunoblot and densitometry (ImageJ, STAT1 pS727 level normalized to beta-actin). We selected 3 mice per group as a minimum for comparison. Statistical analyses were performed using GraphPad Prism 6.0. For p-value determinations, two-way or one-way ANOVA was used with Dunnett's multiple comparison testing and p-value adjustment. Dotted purple lines were from the Mouse Phenome Database (The Jackson Laboratory).
Extended Data
Extended Data Figure 1. CDK8 ChIP-seq defines SE-associated genes.
(a) The antibody used for CDK8 ChIP-seq (Bethyl A302-500A) was validated by IP-western. IP was conducted with Bethyl A302-500A (2 μg) on MOLM-14 whole cell extract and Western blot (WB) was performed on split IP lysate or 5% input with either anti-CDK8 Bethyl A302-501A (left panel), anti-CDK8 Bethyl A302-500A (right panel), or normal rabbit IgG (CST, 2729), experiment performed once. (b) MED1 and CDK8 density is highly correlated on active enhancer regions marked by H3K4me1 and H3K27ac (Corr = 0.86, R2 = 0.84) in MOLM-14 cells. The pink box represents SEs. (c) Hierarchical clustering dendrogram of CDK8, MED1, BRD4, H3K27ac, RNA pol II, and H3K4me1 ChIP-seq signal. (d) Distribution of CDK8 signal with input subtracted across CDK8 bound regions. Regions to the right of inflection point are considered SEs. (e) Distribution of CDK8, MED1, BRD4, and H3K27ac signal across putative enhancer regions. Regions to the right of the distribution inflection point are considered SEs. (f) ChIP-seq profile plots centered around MED1-defined SE and regular enhancer regions. Flanking regions are 2.5kb.
Extended Data Figure 2. CA inhibition of and binding to CDK8.
(a) CA inhibition of CDK8 module phosphorylation of CDK8 and STAT1 S727 substrate (mean ± s.e.m., n=3 biological replicates, one of two experiments shown, autorad in Supplementary Figure 1). (b) CA inhibition in vitro of CDK8 module activity but not CDK12:Cyclin K or CDK13:Cyclin K activity up to 10 μM. Equal amounts (silver stain) of GST-CTD were used as the substrate in in vitro kinase assays. The amount of each kinase used was empirically determined to give approximately the same GST-CTD signal under the assay conditions. “ns” is no substrate (kinase only) and “GST-CTD-P” is phosphorylated GST-CTD. One of four experiments shown. (c) Immunoblot showing that CA selectively and dose-dependently inhibits capture of native CDK8 (IC50 ~10 nM) and CDK19 (IC50 ~ 100 nM) from MOLM-14 lysates but did not inhibit capture of CDK9, CDK12, CDK13, ROCK1, ROCK2 or GSG2. One of two experiments shown, full scan in Supplementary Figure 1. (d) Immunoblots showing CA inhibition of CDK8-dependent IFN-γ-stimulated STAT1 S727 phosphorylation in MOLM-14 cells and CA inhibition of TGF-β-stimulated Smad2 T220 and Smad3 T179 phosphorylation in HaCaT cells (IC50 < 100 nM). One of two experiments shown, full scan in Supplementary Figure 1. (e) In vitro kinase activity profiling (mean for kinase reaction, n=2 biological replicates, experiment performed once). (f,g) CA dose-dependent inhibition of (f) CDK8/CCNC complex (IC50 = 5 nM) and (g) GSG2 (IC50 = 130 nM) as measured for the (e) (n=1, experiment performed once). (h) Dendrogram representation of results shown in Fig. 2c for 1 μM CA.
Extended Data Fig. 3. CA/CDK8/CCNC ternary complex.
(a) 2.4 Å crystal structure of the human CA/CDK8/CCNC ternary complex shown as a Corey-Pauling- Koltun (CPK) model. (b) CA and neighbouring protein side chains are shown as a stick model coloured according to the chemical atom type (CA in cyan, CDK8/CCNC in grey, N in blue, O in red and S in yellow). CA is shown superimposed with the refined 2Fo -Fc electron density map contoured at 1.0 s. Hydrogen bonds are indicated as green dotted lines. (c) A portion of the CA-CDK8-CCNC crystal structure showing the CA binding pocket of CDK8 (with and without a semi-transparent surface; CA in gold, CDK8 in gray) with certain residues and CA in stick representation. Dotted red lines indicate H-bonds. Key residues and binding elements are labelled.
Extended Data Fig. 4. Antiproliferative activity of CA and I-BET151.
(a) Plots showing antiproliferative activity of CA over time for selected sensitive cell lines and concentrations (mean ± s.e.m., n=3 biological replicates, one of two experiments shown). (b) Immunoblots showing that CA inhibits CDK8-dependent IFN-γ-stimulated STAT1 S727 phosphorylation equally well in cells sensitive or insensitive to the antiproliferative activity of CA (one of two experiments shown, full scan in Supplementary Figure 1). (c) Immunoblots showing CDK8 and CDK19 levels upon 24 h CA treatment in sensitive cell lines MV4;11 and MOLM-14 (one of two experiments shown, full scan in Supplementary Figure 1). (d) CD41 and CD61 (vehicle vs. CA, p= 0.04 and 0.005, respectively, two-tailed t-test) on SET-2 cells after 3 days of indicated treatment (mean ± s.e.m., n=3 biological replicates, one of two experiments shown). (e) DNA content and Annexin V staining of indicated cell lines upon treatment with CA (mean ± s.e.m., n=3 biological replicates, one of two experiments shown). (f) Immunoblots of CA dose- and time-dependent induction of PARP and caspase-3 cleavage for indicated cell lines (one of two experiments shown, full scan in Supplementary Figure 1).
Extended Data Figure 5. Mediator kinases mediate the antiproliferative activity of CA.
(a) We evaluated point mutations to CDK8 residues lining the CA binding pocket: Ala155, His106, Asp103, and Trp105. Expression of CDK8 A155I, A155F, A155Q, H106K and D103E in MOLM-14 cells afforded only modest desensitization to CA. Differential sensitivity of MOLM-14 cells to CA upon expression of indicated mutant FLAG-CDK8 proteins (mean ± s.e.m., n=3 biological replicates, experiment performed once). (b) Immunoblots showing that FLAG-CDK8 or FLAG-CDK19 and FLAG-CDK8 W105M or FLAG-CDK19 W105M are expressed at similar levels in MOLM-14, MV4;11, and SKNO-1 cells (experiment performed once, full scan in Supplementary Figure 1). (c) Differential sensitivity of MV4;11 and SKNO-1 cells to CA upon expression of FLAG-CDK8, FLAG-CDK19, FLAG-CDK8 W105M and FLAG-CDK19 W105M, legend as in d (mean ± s.e.m., n=3 biological replicates, one of two experiments shown). (d) Control showing that expression of FLAG-CDK8 W105M or FLAG-CDK19 W105M in MOLM-14, MV4;11, and SKNO-1 cells does not confer resistance to antiproliferative agents paclitaxel and doxorubicin (mean ± s.e.m., n=3 biological replicates, one of two experiments shown). (e) Purified FLAG-CDK8 W105M and FLAG-CDK19 W105M remain catalytically active for phosphorylation of CTD in vitro but are resistant to inhibition by CA (mean ± s.e.m., n=3 biological replicates, experiment performed once). (f) Representative autorad and silver stain images supporting quantitation shown in (e). (g) Sequence alignment of human CDKs. Sequence alignment was performed on segments of CDK1-20 using Clustal Omega. The unique Trp105 residue in CDK8 and CDK19 is highlighted in red, and is absent from other CDKs (orange box). UniProt Knowledgebase entries: CDK1, P06493; CDK2, P24941; CDK3, Q00526; CDK4, P11802; CDK5, Q00535; CDK6, Q00534; CDK7, P50613; CDK8, P49336; CDK9, P50750; CDK10, Q15131; CDK11A, Q9UQ88; CDK11B, P21127; CDK12, Q9NYV4; CDK13, Q14004; CDK14, O94921; CDK15, Q96Q40; CDK16, Q00536; CDK17, Q00537; CDK18, Q07002; CDK19, Q9BWU1; CDK20, Q8IZL9.
Extended Data Fig 6. CA disproportionately affects expression of SE genes in MOLM-14 cells.
(a) GSEA plots showing positive enrichment of SE-associated genes (SE genes), defined by ChIP-seq signal for indicated factors, with 3 h CA treatment in MOLM-14 cells (differential expression vs. DMSO controls). (b) Venn diagram showing the overlap between SE genes and genes upregulated ≥1.2-fold upon 3 h CA treatment in MOLM-14 cells (“CA upregulated genes”). Numbers in red indicate the percentage of CDK8-occupied genes (peak within ±5kb of the gene). (c,d) RNA pol II ChIP-seq metagene profile plots of unchanged genes (black), SE-associated genes (SE genes, yellow), CA upregulated genes with vehicle treatment (no CA; red), and CA upregulated genes with 6 h CA treatment (with CA; blue). (e) Cumulative distribution plot of RNA pol II traveling ratio (TR) after treatment with CA (25 nM, 6 h) or vehicle across genes ≥1.2-fold downregulated by CA after 3 h (1.16-fold, p = 0.31, Kolmogorov-Smirnov test) and (f) across all genes (1.21-fold, p < 2.2 × 10⁻¹⁶, Kolmogorov-Smirnov test). (g) CA does not significantly change the total amount of RNA or mRNA in MOLM-14 or MV4;11 cells (mean ± s.e.m., n=3 biological replicates, experiment performed once) after treatment with CA (25 nM, 3 h). (h) Global levels of RNA pol II pS2 or RNA pol II pS5 do not change after treatment with CA by immunoblot analysis. Flavopiridol (FP) was used at 300 nM as a positive control (experiment performed twice, full scan in Supplementary Figure 1).
Extended Data Figure 7. Effects of SE-associated gene expression levels on MOLM-14 AML cell proliferation.
(a) Venn diagram showing overlap between CA upregulated genes and CD14+ master TFs. Overlapping genes are listed; SE-associated genes identified by one (purple) or more (red) marks in MOLM-14 are indicated. (b) GSEA plot showing positive enrichment of CD14+ master TFs upon 3 h CA treatment (MOLM-14 differential expression). (c) Fold-change in mRNA copies per cell of selected SE-associated genes upon 3 h treatment with 100 nM CA, 500 nM I-BET151 or 3 h I-BET151 followed by addition of CA for 3 h (mean ± s.e.m., n=3 biological replicates, experiment performed twice). (d,h) mRNA expression levels (d) either 1 day (FLAG-IRF1, FLAG-IRF8) or 3 days (FLAG-CDKN1B, FLAG-FOSL2, FLAG-ETV6) after induction with doxycycline or (h) 2 days after siRNA electroporation (mean, Poisson error, n = 15,000-20,000 technical replicates, experiment performed twice) corresponding to Fig. 3f. (e) Immunoblot showing protein levels of CEBPA 4 days after siRNA electroporation or 1 day after doxycycline-induced expression (experiment performed once) corresponding to Fig. 3f, full scan in Supplementary Figure 1. (f) ChIP-seq binding profiles at the FOSL2 and ETV6 loci. (g) mRNA levels of indicated genes in MOLM-14 cells expressing FLAG-CDK8 (grey) or FLAG-CDK8 W105M (red) after 3 h 25 nM CA treatment (mean ± s.e.m., n=3 biological replicates, one of two experiments shown) (i) Heatmaps showing BRD4 and CDK8 ChIP-seq on regions depleted of BRD4 >2-fold upon I-BET151 treatment for 6 h before and after drug treatment. (j) Effect of 3-day treatment with CA, I-BET151 or the combination of CA and I-BET151 on proliferation of MOLM-14 (mean ± s.e.m., n=6 biological replicates, one of two experiments shown).
Extended Data Figure 8. CA inhibits AML progression and CDK8 in vivo and is well-tolerated at its efficacious dose.
(a) Plasma concentration of CA following single IP administration of 1 mg kg−1 CA to male CD-1 mice (mean ± s.e.m., n=3 mice, experiment performed once). (b-g) MV4;11 disseminated leukaemia study (experiment performed once). (b) Bioluminescence images with the median bioluminescence for each treatment group on treatment day 1, showing engraftment of MV4;11 leukaemia cells. (c) 30 days after treatment initiation, the mouse with the highest, lowest, and median day 29 bioluminescence for each treatment group was sacrificed and the spleen weight (p < 0.05) and percentage of MV4;11 cells (mCherry-positive) in the spleen (p < 0.03) and femur bone marrow (p < 0.02) was determined (n=3 mice). Dotted purple lines mark the range within 1 s.d. of the mean for healthy 8-week old female NSG mice, p-values determined by one-way ANOVA, each treatment vs. vehicle. (d) Hematoxylin and eosin staining of day 30 lung, spleen, and bone marrow samples of the median mice in (c). Hypercellular alveoli, evidence of leukaemia infiltration, are only observable with vehicle treatment. Spleen sample from the vehicle-treated mouse reveals a large population of cells with a round nucleus and relatively abundant cytoplasm. Similarly, all cells in the vehicle-treated bone marrow have round to oval nuclei and abundant cytoplasm, while normal erythroid or myeloid cells are not observed, suggesting that the spleen and the bone marrow have been dominated by the leukaemia cells. In contrast, the red pulp from the CA-treated mouse spleen shows a heterogeneous population of mature red blood cells, nucleated red blood cells, immature myeloid cells and megakaryocytes. The bone marrow from a CA-treated mouse also exhibits a mixture of erythroid precursors, myeloid precursors, and megakaryocytes. Scale bars, 250 μm. (e) Kaplan-Meier survival analysis (n=8 mice, p < 0.0001, log-rank test). (f) Mean body weight ± s.e.m., n=11 mice, for study in Fig. 4b. (g) Complete blood count (CBC) analysis 30 days after first treatment for the mice analysed in (c) (n=3 mice). Dotted purple lines mark the range within 1 s.d. of mean for healthy 8-week old female NSG mice. (h) Mean body weight ± s.e.m., n=10 mice, for study in Fig. 4c (experiment performed once). (i) Immunoblot of NK cell lysate from C57BL/6 mice treated as indicated in Fig. 4d. Each lane represents a distinct mouse sample with 1 = STAT1 pS727, 2 = STAT1, and 3 = β-actin (experiment performed once, full scan in Supplementary Figure 1). (j) Body weight, (k) day 15 CBC, and (l) day 15 blood chemistry for healthy CD-1 mice (n=3 mice, experiment performed once) treated with vehicle (20% hydroxypropyl-β-cyclodextrin) or 0.16 mg kg−1 CA IP once daily for 15 days. (k) RBC, Red Blood Cells (x106 cells/μL); HCT, Hematocrit (%); HGB, Hemoglobin (g/dL); WBC, White Blood Cells (x103 cells/μL); and PLT, Platelets (x105 platelets/μL). (l) CHOL, Total Cholesterol (mg/dL); TRIG, Triglycerides (mg/dL); ALT Alanine Aminotransferase (U/L); AST Aspartate Aminotransferase (U/L); ALK, Alkaline Phosphatase (U/L); GLU, Glucose (mg/dL); TP Total Protein (g/dL); ALB, Albumin (g/dL); GLOB, Globulin (calculated, g/dL); ALB, Albumin (g/dL); A/G, Albumin/Globulin; TBIL, Total Bilirubin (mg/dL); BUN, Urea Nitrogen (mg/dL); Ca, Total Calcium (mg/dL); PHOS, Phosphorus (mg/dL); Na, Sodium (mEq/L); K, Potassium (mEq/L); Cl, Chloride (mEq/L); and Na/K, Sodium/Potassium.
Extended Data Table 1. GI50 Values for Antiproliferative activity of CA and I-BET151.
CA and I-BET151 mean 50% growth inhibition (GI50) of human cell lines after 10 and 3 days treatment, respectively, and of HCT116 cells after 7 days (n=2 independent experiments with 3 biological replicates each).
| Cell Line | Malignancy | Mutation | GI50 (nM) | |
|---|---|---|---|---|
| CA | I-BET151 | |||
| SKNO-1 | AML | AML1-ETO | 1 | 50 |
| RS4;11 | B-ALL | MLL-AF4 | 3 | 200 |
| SET-2 | AML/MPN | JAK2V617F | 4 | 245 |
| MOLM-14 | AML | MLL-AF9 | 5 | 18 |
| MV4;11 | AML | MLL-AF4 | 6 | 20 |
| UKE-1 | AML / MPN | JAK2V617F | 7 | |
| MEG-01 | CML / AMkL | BCR-ABL | 9 | 375 |
| TF-1 | AML / Erythroleukemia | EpoR | 350 | 163 |
| HEL | AML / Erythroleukemia | JAK2V617F | >1,000 | 200 |
| K562 | CML / Erythroleukemia | BCR-ABL | >1,000 | 750 |
| HCT116 | Colorectal | β-catenin | >1,000 | |
Extended Data Table 2.
CA/CDK8/CCNC ternary complex data collection and refinement statistics.
| Data collection and refinement statistics (Molecular replacement) | |
|---|---|
| CDK8/CycC/CA | |
| Data collection | |
| Space group | P 21 21 21 |
| Cell dimensions | |
| a, b, c (Å) | 70.5, 71.3, 171.3 |
| α, β, γ (°) | 90.0, 90.0, 90.0 |
| Resolution (Å) | 85.62 (2.40)* |
| R sym | 7.4 (44.8) |
| I/σI | 10.99 (2.66) |
| Completeness (%) | 94.9 (98.6) |
| Redundancy | 2.8 (2.8) |
| Refinement | |
| Resolution (Å) | 85.62 (2.40) |
| No. reflections | 32875 (8656) |
| Rwork/Rfree | 21.7 % / 26.6 % |
| No. atoms | |
| Protein | 5017 |
| Ligand/ion | 50 |
| Water | 104 |
| B-factors | |
| Protein | 32.3 |
| Ligand/ion | 56.3 |
| Water | 47.5 |
| R.m.s deviations | |
| Bond lengths (Å) | 0.009 |
| Bond angles (°) | 1.13 |
Highest resolution shell is shown in parenthesis.
Supplementary Material
Acknowledgements
We thank R. Levine, R. King, B. Ebert, B. Bernstein, S. Gillespie, M. Galbraith, M. Patricelli and T. Nomanbhoy for helpful discussions. Lentiviral packaging was completed at the U. Mass. Med. School RNAi core facility. Microarray data collection was performed at DFCI MicroArray Core Facility and UMass Medical School Genomics Core Facility. Formulation was performed at VivoPath. In-life portions of pharmacokinetic (PK), NK and SET-2 in vivo studies were performed at Charles River. We thank S. Trauger and G. Byrd of Harvard FAS Small Molecule Mass Spectrometry for PK data acquisition and Harvard FAS Center for Systems Biology for flow sorting and high-throughput sequencing. Recombinant expression of CDK8 module subunits was completed at the Tissue Culture Shared Resource at the University of Colorado Cancer Center, supported by the NCI (P30 CA046934). HCT116 RNA-seq was carried out at the Genomics Shared Resource at the University of Colorado Cancer Center and supported by grant P30-CA046934. We thank A. Odell and R. Dowell (UC-Boulder) for HCT116 RNA-Seq data analysis, the R. Levine lab (MSKCC) for carrying out the SET-2 RNA-seq acquisition, the Matthias Geyer laboratory for purified CDK12:CycK and CDK13:CycK complexes, and Dr. P. Kovarik for STAT1 plasmids. This work was supported by NIH grant CA66996 (SAA), NCI grants R01 CA170741 (DJT) and F31 CA180419 (ZCP), NIH T32 GM08759 (ZCP), a Leukemia and Lymphoma Society Translational Research Program Grant (MDS), the Blavatnik Biomedical Accelerator Program at Harvard (MDS) and the Starr Cancer Consortium (MDS).
Footnotes
Author contributions H.E.P., B.B.L., and M.D.S. designed most research and analysed data. H.E.P., B.B.L., I.I.N., A.T., Z.C.P., D.D., and B.T.C. performed most cell-based and biochemical experiments and analysed data. A.A. and O.F. synthesized CA under guidance from M.D.S.. C.S. and G.Z. synthesized CA under guidance from A.G.M.. A.L.C. performed MV4;11 in vivo efficacy and safety studies under guidance of N.E.K.. K.D., I.I.N., and B.T.C. performed cell cycle and apoptosis flow cytometry analysis. D.B. performed early MOLM-14 cell growth assays. E.V.S. and A.J. performed X-ray crystallography. R.T.B. performed mouse histopathology. A.L.K. advised on in vivo studies. S.A.A. and A.K. advised on AML studies. M.E.L. performed computational biology studies. D.J.T. supervised in vitro CDK8 kinase studies. H.E.P., B.B.L., D.J.T. and M.D.S. wrote the manuscript. M.D.S. supervised the research.
Author Information The atomic coordinates of CDK8/CCNC in complex with cortistatin A was deposited in the Protein Data Bank with accession number 4crl. MIAME-compliant microarray data as well as aligned and raw ChIP-seq data were deposited to the Gene Expression Omnibus (GEO) with accession GSE65161 (www.ncbi.nlm.nih.gov/geo/). The authors declare no competing financial interests. Readers are welcome to comment on the online version of the paper.
Supplementary Information is linked to the online version of the paper at www.nature.com/nature.
References
- 1.Hnisz D, et al. Super-enhancers in the control of cell identity and disease. Cell. 2013;155:934–947. doi: 10.1016/j.cell.2013.09.053. [DOI] [PMC free article] [PubMed] [Google Scholar]
- 2.Whyte WA, et al. Master Transcription Factors and Mediator Establish Super-Enhancers at Key Cell Identity Genes. Cell. 2013;153:307–319. doi: 10.1016/j.cell.2013.03.035. [DOI] [PMC free article] [PubMed] [Google Scholar]
- 3.Lovén J, et al. Selective Inhibition of Tumor Oncogenes by Disruption of Super-Enhancers. Cell. 2013;153:320–334. doi: 10.1016/j.cell.2013.03.036. [DOI] [PMC free article] [PubMed] [Google Scholar]
- 4.Dawson MA, et al. Recurrent mutations, including NPM1c, activate a BRD4-dependent core transcriptional program in acute myeloid leukemia. Leukemia. 2013;28:311–320. doi: 10.1038/leu.2013.338. [DOI] [PMC free article] [PubMed] [Google Scholar]
- 5.Kwiatkowski N, et al. Targeting transcription regulation in cancer with a covalent CDK7 inhibitor. Nature. 2014;511:616–620. doi: 10.1038/nature13393. [DOI] [PMC free article] [PubMed] [Google Scholar]
- 6.Prange KHM, Singh AA, Martens JHA. The genome-wide molecular signature of transcription factors in leukemia. Exp. Hematol. 2014;42:637–650. doi: 10.1016/j.exphem.2014.04.012. [DOI] [PubMed] [Google Scholar]
- 7.Fragale A, Marsili G, Battistini A. Genetic and Epigenetic Regulation of Interferon Regulatory Factor Expression: Implications in Human Malignancies. J. Genet. Syndr. Gene Ther. 2013;4:205. [Google Scholar]
- 8.de Braekeleer E, et al. ETV6 fusion genes in hematological malignancies: a review. Leuk. Res. 2012;36:945–961. doi: 10.1016/j.leukres.2012.04.010. [DOI] [PubMed] [Google Scholar]
- 9.Allen BL, Taatjes DJ. The Mediator complex: a central integrator of transcription. Nat. Rev. Mol. Cell Biol. 2015;16:155–166. doi: 10.1038/nrm3951. [DOI] [PMC free article] [PubMed] [Google Scholar]
- 10.Cee VJ, Chen DY-K, Lee MR, Nicolaou KC. Cortistatin A is a high-affinity ligand of protein kinases ROCK, CDK8, and CDK11. Angew. Chem. Int. Ed. Engl. 2009;48:8952–8957. doi: 10.1002/anie.200904778. [DOI] [PubMed] [Google Scholar]
- 11.Lee HM, Nieto-Oberhuber C, Shair MD. Enantioselective synthesis of (+)-cortistatin A, a potent and selective inhibitor of endothelial cell proliferation. J. Am. Chem. Soc. 2008;130:16864–16866. doi: 10.1021/ja8071918. [DOI] [PubMed] [Google Scholar]
- 12.Flyer AN, Si C, Myers AG. Synthesis of cortistatins A, J, K and L. Nat. Chem. 2010;2:886–892. doi: 10.1038/nchem.794. [DOI] [PMC free article] [PubMed] [Google Scholar]
- 13.Bancerek J, et al. CDK8 kinase phosphorylates transcription factor STAT1 to selectively regulate the interferon response. Immunity. 2013;38:250–262. doi: 10.1016/j.immuni.2012.10.017. [DOI] [PMC free article] [PubMed] [Google Scholar]
- 14.Alarcón C, et al. Nuclear CDKs drive Smad transcriptional activation and turnover in BMP and TGF-β pathways. Cell. 2009;139:757–769. doi: 10.1016/j.cell.2009.09.035. [DOI] [PMC free article] [PubMed] [Google Scholar]
- 15.Patricelli MP, et al. In Situ Kinase Profiling Reveals Functionally Relevant Properties of Native Kinases. Chem. Biol. 2011;18:699–710. doi: 10.1016/j.chembiol.2011.04.011. [DOI] [PMC free article] [PubMed] [Google Scholar]
- 16.Pierce AC, Sandretto KL, Bemis GW. Kinase inhibitors and the case for CH...O hydrogen bonds in protein-ligand binding. Proteins. 2002;49:567–576. doi: 10.1002/prot.10259. [DOI] [PubMed] [Google Scholar]
- 17.Zacharias N, Dougherty DA. Cation-π interactions in ligand recognition and catalysis. Trends Pharmacol. Sci. 2002;23:281–287. doi: 10.1016/s0165-6147(02)02027-8. [DOI] [PubMed] [Google Scholar]
- 18.Garraway LA, Sellers WR. Lineage dependency and lineage-survival oncogenes in human cancer. Nat. Rev. Cancer. 2006;6:593–602. doi: 10.1038/nrc1947. [DOI] [PubMed] [Google Scholar]
- 19.Subramanian A, et al. Gene set enrichment analysis: a knowledge-based approach for interpreting genome-wide expression profiles. Proc. Natl. Acad. Sci. USA. 2005;102:15545–15550. doi: 10.1073/pnas.0506580102. [DOI] [PMC free article] [PubMed] [Google Scholar]
- 20.Adelman K, Lis JT. Promoter-proximal pausing of RNA polymerase II: emerging roles in metazoans. Nat Rev Genet. 2012;13:720–731. doi: 10.1038/nrg3293. [DOI] [PMC free article] [PubMed] [Google Scholar]
- 21.Etchin J, et al. Antileukemic activity of nuclear export inhibitors that spare normal hematopoietic cells. Leukemia. 2013;27:66–74. doi: 10.1038/leu.2012.219. [DOI] [PMC free article] [PubMed] [Google Scholar]
- 22.Putz EM, et al. CDK8-Mediated STAT1-S727 Phosphorylation Restrains NK Cell Cytotoxicity and Tumor Surveillance. Cell Rep. 2013;4:437–444. doi: 10.1016/j.celrep.2013.07.012. [DOI] [PMC free article] [PubMed] [Google Scholar]
- 23.Tahirov TH, et al. Crystal structure of HIV-1 Tat complexed with human P-TEFb. Nature. 2010;465:747–751. doi: 10.1038/nature09131. [DOI] [PMC free article] [PubMed] [Google Scholar]
- 24.Knuesel MT, Meyer KD, Donner AJ, Espinosa JM, Taatjes DJ. The human CDK8 subcomplex is a histone kinase that requires Med12 for activity and can function independently of mediator. Mol. Cell. Biol. 2009;29:650–661. doi: 10.1128/MCB.00993-08. [DOI] [PMC free article] [PubMed] [Google Scholar]
- 25.Okerberg E, et al. Profiling native kinases by immuno-assisted activity-based profiling. Curr Protoc Chem Biol. 2013;5:213–226. doi: 10.1002/9780470559277.ch130084. [DOI] [PubMed] [Google Scholar]
- 26.Hutterer C, et al. A Novel CDK7 Inhibitor of the Pyrazolotriazine Class Exerts Broad-Spectrum Antiviral Activity at Nanomolar Concentrations. Antimicrob. Agents Chemother. 2015;59:2062–2071. doi: 10.1128/AAC.04534-14. [DOI] [PMC free article] [PubMed] [Google Scholar]
- 27.Schneider EV, et al. The structure of CDK8/CycC implicates specificity in the CDK/Cyclin family and reveals interaction with a deep pocket binder. J. Mol. Biol. 2011;412:251–266. doi: 10.1016/j.jmb.2011.07.020. [DOI] [PubMed] [Google Scholar]
- 28.Kabsch W. Integration, scaling, space-group assignment and post-refinement. Acta Cryst. 2010;D66:133–144. doi: 10.1107/S0907444909047374. [DOI] [PMC free article] [PubMed] [Google Scholar]
- 29.Vagin AA, Teplyakov A. Molecular replacement with MOLREP. Acta Cryst. 2010;D66:22–25. doi: 10.1107/S0907444909042589. [DOI] [PubMed] [Google Scholar]
- 30.Emsley P, Cowtan K. Coot: model-building tools for molecular graphics. Acta Cryst. 2004;D60:2126–2132. doi: 10.1107/S0907444904019158. [DOI] [PubMed] [Google Scholar]
- 31.Dodson EJ, Winn M, Ralph A. Collaborative Computational Project, number 4: providing programs for protein crystallography. Meth. Enzymol. 1997;277:620–633. doi: 10.1016/s0076-6879(97)77034-4. [DOI] [PubMed] [Google Scholar]
- 32.Vagin AA, et al. REFMAC5 dictionary: organization of prior chemical knowledge and guidelines for its use. Acta Cryst. 2004;D60:2184–2195. doi: 10.1107/S0907444904023510. [DOI] [PubMed] [Google Scholar]
- 33.The PyMOL molecular graphics system. Schrödinger; New York: [Google Scholar]
- 34.Firestein R, et al. CDK8 is a colorectal cancer oncogene that regulates β-catenin activity. Nature. 2008;455:547–551. doi: 10.1038/nature07179. [DOI] [PMC free article] [PubMed] [Google Scholar]
- 35.Gentleman R, et al. Bioconductor: open software development for computational biology and bioinformatics. Genome Biol. 2004;5:R80. doi: 10.1186/gb-2004-5-10-r80. [DOI] [PMC free article] [PubMed] [Google Scholar]
- 36.Rafael RA, et al. Summaries of Affymetrix GeneChip probe level data. Nucleic Acids Research. 2003;31:e15. doi: 10.1093/nar/gng015. [DOI] [PMC free article] [PubMed] [Google Scholar]
- 37.Johnson WE, Li C, Rabinovic A. Adjusting batch effects in microarray expression data using empirical Bayes methods. Biostatistics. 2007;8:118–127. doi: 10.1093/biostatistics/kxj037. [DOI] [PubMed] [Google Scholar]
- 38.Benjamini Y, Hochberg YJR. Stat. Soc., B. 1995;57:289–300. [Google Scholar]
- 39.Dobin A, et al. STAR: ultrafast universal RNA-seq aligner. Bioinformatics. 2012;29:15–21. doi: 10.1093/bioinformatics/bts635. [DOI] [PMC free article] [PubMed] [Google Scholar]
- 40.Li H, Durbin R. Fast and accurate short read alignment with Burrows-Wheeler transform. Bioinformatics. 2009;25:1754–1760. doi: 10.1093/bioinformatics/btp324. [DOI] [PMC free article] [PubMed] [Google Scholar]
- 41.Anders S, Pyl PT, Huber W. HTSeq--a Python framework to work with high-throughput sequencing data. Bioinformatics. 2015;31:166–169. doi: 10.1093/bioinformatics/btu638. [DOI] [PMC free article] [PubMed] [Google Scholar]
- 42.Anders S, Huber W. Differential expression analysis for sequence count data. Genome Biol. 2010;11:R106. doi: 10.1186/gb-2010-11-10-r106. [DOI] [PMC free article] [PubMed] [Google Scholar]
- 43.Law CW, Chen Y, Shi W, Smyth GK. voom: Precision weights unlock linear model analysis tools for RNA-seq read counts. Genome Biol. 2014;15(2):R29. doi: 10.1186/gb-2014-15-2-r29. [DOI] [PMC free article] [PubMed] [Google Scholar]
- 44.Huang DW, Sherman BT, Lempicki RA. Systematic and integrative analysis of large gene lists using DAVID bioinformatics resources. Nat Protoc. 2009;4:44–57. doi: 10.1038/nprot.2008.211. [DOI] [PubMed] [Google Scholar]
- 45.Langmead B, Trapnell C, Pop M, Salzberg SL. Genome Biol. 2009;10:R25. doi: 10.1186/gb-2009-10-3-r25. [DOI] [PMC free article] [PubMed] [Google Scholar]
- 46.Kharchenko PV, Tolstorukov MY, Park PJ. Design and analysis of ChIP-seq experiments for DNA-binding proteins. Nat. Biotechnol. 2008;26:1351–1359. doi: 10.1038/nbt.1508. [DOI] [PMC free article] [PubMed] [Google Scholar]
- 47.Zhang Y, et al. Model-based analysis of ChIP-Seq (MACS). Genome Biol. 2008;9:R137. doi: 10.1186/gb-2008-9-9-r137. [DOI] [PMC free article] [PubMed] [Google Scholar]
- 48.Landt SG, et al. ChIP-seq guidelines and practices of the ENCODE and modENCODE consortia. Genome Res. 2012;22:1813–1831. doi: 10.1101/gr.136184.111. [DOI] [PMC free article] [PubMed] [Google Scholar]
- 49.Quinlan AR, Hall IM. BEDTools: a flexible suite of utilities for comparing genomic features. Bioinformatics. 2010;26:841–842. doi: 10.1093/bioinformatics/btq033. [DOI] [PMC free article] [PubMed] [Google Scholar]
- 50.Rahl PB, et al. c-Myc Regulates Transcriptional Pause Release. Cell. 2010;141:432–445. doi: 10.1016/j.cell.2010.03.030. [DOI] [PMC free article] [PubMed] [Google Scholar]
- 51.Shen L, Shao N, Liu X, Nestler E. ngs.plot: An easy-to-use global visualization tool for next-generation sequencing data. Icahn School of Medicine at Mount Sinai; New York: 2013. [Google Scholar]
- 52.Li Q, Brown JB, Huang H, Bickel PJ. Measuring reproducibility of high-throughput experiments. Ann. Appl. Stat. 2011;5:1752–1779. [Google Scholar]
- 53.Galbraith MD, et al. HIF1A Employs CDK8-Mediator to Stimulate RNAPII Elongation in Response to Hypoxia. Cell. 2013;153:1327–1339. doi: 10.1016/j.cell.2013.04.048. [DOI] [PMC free article] [PubMed] [Google Scholar]
Associated Data
This section collects any data citations, data availability statements, or supplementary materials included in this article.


