

Abstract
Paternal behavior is not innate but arises through social experience. After mating and becoming fathers, male mice change their behavior toward pups from infanticide to paternal care. However, the precise brain areas and circuit mechanisms connecting these social behaviors are largely unknown. Here we demonstrated that the c‐Fos expression pattern in the four nuclei of the preoptic‐bed nuclei of stria terminalis (BST) region could robustly discriminate five kinds of previous social behavior of male mice (parenting, infanticide, mating, inter‐male aggression, solitary control). Specifically, neuronal activation in the central part of the medial preoptic area (cMPOA) and rhomboid nucleus of the BST (BSTrh) retroactively detected paternal and infanticidal motivation with more than 95% accuracy. Moreover, cMPOA lesions switched behavior in fathers from paternal to infanticidal, while BSTrh lesions inhibited infanticide in virgin males. The projections from cMPOA to BSTrh were largely GABAergic. Optogenetic or pharmacogenetic activation of cMPOA attenuated infanticide in virgin males. Taken together, this study identifies the preoptic‐BST nuclei underlying social motivations in male mice and reveals unexpected complexity in the circuit connecting these nuclei.
Keywords: fatherhood, maternal behavior, Mus musculus, parental care
Subject Categories: Neuroscience
Introduction
Mammalian neonates are born immature, and thus, postpartum mothers are equipped with innate motivation to care for them (Lonstein & Fleming, 2002; Numan, 2015). Previous studies established the critical importance of the medial preoptic area (MPOA) for maternal behavior (Numan, 1974), and more specifically, the central MPOA in female mice (Tsuneoka et al, 2013). In male mice, however, paternal behavior is not spontaneous. Virgin males often attack and kill newborn pups (infanticide) as an adaptive reproductive strategy that increases the males' mating opportunity (Trivers, 1972; Elwood, 1977; vom Saal & Howard, 1982). After mating and cohabitation with a pregnant female, male mice shift their pup‐directed behavior from infanticide to paternal care, even toward non‐biological offspring. We have recently shown that the accessory olfactory system is highly activated during infanticide, and surgical ablation of the vomeronasal organ in virgin males abolished infanticide and induced paternal behavior (Tachikawa et al, 2013). However, while a similar behavioral transition from infanticide to paternal care can be observed in many species, from Old World monkeys Hanuman langur (Presbytis entellus) (Sugiyama, 1965; Hrdy, 1974) to African lions (Panthera leo) (Schaller, 1972), not all have a well‐developed vomeronasal system (Zhang & Webb, 2003). Therefore, a common central mechanism may exist to mediate the behavioral switch from infanticide to parenting after mating, even though the sensory modality for peripheral input differs among species. Here we investigated the forebrain areas responsible for these social behaviors in male laboratory mice (Mus musculus, strain C57BL/6J), to gain insight into the neural mechanism underlying the adaptive transition of pup‐directed behaviors.
Results
Neurochemical delineation of the bed nucleus of stria terminalis in mice
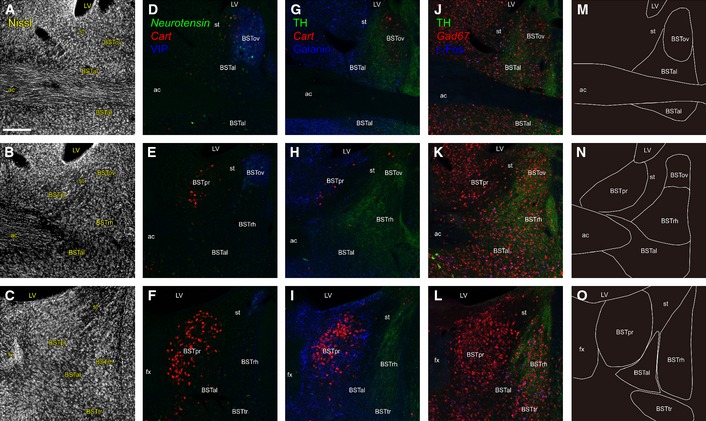
Our previous analyses of the neuronal activation pattern during pup‐directed behaviors in mice (Kuroda et al, 2007; Tachikawa et al, 2013) suggested that the spatial expression pattern of c‐Fos transcription factor in the preoptic area and its dorsolateral neighbor, the bed nuclei of stria terminalis (BST), could be used to classify transpired pup‐directed behavior. To achieve high accuracy and reproducibility of histological analyses when testing this hypothesis, we needed a more rigorous anatomical delineation of each BST nucleus than our previous study (Tachikawa et al, 2013). Therefore, we first conducted careful neurochemical mapping of the BST (Fig 1) in male C57BL/6J mice and identified the BST nuclei relevant to pup‐directed behaviors. Based on studies in rats (Ju & Swanson, 1989; Ju et al, 1989; Dong et al, 2001), the principal nucleus of the BST (BSTpr) in mice was identified as the cocaine‐ and amphetamine‐regulated transcript (CART) mRNA‐positive area with dense Nissl staining, surrounded by dense galanin‐immunoreactive (‐ir) fibers and cell bodies (Fig 1C, F, I and O). The oval nucleus of the BST (BSTov) was identified as the Neurotensin mRNA‐positive area with dense vasoactive intestinal peptide (VIP)‐ir fibers (Fig 1D, E, M and N). The rhomboid nucleus of the BST (BSTrh) was defined as the area with dense staining of tyrosine hydroxylase (TH)‐ir fibers and with a sparse distribution of VIP‐ir and galanin‐ir fibers located posterior to the BSTov (Fig 1F, I, L and O). The transverse nucleus of BST (BSTtr) was located ventral to the BSTrh and identified by Nissl staining as a cluster of neurons that were oriented transversely (Fig 1C and O). The anterolateral part of BST (BSTal) was identified by the distribution of galanin‐ir cell bodies (Fig 1G–I and M–O).
Figure 1. Neurochemical mapping of the BST subnuclei in virgin male mice.
-
A–LNeurochemical analysis of the BST. All panels are coronal sections arranged from rostral (top) to caudal (bottom). The distances from bregma to the sections were +0.22 mm (top), +0.1 mm (middle) and −0.08 mm (bottom), respectively. ac, the anterior commissure; st, the stria terminalis; fx, fornix; LV, lateral ventricle. Scale bar is 0.2 mm. (A–C) Nissl staining of the BST. (D–L) Triple fluorescent staining of the BST; (D–F) Cart and Neurotensin double ISH with anti‐VIP immunohistochemistry (IHC); (G–I) Cart ISH with anti‐TH and galanin IHC; (J–L) Gad67 ISH with anti‐TH and c‐Fos IHC. For (J–L), the male mice were exposed to unfamiliar pups for 2 h to confirm infanticidal behavior.
-
M–ODelineation of the BST nuclei based on the results of (A–L).
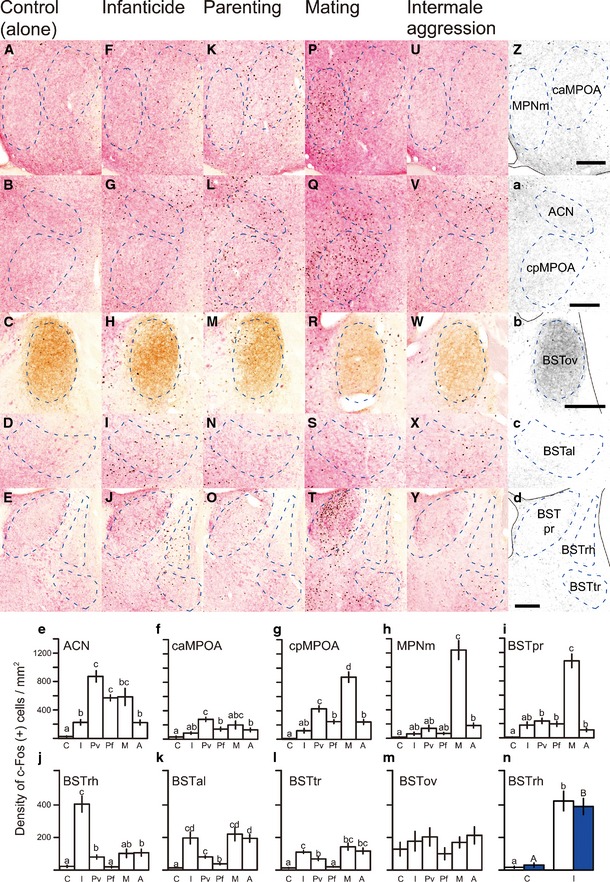
For rigorous anatomical analyses using multiple animal samples, the use of conservative contours (smaller areas than the actual nucleus) is required to overcome the variation of individual samples (e.g., see Palkovits & Brownstein, 1992). Therefore, we set a conservative contour for each BST nucleus as a numerically defined closed line on the coronal plane as shown in Fig 2Z–d; for example, the conservative contour of BSTal was set posterolaterally to the anterior commissure (Fig 2c) to unequivocally count c‐Fos‐ir neurons of BSTal but not of adjacent areas for individual animals, although the BSTal itself is larger and extends rostrocaudally.
Figure 2. Distribution of c‐Fos‐ir neurons in the preoptic‐BST nuclei after various social behaviors.
-
A–YRepresentative photomicrographs of coronal sections triple‐stained for c‐Fos (black), VIP (brown) and galanin (pink‐red) of control, infanticidal, parenting, mating and intermale aggression groups.
-
Z–dConservative contours of the nine subregions where the c‐Fos‐ir neurons were counted (indicated by dashed lines). The distances from bregma to the sections were +0.22 mm (first row), +0.1 mm (second row), +0.22 mm (third row), +0.1 mm (fourth row) and −0.08 mm (fifth row), respectively. Scale bars = 0.2 mm.
-
e–mMean (± SE) density of c‐Fos‐ir neurons in each area induced by direct social interactions. C: control (stayed alone) (n = 8); I: infanticidal virgin males (n = 7); Pv: paternally behaving virgin males (n = 6); Pf: paternally behaving fathers (n = 11); M: virgin males experienced mating (n = 8); and A: virgin males experienced intermale aggression (n = 13). Letters above each bar indicate significant differences between each behavioral group (i.e., bars with the same letter are not significantly different by Welch's ANOVA). P‐values are described separately in Table EV1.
-
nMean (± SE) density of c‐Fos‐ir neurons in the BSTrh induced by direct (white in I, n = 7) or indirect (blue in I, pups within mesh balls, n = 14) pup exposure to infanticidal males, and by exposure to a mesh ball (blue in C, n = 9) or by no exposure but the sham action of opening and closing the cage top (white in C, n = 8).
The preoptic subregions, cMPOA anterior (caMPOA) and posterior (cpMPOA), the anterior commissural nucleus (ACN) and the medial part of the medial preoptic nucleus (MPNm) were identified in our previous study in C57BL/6J female mice (Tsuneoka et al, 2013). In this study, the conservative contours of these preoptic regions were set for male C57BL/6J mice (see Materials and Methods). A total of nine preoptic‐BST nuclei (Fig 2Z–d, see also Fig EV1) was used for the c‐Fos expression analyses described below.
Figure EV1. Distribution of c‐Fos‐ir neurons in the preoptic‐BST region after various social behaviors (low magnification of Figure 2).
-
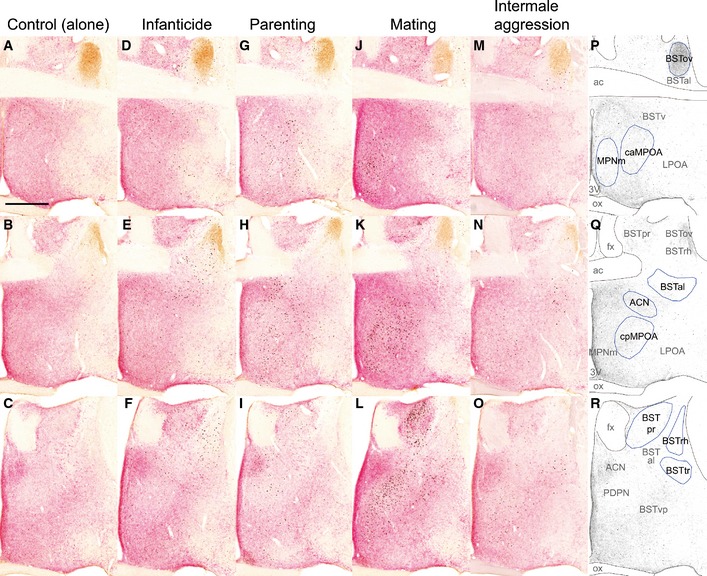
A–ORepresentative photomicrographs for c‐Fos (black), VIP (brown) and galanin (pink‐red) triple staining of control, infanticidal, parenting, mating and intermale aggression groups. All panels are coronal sections arranged from rostral (top) to caudal (bottom) order. The distances from bregma to the sections were +0.22 mm (top), +0.1 mm (middle) and −0.08 mm (bottom), respectively. Scale bar = 0.5 mm.
-
P–RArea names and locations where the c‐Fos‐ir neurons were counted (indicated by blue lines).
Distinct c‐Fos expression patterns induced by four types of male social behaviors
To examine c‐Fos expression induced by pup exposure in virgin males and fathers, these mice were first pre‐tested to determine their pup‐directed behavior. All fathers exhibited paternal behavior on postpartum day 3. The majority of virgin males committed infanticide, while a small fraction (6.5%) of virgins spontaneously performed paternal behavior in the pre‐test, as expected from our previous study (Tachikawa et al, 2013). Clearly, infanticidal virgin males (n = 7), paternal virgin males (n = 6) and fathers (n = 11) were selected and were singly housed for 2 days to allow the c‐Fos expression induced by the pre‐test to return to baseline levels (Morgan et al, 1987; Numan & Numan, 1994), and then they were exposed to three donor pups for 2 h. The pup‐directed behavior during this main experiment was essentially consistent with the pre‐test as shown previously (Tachikawa et al, 2013). In addition to these pup‐exposed groups, two groups of male mice were subjected to other types of social interactions: mating (with ejaculation) (n = 8), which has been shown to be necessary for the behavioral change in fathers (Kennedy & Elwood, 1988), and inter‐male aggression (n = 13), which involved biting and attack toward an unfamiliar adult male intruder in their home cage. The control group males were single‐housed and were not exposed to any social encounter, but otherwise treated in the same manner (n = 8). Two hours later, these mice (total n = 53) were perfused with PFA and the brains were subjected to triple immunohistochemical labeling (Figs 2A–Y and EV1) for c‐Fos, VIP and galanin, to quantify the c‐Fos‐ir neurons in each nucleus (Fig 2e–m, see also Table EV1 for P‐values).
Paternal behavior induced significantly more c‐Fos expression in the ACN, the caMPOA and the cpMPOA (Fig 2e–g) in both the fathers (ACN, P < 0.001; caMPOA, P = 0.0285; and cpMPOA, P < 0.001) and paternal virgin males (ACN, P = 0.0013; caMPOA, P = 0.0013; and cpMPOA, P = 0.0015), compared to that of control mice, suggesting a similar pattern of parenting‐induced activation regardless of gender or previous reproductive experiences (Tsuneoka et al, 2013). This parenting‐induced activation was even more pronounced in paternal virgin males than in fathers (caMPOA, P = 0.0405; and cpMPOA, P = 0.0340; Fig 2f and g), suggesting the novelty of the paternal behavior led to greater activation in the inexperienced virgin males.
After mating and ejaculation, a robust increase in c‐Fos expression was seen in the MPNm and the BSTpr (MPNm, P < 0.001; and BSTpr, P < 0.001, compared to the control; Fig 2h and i), both of which are sexually dimorphic (larger in males) and have been implicated in male sexual behavior (Simerly et al, 1986; Yahr et al, 1994; Balthazart & Ball, 2007). Interestingly, the areas activated during paternal behaviors were also activated during mating, most prominently cpMPOA (P < 0.001, compared to the control, Fig 2g).
In infanticidal virgin males, only the BSTrh was significantly activated compared with all the other types of social encounter (P = 0.0074 compared to the control) (Fig 2J and j). Based on its projection pattern, it has been suggested that the BSTrh is involved in ingestive behavior (Dong & Swanson, 2003). Thus, to address whether activation of the BSTrh after infanticide was caused by ingestion of pups' blood or tissues, we performed an additional experiment where the stimulus pups were protected by wire mesh balls (n = 14). This indirect pup presentation to the previously infanticidal virgin males caused a comparable amount of BSTrh activation to that observed in mice who had physical access to pups and could bite them (t = −6.64, df = 6.17, P < 0.001 for direct pup presentation and t = −6.96, df = 14.72, P < 0.001 for indirect pup presentation, compared to the control groups, respectively; Fig 2n, see also Fig EV2). Therefore, we concluded that the BSTrh activation was correlated with motivation for rather than the commitment of infanticide.
Figure EV2. Comparison between direct and indirect pup presentation and the effect on c‐Fos expression.
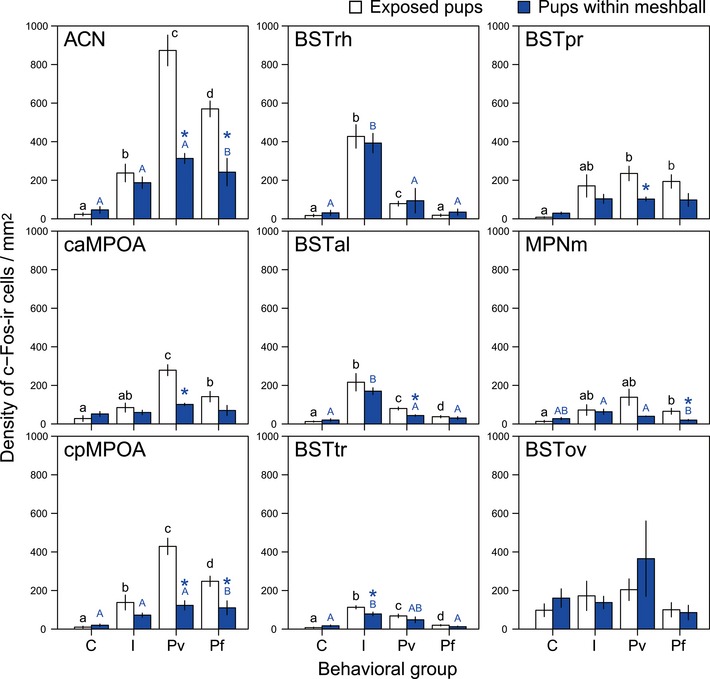
Mean (± SE) density of c‐Fos‐ir neurons in each area induced by direct exposure of pups (white) and indirect exposure of pups within mesh balls (blue). Letters above each bar indicate significant differences between each behavioral group (i.e., bars with a same letter are not significantly different by Welch's ANOVA). Asterisks denote significant differences among exposure types (direct, exposed pups; indirect, pups within mesh balls). C: control no exposure to pups but a sham action of opening and closing the cage top (white in C, n = 8), exposure to a mesh ball (blue in C, n = 9); I: infanticidal virgin males exposed to pups directly (white in I, n = 7) or indirectly (blue in I, n = 14); Pv: parentally behaving virgin males exposed to pups directly (white in Pv, n = 6) or indirectly (blue in Pv, n = 2); Pf: parentally behaving fathers exposed to pups directly (white in Pf, n = 11) or indirectly (blue in Pf, n = 8).
Bilateral lesions of the BSTrh inhibited infanticidal behavior in virgin males
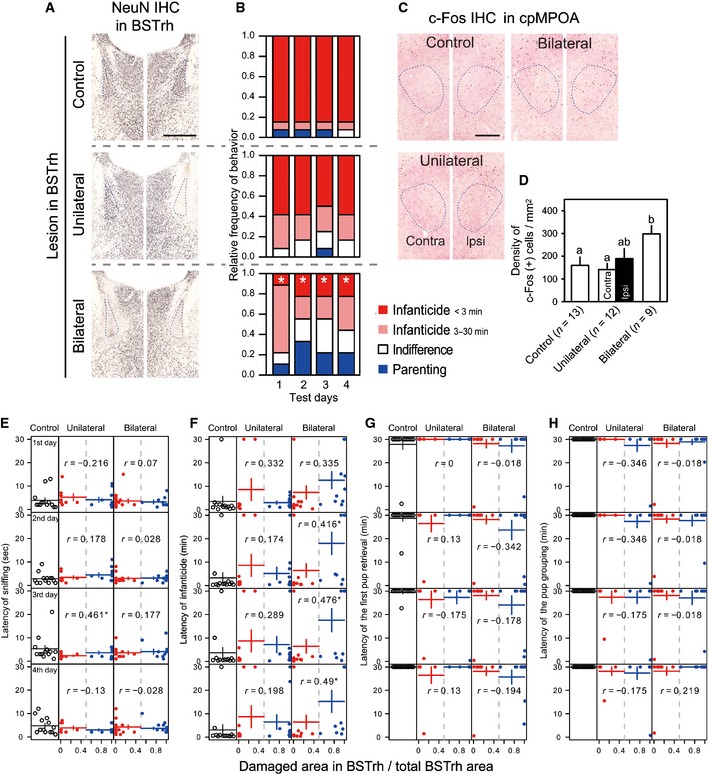
Next, we investigated the role of BSTrh in infanticide. Infusion of the amino acid N‐methyl‐D‐aspartic acid (NMDA) is known to overexcite and deplete the local neurons expressing the NMDA receptor, sparing the passing fibers, while its optical isomer N‐methyl‐L‐aspartic acid (NMLA) is non‐toxic (Numan et al, 1988). Bilateral excitotoxic lesions in the BSTrh resulted in significant inhibition or delay in performing infanticide in virgin males for all four test days (Fig 3A and B, P = 0.002, 0.033, 0.023 and 0.033, respectively, Fisher's exact probability test; see also Fig EV3 for the individual lesioned areas), compared to the NMLA‐injected control males. The positive correlation between the extent of bilateral BSTrh damage and the latency of infanticide was significant from the second to fourth test days (Fig 3F). The latency of the first pup sniffing was largely unaffected (Fig 3E), suggesting that the BSTrh lesions did not produce gross deficits in the sensorimotor system, which may inhibit infanticide non‐specifically. Bilateral BSTrh lesions increased c‐Fos expression in cMPOA ((t = −2.71, df = 19.40, P = 0.0139; Fig 3C and D). However, the effect of bilateral BSTrh lesions on the latency of first pup retrieval or pup grouping did not reach statistical significance (Fig 3G and H). Unilateral BSTrh lesions did not cause significant behavioral changes for all four test days (Fig 3B, P = 0.148, 0.159, 0.263 and 0.366, Fisher's exact probability test; Fig 3E and F), or changes to the c‐Fos expression in the ipsilateral cpMPOA (t = −1.318, df = 11, P = 0.214; Fig 3C and D).
Figure 3. Excitotoxic lesions in BSTrh attenuate infanticidal behavior of virgin male mice.
-
A, BThe photos and data shown in top, middle and bottom rows, respectively, belong to the control, unilateral and bilateral lesion groups. (A) Representative photomicrographs showing the effects of NMDA injections. The sections were stained by immunohistochemistry (IHC) using anti‐NeuN (black) and anti‐VIP (brown) antibodies. Dashed line indicates the BSTrh. Scale bar = 0.5 mm. (B) Relative frequencies of responses to pups. Committing infanticide within 3 min (red), committing infanticide in 3–30 min (pink), indifference (neither infanticidal nor parenting) (white) and parenting (retrieving at least one pup within 30 min) (blue). *: significant difference from the control group of the same day.
-
CRepresentative photomicrographs showing c‐Fos expression in cpMPOA (dashed contour) 2 h after the final behavioral test. The sections were stained by IHC using anti‐c‐Fos (black), anti‐VIP (brown) and anti‐galanin (pink‐red) antibodies. Scale bar = 0.25 mm.
-
DMean (± SE) density of c‐Fos‐ir neurons in cpMPOA induced by direct pup exposure. Differential letters indicate significant difference among bars. For the unilateral group, the data were analyzed and shown for each side.
-
E–HScatter plot showing the relation between the proportion of the BSTrh damage with the latency of the first pup sniffing (E), the latency of infanticide (F), the latency of the first pup retrieval (G) and the latency of the completion of pup grouping (H). For unilateral and bilateral groups, the data contain both mis‐targeted (less than half of BSTrh area was destroyed) and successful lesion (half and more than half of BSTrh area was destroyed). Black, red and blue points, respectively, indicate control, mis‐targeted and successfully lesioned mice. Horizontal lines show mean and vertical lines show ± SE. r: Spearman's correlation index between the damaged area and the behavioral parameters. *, ** and *** indicate the statistical significance for the correlation (P < 0.05, P < 0.01 and P < 0.001, respectively). Please note that the distribution of each variable, in particular the latency of infanticide, shows a bimodal nature and may skew the correlation index in the scattered plots.
Figure EV3. Individual lesion mapping for the BSTrh in virgin males.
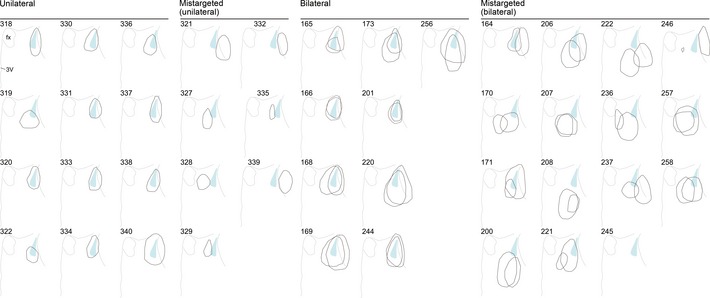
Superimposition of the left and right BSTrh lesioned areas of individual male mice with ID numbers, classified into “mis‐targeted,” “unilateral” and “bilateral” groups. BSTrh conservative contours are shown as the light blue areas. Numbers are the IDs of individual mouse.
Lesions of the cMPOA changed paternal behavior to infanticidal
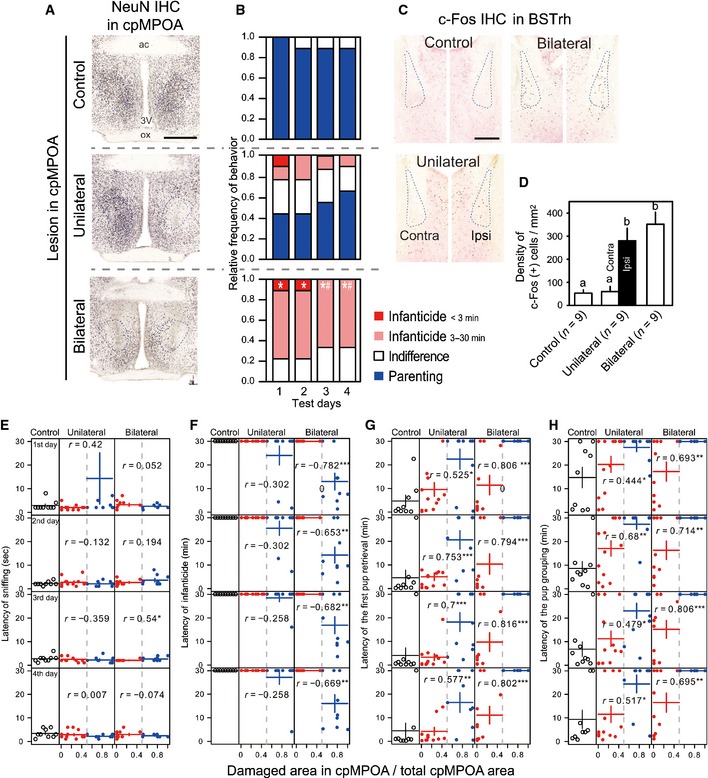
We also examined the effect of excitotoxic lesions in the areas activated during paternal behavior. Our preliminary studies revealed a critical role for the cMPOA, but not the ACN, similar to what was previously seen in females (Tsuneoka et al, 2013). Bilateral cMPOA (= caMPOA + cpMPOA) lesions not only abolished paternal behavior, but drastically shifted a majority of fathers to perform infanticidal behavior on all 4 test days (Fig 4A and B, P < 0.001, = 0.004, < 0.001 and < 0.001, respectively, Fisher's exact probability test; Fig 4F for latency of infanticide; see also Fig EV4 for the individual lesioned areas). Unilateral cMPOA lesions caused a milder effect (Fig 4B, day 1, P = 0.059, Fisher's exact probability test), shown as significantly increased latencies for the first retrieval and pup grouping (Fig 4G and H). On the other hand, the sniffing latency was not grossly affected (Fig 4E), suggesting that the inhibitory effects of cMPOA lesions were likely not due to a non‐specific disruption of general sensorimotor responses. Additionally, c‐Fos expression in the ipsilateral, but not the contralateral, BSTrh was significantly increased by the unilateral cMPOA lesion (t = −5.014, df = 8, P = 0.001; Fig 4C and D), suggesting ipsilateral inhibitory regulation of the BSTrh activity by cMPOA.
Figure 4. Excitotoxic lesions in cMPOA switch behavior in fathers from paternal to infanticidal.
-
A, BThe photos and data shown in top, middle and bottom rows, respectively, belong to the control, unilateral and bilateral lesion groups. (A) Representative photomicrographs showing the effects NMDA injections. The sections were stained by immunohistochemistry (IHC) using anti‐NeuN (black) and anti‐VIP (brown) antibodies. Dashed line indicates cpMPOA. Scale bar = 0.5 mm. (B) Relative frequencies of responses to pups. Committing infanticide within 3 min (red), committing infanticide in 3–30 min (pink), indifference (neither infanticidal nor parenting) (white) and parenting (retrieving at least one pup within 30 min) (blue). *: significant difference from the control group of the same day. #: significant difference from the unilateral group of the same day.
-
CRepresentative photomicrographs showing c‐Fos expression in BSTrh (dashed contour) 2 h after the final behavioral test. The sections were stained by IHC using anti‐c‐Fos (black), anti‐VIP (brown) and anti‐galanin (pink‐red) antibodies. Scale bar = 0.25 mm.
-
DMean (± SE) density of c‐Fos‐ir neurons in BSTrh. Different letters indicate significant difference among bars. For the unilateral group, the data were analyzed and shown for each side.
-
E–HScatter plot showing the relation between the proportion of the BSTrh damage with the latency to the first pup sniffing (E), the latency to the infanticidal behavior (F), the latency of the first pup retrieval (G) and the latency of the completion of pup grouping (H). For unilateral and bilateral groups, the data contain both mis‐targeted (less than half of cpMPOA area was destroyed) and success lesion (half and more than half of cpMPOA area was destroyed). Black, red and blue points, respectively, indicate control, mis‐targeted and successfully lesioned mice. Horizontal lines show mean and vertical lines show ± SE. r: Spearman's correlation index between the damaged area and the behavioral parameters. *, ** and *** indicate the statistical significance for the correlation (P < 0.05, P < 0.01 and P < 0.001, respectively).
Figure EV4. Individual lesion mapping for the cMPOA in father males.
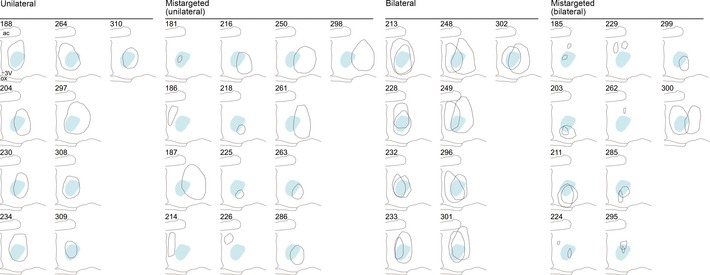
Superimposition of the left and right cpMPOA lesioned areas of individual male mice with ID numbers, classified into “mis‐targeted,” “unilateral” and “bilateral” groups. cpMPOA conservative contours are shown as the light blue areas. Numbers are the IDs of individual mouse.
Social behaviors can be retroactively discriminated by c‐Fos expression in the four preoptic‐BST nuclei
We next tested whether the males' recent social behavior could be deduced simply by measuring the neuronal activation pattern of the preoptic‐BST nuclei; this kind of analysis lays the groundwork for possible applications to detect or prevent infanticide by neuroimaging in the future. All conditions, with or without mesh ball protection of stimulus pups, and with or without previous reproductive experience (virgins or fathers), were considered in this analysis, with the goal of identifying social motivation for behavior irrespective of actual performance (total n = 88, see Fig EV2 for c‐Fos expression following mesh‐protected pup exposure). A linear discriminant function analysis showed more than 90% fidelity in discrimination of the five behavioral groups (control, infanticide, parenting, mating, inter‐male aggression), irrespective of previous mating experience or existence of the wire mesh barrier, with three variables mostly including BSTrh c‐Fos expression (Table EV2).
To further explore the role of each brain region with regard to a particular behavioral category, a classification tree model was applied to the same sample set (Fig 5). This analysis showed that, to deduce the previous social experience of a given male mouse, one should first look at the MPNm. If the c‐Fos expression density of the MPNm is higher than 417.8, it is highly likely that the mouse has experienced mating 2 h before (true‐positive rate: 100%; false‐positive rate: 0% in this analysis). If the c‐Fos expression density of the MPNm is lower than 417.8, one should next look at BSTrh; above 187.8, it is quite likely that the mouse has performed infanticide 2 h before (true‐positive rate: 100%; false‐positive rate: 3.2%, caused by the misclassification of two males who experienced inter‐male aggression in this branch). Notably, not only direct (white bars) but also indirect (blue bars) pup‐exposed infanticidal males were classified in this same category without exception, indicating that the infanticidal motivation, regardless of actual performance of infanticide, leaves a clear molecular trace in the BSTrh. Next, 69% (nine out of 13) of male mice who experienced inter‐male aggression were classified by a c‐Fos expression density higher than 107.3 in the BSTal. This relatively low true‐positive rate was not unexpected, because inter‐male aggression has also been attributed to other brain areas, most prominently the ventrolateral part of ventromedial hypothalamus (VMHvl) (Lin et al, 2011; Yang et al, 2013; Lee et al, 2014). Therefore, adding information about the c‐Fos expression in VMHvl may further increase the fidelity of retroactive classification of social behaviors. Finally, 93% of the parenting group could be distinguished from the control group using the c‐Fos expression density higher than 136.9 in the ACN. Again, the indirect pup exposure (blue bars) resulted in c‐Fos levels that were indistinguishable from the parental group, except for two males wrongly classified as control (no social exposure). The last node that segregated the parental animals could also be the cpMPOA instead of ACN, with minimal increase in misclassification. The overall classification accuracy was 93% (82 out of 88 male mice) for the ACN, and 92% (81 out of 88) for cpMPOA as the last node. We concluded that the molecular trace remaining in the four preoptic‐BST nuclei could be used to reliably discriminate previous social behavior.
Figure 5. A tree model for classification of behavior based on c‐Fos expression in the preoptic‐BST nuclei.
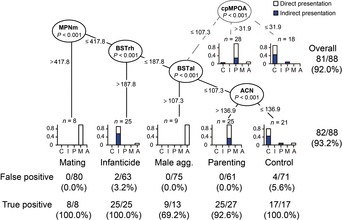
The values in the oval leaves of the tree refer to the area and the P‐value where the c‐Fos expression level creates a split. Each leaf is divided into two subleaves (statistically different, P = 0.001) by the splitting values of the c‐Fos expression density. The terminal leaves represent subgroups that cannot be further subdivided. The n value in the terminal leaves represents the size of the group, and the bar plots represent how many of each sample (white, direct social encounter; blue, indirect pup presentation) are categorized in the specific node (relative frequency range is 0–1). The alternative final split using the c‐Fos expression in the cpMPOA instead of that in the ACN is illustrated by dashed and gray lines. C: control no exposure to pups but a sham action of opening and closing the cage top (white, n = 8), exposure to a mesh ball (blue, n = 9); I: infanticidal males exposed to pups directly (white, n = 9) or indirectly (blue, n = 14); P: parentally behaving males exposed to pups directly (white, n = 17) or indirectly (blue, n = 10); M: virgin males experienced mating (n = 8); and A: virgin males experienced intermale aggression (n = 13).
If social contact was limited to pup exposure, the classification accuracy rose up to 97% (65 out of 67) using BSTrh and ACN, and 95.5% (64 out of 67) using BSTrh and cpMPOA, irrespective of direct or indirect pup exposure. Moreover, in the course of this experiment, we found three males that did not show either infanticide or parenting and appeared uninterested after the initial exploratory sniffing. We did not include these three animals in the analysis for Fig 5 because the number of samples was not enough for a separate behavioral category. Interestingly, however, c‐Fos expression in these pup‐ignoring males was consistently low in the four areas and fell into the last node with the control group (data not shown). Therefore, ACN/cMPOA activation and BSTrh activation were not simply induced by pup‐related sensory stimuli, but were indicative of paternal and infanticidal motivation, respectively.
GABAergic projection from the cMPOA to BSTrh
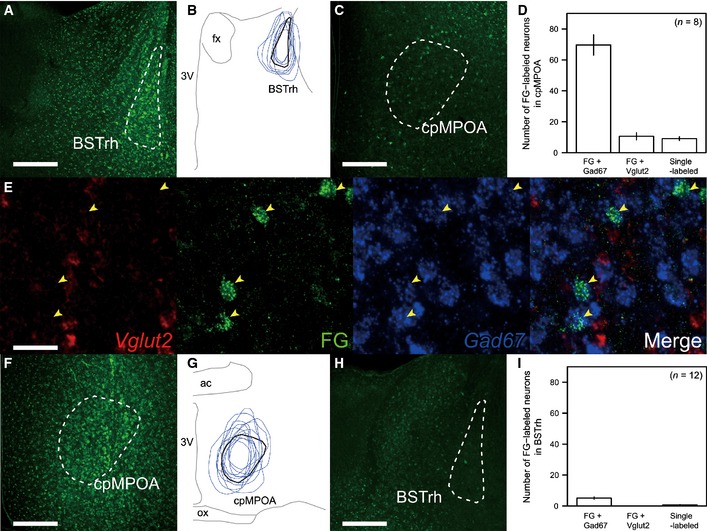
The above findings collectively suggested the possibility that the neural circuit between the cMPOA and BSTrh could be involved in the behavioral transition from infanticide to paternal care. Therefore, we examined the projections between the cMPOA and BSTrh (Fig 6). We used Gad67 and Vglut2 mRNA as a marker for GABAergic and glutamatergic neurons, respectively, in the preoptic‐BST area as previously described (Tsuneoka et al, 2013). A retrograde tracer, Fluorogold, was injected into BSTrh, and retrogradely labeled neurons were analyzed in the cMPOA by double‐fluorescent in situ hybridization (ISH) for Gad67 and Vglut2 mRNAs. The majority of projections from cpMPOA to BSTrh were found to be ipsilateral and GABAergic (Fig 6A–E). We also found GABAergic projections in the opposite direction, from BSTrh to cpMPOA, but these were fewer in number (Fig 6F–I).
Figure 6. GABAergic projections between cMPOA and BSTrh.
-
A–EFluorogold was unilaterally injected into BSTrh (A: a representative micrograph, B: superposition of eight samples), and the labeled cells were observed in the ipsilateral cpMPOA (C–E).
-
F–IFluorogold was unilaterally injected into cpMPOA (F: a representative micrograph, G: superposition of 12 samples), and the labeled cells were observed in BSTrh (H, I).
cMPOA activation suppresses infanticide
When males become fathers, they must suppress their infanticidal behavior to provide paternal care. We hypothesized that projections from cMPOA to BSTrh have a role in the suppression of infanticide. To test whether the relationship between cMPOA activation and infanticide suppression is causal, we applied the technology of optogenetics using recombinant adeno‐associated virus vectors (Zhang et al, 2010), to express channelrhodopsin‐2 (ChR2) and/or the enhanced yellow fluorescent protein (EYFP) genes unilaterally in the cMPOA (Fig 7A and G). Three weeks following injection, infanticidal behavior was confirmed in the virgin males in the absence of light stimulation. These mice were then tested three times per day for their pup‐directed behavior, with and without light stimulation, for 5 successive days (Fig 7A–C), to assess both acute and persistent effects of light stimulation. Fig 7C summarizes the results for each animal, and each square represents the behavior during each test session, color‐coded for infanticide (red), aggressive contact (yellow), ignoring the pup (light blue) and parenting (dark blue). After the behavioral experiments, the mice with successful expression of the recombinant gene and the optic fiber placement at cMPOA (Fig 7G and H) were selected for the following analyses.
Figure 7. Optogenetic or pharmacogenetic activation suppresses infanticide in virgin males.
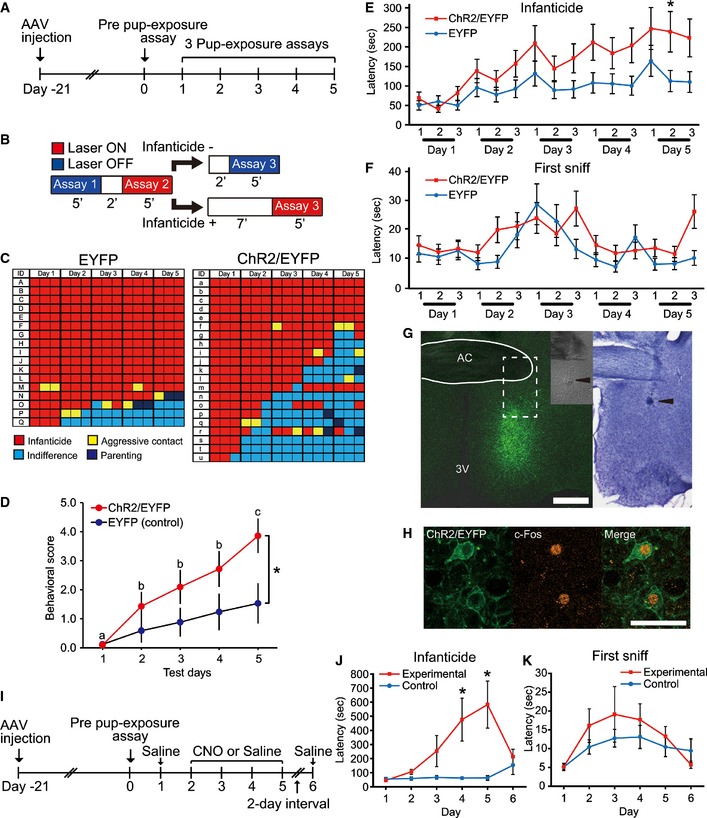
- Timeline of the optogenetic experiments. AAV vector was injected into the cMPOA, and 3 weeks later, the pup‐exposure assay without light emission was performed. Infanticidal males were then subjected to three pup‐exposure assays per day for 5 consecutive days.
- Schema of laser stimulation during 5 consecutive days of three pup‐exposure assays. The presence or absence of optical stimulation in the 3rd session depended on the male's behavior toward pups (infanticide or not) in the 2nd session.
- Behavior of mice in each group during 5 consecutive days of three pup‐exposure assays. Infanticide (red), aggressive contact (yellow), indifference (light blue), parenting (retrieved the pup) (dark blue).
- Mean (± SE) behavioral score of virgin males during 5 consecutive days of three pup‐exposure assays. Behaviors in each session were scored as follows: infanticide = 0; aggressive contact = 1; indifference = 2; and parenting (retrieving the pup to the nest) = 3. The score for the day was the sum of scores for three sessions. Comparing the parenting scores of the ChR2+ and ChR2− groups with two‐way repeated‐measures ANOVA (day × group), a significant difference was found on the 5th day (F(1, 36) = 6.57, P = 0.015).
- Mean (± SE) latency of infanticide of virgin males during 5 consecutive days of three pup‐exposure assays (*P < 0.05).
- Mean (± SE) latency of the first pup sniffing of virgin males during 5 consecutive days of three pup‐exposure assays.
- (Left) A representative fluorescence photomicrograph showing the expression of ChR2/EYFP at the cMPOA. The inset is the differential interference contrast microphotograph of the dashed rectangular area of the same section. (Right) The counterstaining of the section in the left panel using cresyl violet. The arrowheads indicate the end tip of the optical fiber. ac: the anterior commissure. Scale bar = 0.20 mm.
- A confocal fluorescence photomicrograph of the section shown in (G) at higher magnification. ChR2‐EYFP (green); c‐Fos immunoreactivity (red) induced by light stimulation. Scale bar = 50 μm.
- Timeline of the pharmacogenetic experiments. AAV vector was injected into the cMPOA, and 3 weeks later, the pup‐exposure assay was performed once a day after intraperitoneal injection of clozapine‐N‐oxide (days 2–5) or physiological saline (days 1 and 6).
- Mean (± SE) latency of the infanticidal behavior of virgin males during 6 days of three pup‐exposure assays (*P < 0.05).
- Mean (± SE) latency of the first pup sniffing of virgin males during 6 days of three pup‐exposure assays.
While 13 out of 17 (76%) control (EYFP only) mice committed infanticide in all three tests on the 5th day, only six out of 21 (29%) ChR2+ mice did so (Fig 7C, P = 0.0081, Fisher's exact probability test). A two‐way ANOVA with repeated measures (group × session) using data on the latency of infanticide (Fig 7E) in the ChR2/EYFP and EYFP groups revealed significant main effect of group (F (1, 36) = 7.5, P < 0.01) and session (F (14, 504) = 17.9, P < 0.01). The group × session interaction was also significant (F (14, 504) = 3.4, P = 0.01). Post hoc comparisons showed that ChR2/EYFP mice took a significantly longer time to initiate infanticide than EYFP control mice in the second session on day 5. A similar analysis of the latency of first sniffing (Fig 7F) did not show any such difference between the groups, suggesting that sensorimotor ability and social motivation were essentially normal irrespective of experimental manipulations. When the level of parenting was scored on a scale from 0 (infanticide) to 3 (parenting), the scores of the ChR2+ and ChR2− groups with two‐way repeated‐measures ANOVA (day × group) showed a significant increase, again only on the 5th day (F(1, 36) = 6.57, P = 0.015, Fig 7D).
These analyses consistently showed a clear day‐order effect of infanticide suppression. However, we observed no acute effect of cMPOA stimulation (Table EV3); among the 22 instances that the ChR2‐expressing mice changed their behavior from infanticide in the previous pup‐exposure assay to non‐infanticide in the next assay, only four cases (18.2%) were at the shift from light OFF → ON in two successive sessions, and the majority of cases (10; 45.5%) occurred at the shift from light ON (third assay of the previous day) → light OFF (first assay of the next day) (Table EV3). Among mice who did not perform infanticide in one session, reversion to infanticide in the next session was rare (10/98, 10.2%), and the rest (88/98, 89.8%) remained non‐infanticidal in the next assay irrespective of light exposure. Of the 16 ChR2‐expressing mice who stopped performing infanticide at some point, the majority (10; 62.5%) never exhibit infanticide again even at light OFF sessions (Fig 7C).
The persistent but slow nature of the behavioral change induced by the optogenetic stimulation of cMPOA was unexpected for the postulated GABAergic inhibition mechanism and could be due to the methodological limitations such as unilateral stimulation. To address this caveat, we utilized a second viral vector‐mediated approach, expressing Gq‐DREADD (Designer Receptors Exclusively Activated by Designer Drugs) (Sternson & Roth, 2014) bilaterally in the cMPOA of virgin male mice (Fig 7I). Neurons expressing Gq‐DREADD respond to the injected ligand clozapine‐N‐oxide (CNO) by depolarization and burst firing. The members of the control group, which received only saline injections, committed infanticide on days 1 through 6. Out of the 16 members of the experimental group, which received a CNO injection from day 2 to 5, three became non‐infanticidal (one on days 3–5, one on days 4 and 5, and one on day 5). This small difference between the control and the experimental group did not reach statistical significance (Fisher's exact probability test). However, when the latency of behavior is taken into account, the effect of pharmacogenetic activation of MPOA was detected, again with the slow time course (Fig 7J). A two‐way ANOVA with repeated measures (group × day) revealed a significant main effect of day (F (5, 115) = 4.1, P < 0.01) and group × day interaction (F (5, 115) = 4.3, P < 0.01). Post hoc comparisons showed that experimental mice took a significantly longer time to initiate infanticide than control mice on days 4 and 5, comparable to the time course of the optogenetic experiment. The sniffing latency was comparable between the experimental and control groups (Fig 7K; a significant main effect of day (F (5, 115) = 3.41, P < 0.01) but not group (F (1, 23) = 0.5, P = 0.47) or group × day interaction (F (5, 115) = 0.7, P < 0.65)). We concluded that the activation of cMPOA neurons had no acute effects, but could produce a gradual suppression of infanticide.
Discussion
In this study, we identified the four preoptic‐BST nuclei that allow us to retroactively discriminate the social behavior of male mice based only on their c‐Fos expression pattern. The precise neuroanatomical delineation of the preoptic‐BST nuclei was indispensable to accurately localize the nuclei activated by each social situation. Among them, activation of BSTrh and cMPOA not only is robustly correlated with, but also facilitates infanticidal and paternal motivation, respectively. Infanticide and paternal care are mutually exclusive behaviors, and male mice generally express only one at a time. Such a flip‐flop, bistable behavioral switch has been found in other behavioral systems including sleep/wake state transitions (Saper et al, 2001, 2010) and hormonal regulation of hunger/fed state (Yang et al, 2011). In these systems, mutually inhibitory circuits between the centers of opposite behaviors have been proposed for the prompt selection of only one of these behaviors at a time. Therefore, we sought a mutually inhibitory relationship between the cMPOA and BSTrh and found GABAergic projections from cMPOA to BSTrh. Surprisingly, however, activation of the cMPOA projections by optogenetic as well as pharmacogenetic stimulation caused significant, but only gradual inhibition of infanticide on the timescale of days. This slow time course of the effect does not fit the model of simple and immediate GABAergic inhibition of BSTrh. Consistent with this conclusion, we have so far not succeeded in detecting a direct GABAergic inhibitory current in the BSTrh neurons by patch‐clamp recording from brain slices of male mice expressing ChR2 in the cMPOA neurons under light stimulation (T. Amano and K. Tokita, unpublished observation, 2014). These data rather suggest an alternative circuit hypothesis; for example, the cMPOA neurons project onto interneurons of the BSTrh as well as the surrounding areas, and gradually remodel the neural circuit through gene expression and morphological changes culminating in suppression of infanticide. Such a model fits better to the natural time course of the emergence of paternal behavior, which takes about 2 weeks after mating, and lasts at least 2–3 weeks (vom Saal, 1985; Tachikawa et al, 2013).
A recent study by Wu et al (2014) reported that optogenetic stimulation of all MPOA galanin neurons could immediately suppress infanticide and induce parental behavior in male mice, unlike the present study. While our study used non‐genetically targeted manipulations, Wu et al's study described direct manipulation of galanin‐expressing neurons, perhaps explaining the more rapid and drastic effects of optogenetic stimulation they report. However, several caveats should be noted. First, Wu et al's stereotaxic manipulation using 800‐nl injections per each side was less specific than ours as it covered the whole MPOA, including MPNm, cMPOA, ACN and even periventricular POA, and caused hyperlocomotion as well as perturbation of other behaviors (online Extended Data Fig 9 in Wu et al, 2014). Second, their definition of parental “pup‐grooming” behavior included sniffing (“as the male sniffs or licks the pup,” online Methods section in Wu et al, 2014). It is true that, particularly when in the nest, pup licking in mice is difficult to visually discriminate from pup sniffing (Kuroda et al, 2011). However, it is rather atypical to include even explicit sniffing (such as those without direct contact) into parental grooming, in the context of previous literature on parental behavior (Fleming et al, 1979; Liu et al, 1997; Champagne et al, 2004). Third, in stimulation trials, the authors delivered blue light to the MPOA whenever the male contacted a pup with its snout, and the stimulated fathers did more “pup grooming” but much less crouching over pups compared with non‐stimulated control fathers. Their conclusion for this observation that these stimulated fathers were more parental than control is tenuous considering that crouching is a more common parental behavior and that the overall parenting duration (retrieval + grooming + crouching + nest building) was longer in non‐stimulated fathers than in stimulated fathers (Fig 5i in Wu et al, 2014). The MPOA is highly heterogenous area that contains at least nine distinct subregions, each having specific functions ranging from autonomic regulation, homeostasis and various behaviors including male sexual behavior (Simerly, 2004). Therefore, specific stimulation of the neurons responsible for parental behavior, both genetically and anatomically, would be preferable in future studies to fully elucidate the role of each neuronal subpopulation of the heterogenous MPOA.
Although the precise circuit mechanism remains to be clarified, all the available evidence indicates the critical role of cMPOA as the “parenting locus” for both maternal (Tsuneoka et al, 2013) and paternal behaviors in mice. The mouse MPNm, which corresponds to the medial sexually dimorphic nucleus in rats, expresses high level of sex hormone receptors and has been strongly implicated in male mating behavior in rodents (Simmons et al, 2011; Veening & Coolen, 2014; see also Balthazart & Ball, 2007). The MPNm is adjacent to the cMPOA, and the cMPOA is also activated during mating. Therefore, it is tempting to test whether cMPOA activation during mating could shift the power balance between cMPOA and BSTrh to change the male's behavior from infanticide to parenting, which occurs only gradually during the 19 days of gestation (vom Saal, 1985; Tachikawa et al, 2013).
Compared with the drastic abolishment of paternal care after a cMPOA lesion, the effect of a BSTrh lesion on infanticide inhibition was partial. Furthermore, relatively few projections go from BSTrh to cMPOA suggesting the possibility that there is another brain area responsible for infanticide along with BSTrh, similar to how the ACN is most remarkable for parenting‐induced c‐Fos expression, while the lesion effects on parental behavior inhibition is strongest in the cMPOA (Tsuneoka et al, 2013). The BST is regarded as the extended amygdala and receives the major input from the amygdalar complex as the relay center of stria terminalis. Therefore, we are currently investigating various amygdalar nuclei for their possible contribution to infanticidal behavior.
Like the MPOA, the BST is also highly heterogenous and contains at least 12 distinct nuclei (De Olmos et al, 2004). Moreover, during prenatal development, the posterior BST neurons migrate toward the MPOA and blend with the posterior MPNm to form the “preoptic continuation of the BST” (Bayer & Altman, 1987, 2004). Therefore, the preoptic‐BST boundary cannot be determined singly by cytoarchitecture, but requires careful neurochemical dissection (Broadwell & Bleier, 1976; Ju & Swanson, 1989). The BST nuclei have been implicated in a number of functions including sexual behavior, autonomic functions, fear, anxiety and drug addiction (Stamatakis et al, 2014). Distinct BST subnuclei (Kim et al, 2013) and distinct projections to the ventral tegmental area (Jennings et al, 2013) may also convey anxiolytic and rewarding effects. The present study revealed that the BSTrh was specifically activated by infanticide, as well as that BSTrh bilateral lesions led to a significant increase in infanticide latency. BSTrh has also been implicated in predatory behavior (Comoli et al, [Link]), suggesting a possible role of BSTrh in an offensive attack. Investigating sexual dimorphism of circuits that involve BSTrh would be of great interest to identify the neural basis of behavioral sexual dimorphism in infanticidal behavior.
In addition to the complexity in the local circuit, the upstream circuits that convey pup‐derived sensory input to the preoptic‐BST nuclei are also intricate. In laboratory mice, parental behavior is heavily dependent on the main olfactory input (Belluscio et al, 1998; Wang & Storm, 2011), while infanticide requires vomeronasal input to the accessory olfactory system (Tachikawa et al, 2013; Wu et al, 2014). Therefore, the neural circuits for parenting (the main olfactory system and cMPOA) and for infanticide (the accessory olfactory system and BSTrh) appear to be segregated. However, the BSTrh does not receive much input from the accessory olfactory system‐related areas, but instead is targeted by the main olfactory‐related basomedial, basolateral and central amygdalar areas (Dong et al, 2001). Also, the cMPOA appears to receive inputs from the posterodorsal medial amygdala, one of the vomeronasal amygdala, but not much from the olfactory amygdala (Simerly & Swanson, 1986). This suggests that the olfactory inputs may be inhibitory rather than stimulatory, or an olfactory‐related area other than the amygdalar complex may send projections conveying the olfactory information to the BSTrh and cMPOA. More investigation on functional neuroanatomy from the primary sensory input to these central brain areas will be required to elucidate the whole neurocircuitry involved in the information processing that determines the context‐dependent behaviors toward pups.
In this study, we demonstrated the remarkable capacity of the activation pattern in the four preoptic‐BST nuclei to retroactively detect major repertoires of social behaviors of male mice. It would be of great interest to test whether these results translate to other species, especially primates. Considering the evolutionary conservation of the preoptic‐BST region among mammals, it is probable that similar anatomical structures retain the molecular trace of the recent social behaviors and motivations in primates as well. Although the current procedure of c‐Fos counting is invasive, future technical advances may enable non‐invasive, real‐time measurements of neuronal activity in these preoptic‐BST nuclei. This is the first study to present the theoretical possibility of dissociating an individual's motivation for parenting or infanticide by neuroimaging. Once established, such a method could be utilized for detection of child‐directed aggression or sexual assault and would ultimately contribute to children's safety.
Materials and Methods
Animals
All animal experimentation was approved by the Animal Experiment Judging Committee of RIKEN and was conducted in accordance with the National Institutes of Health guide “Principles of Laboratory Animal Care” (NIH publication no. 85–23, revised 1985). The male C57BL/6J mice used for this study were originally obtained from the Jackson Laboratory and were raised in our breeding colony under controlled conditions (12‐h light/dark cycle; lights on at 8:00 A.M.; 23 ± 2°C; 55 ± 10% humidity; and ad libitum access to water and food). Male mice were weaned at 4 weeks of age and were housed in groups of four or five in ventilated shoebox cages (267 × 483 × 152 mm) with TEK‐Fresh bedding (Harlan, Indianapolis, IN, USA). For pup‐exposure assays, male mice were housed individually in clean cages with purified paper bedding (Alpha‐Dri, Shepherd Specialty Papers, Watertown, TN, USA) and a piece of cotton square (Nestlet, Ancare, Bellmore, NY, USA) as nest material. All mice were 12–16 weeks old at the start of the experiments. Any litter bias was avoided by allocating approximately an equal number of littermates to each experimental group. The sequential and spatial order of the experimental procedure, including the stereotaxic surgery or behavioral testing, was randomized among experimental groups.
For c‐Fos expression analysis described in Figs 1 and 2, the virgin male mice were housed individually 2 days before the first behavioral testing. They were subjected to a pre‐pup‐exposure assay (pre‐test) to determine their initial pup‐directed behavior, and then after 2 days, they were subjected to the main pup‐exposure assay for c‐Fos expression. Father males were produced by cohabitation with a female mate until the postpartum day 3, pre‐tested for paternal behavior and then separated to a new cage as described above for the virgin males. After an additional 2 days of separation, they were subjected to the main pup‐exposure assay for c‐Fos expression.
Assessment of pup‐directed behaviors
Pup‐directed behaviors of male mice were examined as described (Kuroda et al, 2011). Briefly, three unfamiliar pups of 1–5 days of age were gently introduced to the corner of the home cage of the subject male mice avoiding the nest. Behavioral responses toward pups were observed, and the latencies of sniffing, pup retrieval, pup grouping (collecting all three pups in the nest so that the pups contact each other) and infanticide (pup biting) were recorded in a blinded setting (observers could see only the IDs of the mice without knowing which treatment they underwent). Also, the males' behavior was coded at 15‐s intervals for pup sniffing, pup licking, nest building, retrieval, crouching over pups and non‐pup‐directed behaviors (such as feeding, resting, running in the cage). In addition, pups' audible distress calls induced by the males' contact were noted. On average, this assay lasted 30 min and was performed once per day, except for the following cases: (i) When male mice started to bite the pup (which was defined as “infanticide”), observation was immediately terminated to rescue the pups, and the injured pups were euthanized. (ii) For the c‐Fos expression study, pup exposure lasted for 2 h without touching the animals in the cage, and the male subject was anesthetized for perfusion fixation. (iii) For the indirect presentation of pups, three empty wire‐mesh balls (tea balls, 45 mm diameter; Minex Metal, Niigata, Japan) were placed in the home cage 2 days before the assay, removed from the cage before starting experiments and then immediately reintroduced with three unfamiliar pups. For control (non‐pup‐exposed) mice, virgin males were handled similarly, except that the pups were not introduced in the mesh balls. Two hours later, the males were anesthetized for perfusion fixation. (iv) To assess the effect of excitotoxic brain lesions, direct pup exposure was conducted once per day for three successive days for 30 min as described above. Subsequently, 2 days after the 3rd test, the 4th pup retrieval test was conducted for 2 h as (ii), and then, the males were anesthetized and perfused and the brains were subjected to histochemical analysis. (v) For the optogenetic stimulation experiment, three pup‐exposure assays were performed per day, each assay lasting 5 min. If the male performed infanticide, the pups were immediately removed, but fresh pups were introduced for the next 5‐min assay.
At the end of the assay, the subject male mice were classified as “parental” when the males retrieved at least one pup to the nest, “infanticidal” when the males bit the pup to cause skin damage or internal bleeding, and “indifferent” when the males did not perform either pup retrieval or infanticide. For the optogenetic experiment (Fig 7C), an additional category of “aggressive contact” was used, when the males exhibited violent behaviors such as sniffing/licking/poking of pups using their snout and eliciting distress vocalizations from the target pups. Aggressive contact did not cause any bleeding or damage of the pups' skin. This aggressive contact often precedes biting; thus, it was classified as intermediate between “infanticide” and “indifference.” This assumption was retrospectively confirmed by Fig 7C, in which “aggressive contact” generally appeared in between these categories. For the other experiments where each pup‐exposure assay lasted 30 min, “aggressive contact” was rare, because the males eventually fall either into “infanticide” or “indifference.”
Behavioral testing for mating and inter‐male aggression
For assessing c‐Fos expression during mating behavior, apparently proestrous parous female mice, whose vagina was gaping and the tissues were moist (Champlin et al, [Link]), were gently introduced into the home cage of the virgin male. Their mating behaviors were monitored for 30–60 min to confirm ejaculation, or otherwise excluded from the subsequent analyses. The males were anesthetized and perfused to sample their brains 2.5 h after the introduction.
For assessing c‐Fos expression during aggressive behavior, 8‐week‐old male mice were introduced into the home cage of the virgin male. Their behaviors were monitored for 15 min to confirm more than two times of aggressive biting and/or fighting episodes, or otherwise excluded from the subsequent analyses. The recipient males were anesthetized for perfusion fixation 2 h after the introduction.
Stereotaxic surgery for lesion and tracer studies
The excitotoxic amino acid, N‐methyl‐D‐aspartic acid (NMDA, Sigma‐Aldrich, St. Louis, MO, USA), and the non‐toxic optical isomer of NMDA, N‐methyl‐L‐aspartic acid (NMLA, Sigma‐Aldrich), were used for surgery. Mice in the bilateral lesion group received bilateral NMDA injection; mice in unilateral lesion group received unilateral NMDA injection, and NMLA was injected into contralateral side; mice in the control lesion group received bilateral NMLA injection.
Fifty‐five virgin males that had no prior exposure to pups except for their littermates received either bilateral, unilateral or control BSTrh lesions. Fifty fathers were cohabitated with their own pups and mate female mates until postnatal day 3, pre‐tested twice to confirm their paternal pup retrieval and then received either bilateral, unilateral or control cMPOA lesions. The NMDA or NMLA solution at 20 mg/ml in phosphate‐buffered saline was injected stereotaxically into cMPOA or BSTrh through a pulled glass capillary (tip diameter 20–50 μm) by oil pressure under pentobarbital anesthesia (30 mg/kg, i.p.) under sterile conditions. The stereotaxic coordinates based on the bregma zero reference point were taken from the mouse brain atlas (Franklin & Paxinos, 2007): For the cMPOA, they were A 0.1 mm, L 0.55 mm, V −5.1 mm; for the BSTrh, they were A −0.1 mm, L 1.2 mm, V −4.2 mm. The injection volume was 15 nl for cMPOA and 20 nl for BSTrh. After surgery, the wound was closed by silk suture and the mice were allowed a 4‐day recovery period and were subjected to behavioral experiments.
The retrograde tracer, Fluorogold (0.1 ng/10 nl, Biotium, Inc., Hayward, CA, USA), was injected unilaterally into the cMPOA or BSTrh in the same manner and using the same coordinates as the NMDA injection (n = 12 and 13, respectively). After surgery, the mice were allowed a 7‐day recovery period and were anesthetized and perfused and the brains were subjected to histochemical analysis.
Preparation of brain sections
Mice were deeply anesthetized with sodium pentobarbital (50 mg/kg, i.p.) and then perfused transcardially with 4% (w/v) paraformaldehyde (PFA) in phosphate‐buffered saline (PBS, pH 7.4). The brains were removed, immersed in the same fixative at 4°C overnight, followed by cryoprotection in the series of 20 and 30% (w/v) sucrose in PBS for 2 days, embedded in O.C.T. Compound (Sakura Finetek Japan, Tokyo, Japan) and stored at −80°C until cryosectioning. Brains were cryosectioned coronally at a thickness of 40 μm according to the mouse brain atlas (Franklin & Paxinos, 2007). Every 3rd section from the serial sections was processed for immunohistochemistry (IHC) or ISH combined with IHC. The remaining sections were used to confirm the reproducibility of antibodies and riboprobes, using at least two samples for each molecule.
Immunohistochemistry and in situ hybridization
Immunohistochemistry on free‐floating sections was performed essentially as described (Tsuneoka et al, 2013). In the c‐Fos expression study, triple labeling was performed by immunohistochemical detection of c‐Fos, galanin and vasoactive intestinal peptide (VIP). The sections were washed with PBS containing 0.2% Triton X‐100 (PBST), incubated with 0.3% H2O2 in methanol for 5 min, washed with PBST, blocked with 0.8% Block Ace (Dainihon‐Seiyaku, Osaka, Japan) in PBST and incubated at 4°C overnight with rabbit primary antibody against c‐Fos (1:8,000, sc‐52, Santa Cruz Biotechnology, Inc., Dallas, TX, USA). The following morning, the sections were washed and incubated with biotin‐conjugated horse anti‐rabbit secondary antibody (1:2,000, BA‐1100, Vector Laboratories, Inc., Burlingame, CA, USA) for 2 h and then in ABC peroxidase reagent (Vectastain ABC Elite kit; Vector Laboratories) for 1 h according to the manufacturer's instructions. The labeling was visualized by incubation in 3,3′–diaminobenzidine (DAB) solution with nickel intensification (DAB peroxidase substrate kit, Vector Laboratories) for 5 min. Following the first staining, the sections were processed similarly for VIP except the staining procedure used rabbit primary antibody against VIP (1:20,000, AB982; Chemicon, Billerica, MA, USA) and a DAB solution without nickel. Finally, the sections underwent the third staining, which combined rabbit anti‐galanin antibody (1:10,000, T‐4334, Peninsula Laboratories, LLC, San Carlos, CA, USA), anti‐rabbit secondary antibody and the ABC alkaline phosphatase reagent (Vectastain ABC‐AP kit, Vector Laboratories). The pink–red color was developed by 30 min of immersion in Vector Red substrate (Vector Red Alkaline Phosphatase Substrate Kit, Vector Laboratories).
To map subregions in the BST, in addition to the Nissl staining with cresyl violet, in situ hybridization was performed for Glutamate decarboxylase 1 (Gad67), Neurotensin, Cart mRNAs in combination with immunohistochemical detection of c‐Fos, galanin, tyrosine hydroxylase (TH) and/or VIP. For the lesion study, double labeling of NeuN and VIP was performed to examine the cell death area. For the tract‐tracing study, double ISH with Solute carrier family 17, member 6 (Vglut2) and Gad67 riboprobes was performed in combination with immunohistochemical detection of Fluorogold. It should be noted that, in the MPOA‐BST area, Gad65 mRNA distribution was similar to Gad67 mRNA, and either Vglut1 or Vglut3 mRNA was scarcely expressed (data not shown) (see also Allen Mouse Brain Atlas available from: http://mouse.brain-map.org). The specificity of each ISH probe was confirmed by comparison with the previous literature and with the Allen Mouse Brain Atlas database, rather than testing each sense probe.
Riboprobes for ISH were prepared using the following sequences: nucleotides 238–2,676 of Vglut2 (NM_080853); 313–3,200 of GAD67 (NM_008077); 1–1,178 of Neurotensin (NM_024435); and 247–869 of Cart (NM_013732). The riboprobes were transcribed from cDNA clones in recombinant plasmids provided by the RIKEN mouse cDNA library (FANTOM3 clone). The template cDNA was linearized by amplification with polymerase chain reaction (PCR) using the specific primers (sense: 5′ TGTAAAACGACGGCCAGT 3′; antisense: 5′ AGCGGATAACAATTTCACACAGGA 3′), the sequence flanking the cDNA and promoter region of RNA polymerase of the pFLCI plasmid.
The antisense probes were transcribed by T3 RNA polymerase (P2083; Promega, Madison, WI, USA) or SP6 RNA polymerase (P1085; Promega) in the presence of digoxigenin‐labeled UTP (Dig labeling mix; Roche Diagnostics, Basel, Switzerland) or fluorescein‐labeled UTP (Fluorescein labeling mix; Roche Diagnostics) followed by the precipitation with LiCl with ethanol. The VGLUT2 riboprobe was digested by alkaline hydrolysis to reduce the average size to 500 bases.
The brain sections were processed for ISH following a standard procedure as described (Tsuneoka et al, 2013) with some modifications. Briefly, the sections were washed with PBS containing 0.1% Tween‐20 (PBT), postfixed with 4% PFA in PBS for 10 min at room temperature. Then, they were immersed in methanol containing 0.3% H2O2 for 15 min, followed by acetylation with 0.25% acetic anhydride in 0.1 M triethanolamine. The hybridization solution contained 50% deionized formamide, 5× standard saline citrate (SSC, pH 7.0), 5 mM ethylene‐diaminetetraacetic acid (pH 8.0), 0.2 mg/ml yeast tRNA, 0.2% Tween‐20, 0.2% sodium dodecyl sulfate, 10% dextran sulfate and 0.1 mg/ml of heparin. The sections were prehybridized at 58°C in the mixture of the hybridization solution and PBT (1:1) for 30 min, immersed in the hybridization solution for 30 min and then hybridized with the riboprobes (1 μg/ml) at 58°C for 16 h. After hybridization, the sections were washed twice with 2× SSC containing 50% deionized formamide at 58°C for 10 min, incubated with RNase A solution (20 μg/ml) at 37°C for 30 min and rinsed twice in 2× SSC and 0.2× SSC at 37°C (10 min each). The sections were incubated in a peroxidase‐conjugated anti‐digoxigenin antiserum (1:10,000, Roche Diagnostics). The fluorescent signals were detected using tyramide signal amplification as described (Lauter et al, 2011). The sections were immersed in 0.1 M boric buffer (pH 8.5) containing 4 μM biotin‐labeled tyramide, 4% dextran sulfate, 0.05 mg/ml iodophenol and 0.003% H2O2 for 30 min, followed by incubation with 0.1 M glycine‐HCl (pH 2.0) for 10 min to remove peroxidase activity. Then, the sections were incubated in one of the following: a cocktail of anti‐galanin (1:5,000) and anti‐TH (1:10,000, MAB318, Chemicon, Temecula, CA, USA), a cocktail of c‐Fos (1:5,000) and peroxidase‐conjugated anti‐fluorescein (1:200,000, 200‐032‐037 Jackson ImmunoResearch Laboratories, Inc., West Grove, PA, USA) or a cocktail of anti‐VIP (1:20,000) and anti‐fluorescein antibodies 4°C overnight. In the following morning, the sections were washed and immersed in either a cocktail of Alexa647‐conjugated streptavidin (1:20,000, Life Technologies, NY, USA), Alexa488‐conjugated anti‐mouse (1:2,000, Life Technologies) and Alexa568‐conjugated anti‐rabbit antibody (1:1,000, Life Technologies) for double IHC and single ISH, or a cocktail of Alexa647‐conjugated streptavidin (1:20,000) and Alexa488‐conjugated anti‐rabbit antibody (1:1,000, Life Technologies) for single IHC and double ISH. For double ISH, the sections were immersed in 0.1 M boric buffer (pH 8.5) containing 4 μM Alexa568‐labeled tyramide, 10% dextran sulfate, 0.05 mg/ml iodphenol and 0.003% H2O2 for 30 min. Subsequently, they were washed with PBS and then mounted on gelatin‐coated slides using mounting medium (Vectashield; Vector Laboratories).
Histological analysis
Brightfield photomicrographs were obtained using a digital slide scanner (NanoZoomer Digital Pathology; Hamamatsu Photonics, Shizuoka, Japan) with a 20× objective. Photographs for the fluorescent observation were taken using a Nikon microscope Eclipse Ni, equipped with a confocal detection system C2 (Nikon Instruments Inc., Tokyo, Japan). The contrast and brightness of the all photographs were adjusted only linearly and uniformly for all the micrographs used in one experiment, using software (Adobe Photoshop CS5; Adobe Systems, San Jose, CA, USA).
Captured images of c‐Fos staining were thresholded, and c‐Fos‐immunoreactive neurons were automatically labeled by ImageJ, then confirmed and corrected manually. The quantification of the c‐Fos distribution was performed by setting conservative contours of preoptic‐BST nuclei as numerically defined closed outlines using Image J software. The nuclei of the BST were determined in male C57BL/6J mice as described in the Results section. The subregions in the preoptic area were determined based on the previous publications in mice (Tsuneoka et al, 2013); the ACN was identified as the cluster of dense galanin‐ir fibers located posteroventral to the anterior commissure; the MPNm was identified by the dense Nissl staining and sparse distribution of galanin‐ir fibers and located lateral to the third ventricle; the cMPOA was identified by the intermediate distribution of galanin‐ir fibers, divided into the anterior (caMPOA) and posterior (cpMPOA) subdivisions. We defined these nuclei in C57BL/6J males and then set the conservative contours as shown in Fig 2 for males so that the contour fits within each region in all analyzed samples. True delineation requires detailed neurochemical analyses as shown in Fig 1 and often was not compatible with the other experiments. The conservative contour was used in those cases, such as those in Figs 3, 4, 5, 6, 7, to safely indicate the given nucleus.
The loss of NeuN‐ir cells in lesioned mice was examined by comparison with control mice. If the cell loss area did not overlap with cpMPOA or BSTrh conservative contours, the lesion was regarded as mis‐targeted. For the bilateral lesions, success of the lesion was judged by the bilateral area of cell loss (Figs EV3 and EV4).
In the retrogradely labeled sections, the core deposits were identified by the strong Fluorogold immunoreactive area, surrounded by a diffusion zone with weaker immunoreactivity which is known to be not containing sufficient amount of tracer (Leak & Moore, 1997; Miller & Lonstein, 2009). Success of the injection was judged by examining the extent of the core deposits (Fig 6B and G). To verify the number of cells double‐labeled with Fluorogold and riboprobe, labeled neurons in the cpMPOA or BSTrh conservative contours of the ipsilateral side to the injection site were counted manually in the thresholded multiple z‐stack images using ImageJ.
Viral vector‐mediated gene transfer and optogenetic stimulation
AAV2.2.hChR2(H134R).EYFP (3.7E11 viral genome (vg)/ml) and AAV2.2.EYFP (2.2E11 vg/ml) were prepared by co‐transfection of the pAAV.RC (Stratagene, Santa Clara, CA, USA) plasmid and pHelper (Stratagene) plasmid along with either the pAAV.hChR2(H134R).EYFP or pAAV.EYFP (Thomas McHugh's laboratory) plasmids into 293 FT cells (Invitrogen) using 293 fectin (Invitrogen, Carlsbad, CA, USA) to facilitate the DNA transfection. The pAAV.hChR2(H134R).EYFP and pAAV.EYFP plasmids were generated by ligating the hChR2(H134R).EYFP or EYFP PCR‐generated DNA fragments with the consensus Kozak sequence into a vector fragment of the pAAV.DIO.hChR2(H134R).EYFP (Karl Deisseroth lab) digested with EcoRI (New England Biolabs, Ipswich, MA, USA) and XbaI (New England Biolabs) and treated with calf intestinal alkaline phosphatase (New England Biolabs) to remove the loxP and lox2722 sites allowing for the direct expression of either hChR2(H134R).EYFP or EYFP. The plasmids were confirmed by sequencing. For the co‐transfection, the 293 FT cells were plated 24 h prior at a density of 10E7 cells/225‐cm2 flask. After co‐transfection, the transfected 293 FT cells were incubated at 37°C/5% CO2 for 72 h. For purification of the recombinant AAV, the transfected 293 FT cells were removed from the flask with a cell scraper. The cells and supernatant were collected and subjected to three cycles of freeze–thaw at −80 and 37°C. The cells and supernatant were then centrifuged at 2,500 rpm for 30 min. The recombinant AAV was purified using the AAV Purification Virakit (Cell Biolabs, San Diego, CA, USA) with a final volume of approximately 1 ml. The titer of the recombinant AAVs was determined by using four 1:10 serial dilutions of the recombinant AAV in triplicate to compare C t values with a standard recombinant AAV of known titer with the same four 1:10 serial dilutions.
Implantable optic fibers were constructed as described (Sparta et al, 2012), using 100‐μm core NA = 0.22 multimode fibers (Thorlabs, Inc., Newton, NJ, USA) and 1.25‐mm zirconia ferrules (Thorlabs), and selected for the fiber length of 4.5–4.6 mm. The coupling efficiency of the implantable fibers was 80–90%.
A total of 100–200 nl of viral solution was injected at about 30 nl/min injection speed into the left cMPOA as in the NMDA lesion study, and the grass capillary was withdrawn 5 min after the final injection. Then, an optic fiber was implanted to the coordinate A 0.1 mm, L 0.55 mm, V −4.6 mm from the bregma and fixed to the skull using two stainless steel screws (0.8 mm diameter × 1.5 mm length, #00 + 1604; Muromachi Kikai Co. Ltd., Tokyo, Japan) and dental adhesive resin cement (Super‐Bond C&B; Sun Medical, Shiga, Japan). Three weeks after surgery, the mice were subjected to behavioral experiments. We performed only unilateral stimulation to avoid giving excessive stress that may perturb the normal pup‐directed behavior of mice.
Light pulses from a diode laser (LuxX 473 nm ‐ 80mW; Omicron, Taunusstein, Germany) were delivered to the brain through two 100‐μm core optic fibers connected by a 1 × 1 fiber optic rotary joint (Doric Lenses, Inc., Sainte‐Foy, QC, Canada) and a cannula sleeve (Thorlabs). The light power at the constant mode was set to 5 mW at the sleeve and was estimated as about 4 mW at the fiber tip in the brain. Using a Master 8 pulse generator (A.M.P.I., Jerusalem, Israel), 10‐ms pulses were generated at 20 Hz for 1 s, followed by 3 s of laser‐off period. The light power at the sleeve was confirmed as 1 mW at the pulse period using a S140c integrating sphere sensor and PM100D power meter (Thorlabs). Optical stimulation using this parameter was applied for 5 min in a laser ON session.
Subject virgin male mice were group‐housed until 3 months of age at the start of the experiment and then were single‐housed 2 days before the preparatory pup‐exposure assay (pre‐test) and throughout the experiment. Infanticidal males were selected in the pre‐test and subjected to the surgery as above. Three weeks after the surgery, the mice were again confirmed for the infanticidal behavior under non‐stimulated conditions and then subjected for the behavioral testing with optogenetic stimulation for 5 successive days. In each day, three 5‐min sessions of pup exposure were conducted by introducing a 1‐ to 5‐postnatal‐day‐old pup into the home cage of the subject. In the 1st session, a pup was placed into the home cage of the virgin male in the absence of optical stimulation. In the 2nd session, the virgin male's brain was optically stimulated for 5 min while a pup was presented. In the 3rd session, a pup was similarly presented but optical stimulation was applied if the virgin male showed infanticidal behavior toward a pup in the 2nd session. After the above behavioral experiments, the first batch of mice received 15‐min light emission at pulse mode 2 h before perfusion fixation, to optimize the fiber placement and c‐Fos expression in ChR2‐EYFP‐positive cells by double immunostaining using anti‐GFP and anti‐c‐Fos antibodies. Then, later batches of the ChR2‐expressing mice were used for patch‐clamp electrophysiological recordings (see the Discussion section). Slice patch‐clamp recordings were not compatible with the c‐Fos expression analysis induced by light stimulation through the optical fiber, therefore, ChR2 expression alone was examined. Mice without proper expression of these genes in cMPOA or proper placement of the optic fiber were excluded from the analysis (43 out of 81 males subjected for the surgery). Except for two males during the preparatory experiments, no behavioral abnormality such as hyperlocomotion was observed.
Viral vector‐mediated gene transfer and pharmacogenetic stimulation using Gq‐DREADD
Subject virgin male mice were group‐housed until 3 months of age at the start of experiment and then were single‐housed 2 days before the preparatory pup‐exposure assay (pre‐test to confirm infanticidal behavior) and throughout the experiment. A total of 100–120 nl of viral solution ((AAV2.2.‐hSyn‐HA‐hM3D(Gq)‐IRES‐mCitrine) (2.0E13 vg/ml); The Vector Core at the University of North Carolina at Chapel Hill, USA) was injected at an approximate speed of 30 nl/min into the bilateral cMPOA, and the grass capillary was withdrawn 5 min after the final injection. Three or four weeks after AAV injection, the mice were subjected to the 6‐day behavioral testing where they were intraperitoneally injected with either physiological saline (1% of bodyweight) or clozapine‐N‐oxide (CNO) (2 mg/kg of bodyweight in saline) 30 min before the beginning of pup exposure (Armbruster et al, 2007; Alexander et al, 2009). The mice in the experimental group (n = 16) were injected with saline on day 1 to measure the baseline behavioral level, and with CNO from day 2 to day 5. After a 2‐day interval, on day 6 they were injected with saline to check their pup‐directed behavior under non‐stimulated conditions again. The mice in the control group (n = 9) were injected with the same amount of saline on day 1 through day 6. On each day, 30‐min sessions of pup exposure were conducted by introducing a 1‐ to 5‐postnatal‐day‐old pup into the home cage of the subject. The latency of sniffing the pup, retrieving and pup biting was recorded, and if the pup was injured, it was rescued immediately and euthanized. After the behavioral testing, brain sections were examined for expression of mCitrine using anti‐GFP antibody immunostaining. Mice with improper expression of the gene in cMPOA were excluded from the analysis (17 out of 42 mice subjected to the surgery).
Statistical analysis
Statistical analyses were conducted using software R (R Development Core Team, 2011) and SPSS (IBM, Armonk, NY, USA). The sample size for each experiment was chosen conventionally. After the overall symmetry of datasets was confirmed by scatter plots or histograms, c‐Fos density was analyzed using Welch's one‐way analysis of variance (ANOVA) followed by post hoc comparisons using Welch's t‐test to address unequal variance among groups (Welch, 1938). Post hoc comparisons were conducted among groups of the same exposure type or among exposure types of the same group. In multiple comparisons, the dataset that contained two compared factors was extracted from the complete dataset. The P‐values of all multiple comparisons were adjusted using Holm's sequential Bonferroni method.
Fisher's exact probability test was used for the frequency data.
The relationship between behavioral parameters and the damaged area in the lesioned mice was examined by calculating the Spearman's correlation index. Mice whose behaviors were statistically examined included both mis‐targeted and successfully lesioned mice.
The classification tree analysis, a recursive partitioning method for nonparametric regression and classification, was run using the party package for the statistical software R (Strobl et al, 2009). A split is implemented when the (1 – multiplicity‐adjusted P‐value) exceeds 0.995, and no pruning or cross‐validation was added. A random forest analysis with the one‐leave‐out method showed more than 90% accuracy of classification (data not shown).
Author contributions
YT designed and performed c‐Fos expression, NMDA lesion and tract‐tracing studies with help from CY and TA. KT designed and performed the optogenetic and pharmacogenetic experiments with help from KOK, YO, KS, AJH, LMYY and TJM. GE performed the tree model analysis. KOK conceived the study and wrote the manuscript with help from all the authors.
Conflict of interest
The authors declare that they have no conflict of interest.
Supporting information
Expanded View Figures PDF
Table EV1
Table EV2
Table EV3
Review Process File
Acknowledgements
We wish to thank Joshua Johansen and Michael Numan for helpful discussion, James Giarraputo for technical assistance, R. Jude Samulski and the Vector Core at the University of North Carolina at Chapel Hill for the AAV‐Gq‐DREADD virus solution, Alexandra Terashima and Charles Yokoyama for editing the manuscript and the RIKEN Research Resource Center for maintenance of animals. This investigation was supported in part by RIKEN Brain Science Institute (2010–2015 to KK) and by Grants‐in‐Aid for Scientific Research from the Ministry of Education, Culture, Sports, Science and Technology, Japan.
The EMBO Journal (2015) 34: 2652–2670
References
- Alexander GM, Rogan SC, Abbas AI, Armbruster BN, Pei Y, Allen JA, Nonneman RJ, Hartmann J, Moy SS, Nicolelis MA, McNamara JO, Roth BL (2009) Remote control of neuronal activity in transgenic mice expressing evolved G protein‐coupled receptors. Neuron 63: 27–39 [DOI] [PMC free article] [PubMed] [Google Scholar]
- Armbruster BN, Li X, Pausch MH, Herlitze S, Roth BL (2007) Evolving the lock to fit the key to create a family of G protein‐coupled receptors potently activated by an inert ligand. Proc Natl Acad Sci USA 104: 5163–5168 [DOI] [PMC free article] [PubMed] [Google Scholar]
- Balthazart J, Ball GF (2007) Topography in the preoptic region: differential regulation of appetitive and consummatory male sexual behaviors. Front Neuroendocrinol 28: 161–178 [DOI] [PMC free article] [PubMed] [Google Scholar]
- Bayer SA, Altman J (1987) Development of the preoptic area: time and site of origin, migratory routes, and settling patterns of its neurons. J Comp Neurol 265: 65–95 [DOI] [PubMed] [Google Scholar]
- Bayer SA, Altman J (2004) Development of the telencephalon: neural stem cells, neurogenesis, and neuronal migration In The Rat Nervous System, Paxinos G. (ed), Vol. 2, 3rd edn, pp 27–73. San Diego: Elsevier; [Google Scholar]
- Belluscio L, Gold GH, Nemes A, Axel R (1998) Mice deficient in G(olf) are anosmic. Neuron 20: 69–81 [DOI] [PubMed] [Google Scholar]
- Broadwell RD, Bleier R (1976) A cytoarchitectonic atlas of the mouse hypothalamus. J Comp Neurol 167: 315–339 [DOI] [PubMed] [Google Scholar]
- Champagne FA, Chretien P, Stevenson CW, Zhang TY, Gratton A, Meaney MJ (2004) Variations in nucleus accumbens dopamine associated with individual differences in maternal behavior in the rat. J Neurosci 24: 4113–4123 [DOI] [PMC free article] [PubMed] [Google Scholar]
- Champlin AK, Dorr DL, Gates AH (1973) Determining the stage of the estrous cycle in the mouse by the appearance of the vagina. Biol Reprod 8: 491–494 [DOI] [PubMed] [Google Scholar]
- Comoli E, Ribeiro‐Barbosa ER, Negrao N, Goto M, Canteras NS (2005) Functional mapping of the prosencephalic systems involved in organizing predatory behavior in rats. Neuroscience 130: 1055–1067 [DOI] [PubMed] [Google Scholar]
- De Olmos JS, Beltramino CA, Alheid G (2004) Amygdala and extended amygdala of the rat: a cytoarchitectonical, fibroarchitectonical, and chemoarchitectonical survey In The Rat Nervous System, Paxinos G. (ed), 3rd edn, pp 509–603. San Diego: Elsevier; [Google Scholar]
- Dong HW, Petrovich GD, Swanson LW (2001) Topography of projections from amygdala to bed nuclei of the stria terminalis. Brain Res Brain Res Rev 38: 192–246 [DOI] [PubMed] [Google Scholar]
- Dong HW, Swanson LW (2003) Projections from the rhomboid nucleus of the bed nuclei of the stria terminalis: implications for cerebral hemisphere regulation of ingestive behaviors. J Comp Neurol 463: 434–472 [DOI] [PubMed] [Google Scholar]
- Elwood RW (1977) Changes in the responses of male and female gerbils (Meriones Unguiculatus) towards test pups during the pregnancy of the female. Anim Behav 25: 46–51 [Google Scholar]
- Fleming A, Vaccarino F, Tambosso L, Chee P (1979) Vomeronasal and olfactory system modulation of maternal behavior in the rat. Science 203: 372–374 [DOI] [PubMed] [Google Scholar]
- Franklin KBJ, Paxinos G (2007) The Mouse Brain in Stereotaxic Coordinates, 3rd edn San Diego: Academic Press; [Google Scholar]
- Hrdy SB (1974) Male‐male competition and infanticide among the langurs (Presbytis entellus) of Abu, Rajasthan. Folia Primatol (Basel) 22: 19–58 [DOI] [PubMed] [Google Scholar]
- Jennings JH, Sparta DR, Stamatakis AM, Ung RL, Pleil KE, Kash TL, Stuber GD (2013) Distinct extended amygdala circuits for divergent motivational states. Nature 496: 224. [DOI] [PMC free article] [PubMed] [Google Scholar]
- Ju G, Swanson LW (1989) Studies on the cellular architecture of the bed nuclei of the stria terminalis in the rat: I Cytoarchitecture. J Comp Neurol 280: 587–602 [DOI] [PubMed] [Google Scholar]
- Ju G, Swanson LW, Simerly RB (1989) Studies on the cellular architecture of the bed nuclei of the stria terminalis in the rat: II. Chemoarchitecture. J Comp Neurol 280: 603–621 [DOI] [PubMed] [Google Scholar]
- Kennedy HF, Elwood RW (1988) Strain differences in the inhibition of infanticide in male mice (Mus musculus). Behav Neural Biol 50: 349–353 [DOI] [PubMed] [Google Scholar]
- Kim SY, Adhikari A, Lee SY, Marshel JH, Kim CK, Mallory CS, Lo M, Pak S, Mattis J, Lim BK, Malenka RC, Warden MR, Neve R, Tye KM, Deisseroth K (2013) Diverging neural pathways assemble a behavioural state from separable features in anxiety. Nature 496: 219–223 [DOI] [PMC free article] [PubMed] [Google Scholar]
- Kuroda KO, Meaney MJ, Uetani N, Fortin Y, Ponton A, Kato T (2007) ERK‐FosB signaling in dorsal MPOA neurons plays a major role in the initiation of parental behavior in mice. Mol Cel Neurosci 36: 121–131 [DOI] [PubMed] [Google Scholar]
- Kuroda KO, Tachikawa K, Yoshida S, Tsuneoka Y, Numan M (2011) Neuromolecular basis of parental behavior in laboratory mice and rats: with special emphasis on technical issues of using mouse genetics. Prog Neuropsychopharmacol Biol Psychiatry 35: 1205–1231 [DOI] [PubMed] [Google Scholar]
- Lauter G, Soll I, Hauptmann G (2011) Multicolor fluorescent in situ hybridization to define abutting and overlapping gene expression in the embryonic zebrafish brain. Neural Dev 6: 10 [DOI] [PMC free article] [PubMed] [Google Scholar]
- Leak RK, Moore RY (1997) Identification of retinal ganglion cells projecting to the lateral hypothalamic area of the rat. Brain Res 770: 105–114 [DOI] [PubMed] [Google Scholar]
- Lee H, Kim DW, Remedios R, Anthony TE, Chang A, Madisen L, Zeng H, Anderson DJ (2014) Scalable control of mounting and attack by Esr1 + neurons in the ventromedial hypothalamus. Nature 509: 627–632 [DOI] [PMC free article] [PubMed] [Google Scholar]
- Lin D, Boyle MP, Dollar P, Lee H, Lein ES, Perona P, Anderson DJ (2011) Functional identification of an aggression locus in the mouse hypothalamus. Nature 470: 221–226 [DOI] [PMC free article] [PubMed] [Google Scholar]
- Liu D, Diorio J, Tannenbaum B, Caldji C, Francis D, Freedman A, Sharma S, Pearson D, Plotsky PM, Meaney MJ (1997) Maternal care, hippocampal glucocorticoid receptors, and hypothalamic‐pituitary‐adrenal responses to stress. Science 277: 1659–1662 [DOI] [PubMed] [Google Scholar]
- Lonstein JS, Fleming AS (2002) Parental behaviors in rats and mice. Curr Protoc Neurosci Chapter 8: 8.15.11–18.15.26 [DOI] [PubMed] [Google Scholar]
- Miller SM, Lonstein JS (2009) Dopaminergic projections to the medial preoptic area of postpartum rats. Neuroscience 159: 1384–1396 [DOI] [PMC free article] [PubMed] [Google Scholar]
- Morgan JI, Cohen DR, Hempstead JL, Curran T (1987) Mapping patterns of c‐fos expression in the central nervous system after seizure. Science 237: 192–197 [DOI] [PubMed] [Google Scholar]
- Numan M (1974) Medial preoptic area and maternal behavior in the female rat. J Comp Physiol Psychol 87: 746–759 [DOI] [PubMed] [Google Scholar]
- Numan M, Corodimas KP, Numan MJ, Factor EM, Piers WD (1988) Axon‐sparing lesions of the preoptic region and substantia innominata disrupt maternal behavior in rats. Behav Neurosci 102: 381–396 [DOI] [PubMed] [Google Scholar]
- Numan M, Numan MJ (1994) Expression of Fos‐like immunoreactivity in the preoptic area of maternally behaving virgin and postpartum rats. Behav Neurosci 108: 379–394 [DOI] [PubMed] [Google Scholar]
- Numan M (2015) Neurobiology of Social Behavior: Toward an Understanding of Prosocial and Antisocial Brain. London: Elsevier; [Google Scholar]
- Palkovits M, Brownstein MJ (1992) Maps and Guide to Microdissection of the Rat Brain. New York, NY: Appleton & Lange; [Google Scholar]
- R Development Core Team (2011) R: A Language and Environment for Statistical Computing. Vienna: R Foundation for Statistical Computing; [Google Scholar]
- vom Saal FS, Howard LS (1982) The regulation of infanticide and parental behavior: implications for reproductive success in male mice. Science 215: 1270–1272. [DOI] [PubMed] [Google Scholar]
- vom Saal FS (1985) Time‐contingent change in infanticide and parental behavior induced by ejaculation in male mice. Physiol Behav 34: 7–15 [DOI] [PubMed] [Google Scholar]
- Saper CB, Chou TC, Scammell TE (2001) The sleep switch: hypothalamic control of sleep and wakefulness. Trends Neurosci 24: 726–731 [DOI] [PubMed] [Google Scholar]
- Saper CB, Fuller PM, Pedersen NP, Lu J, Scammell TE (2010) Sleep state switching. Neuron 68: 1023–1042 [DOI] [PMC free article] [PubMed] [Google Scholar]
- Schaller GB (1972) The Serengeti Lion: A Study of Predator‐Prey Relations. Chicago: University Chicago Press; [Google Scholar]
- Simerly RB, Gorski RA, Swanson LW (1986) Neurotransmitter specificity of cells and fibers in the medial preoptic nucleus: an immunohistochemical study in the rat. J Comp Neurol 246: 343–363 [DOI] [PubMed] [Google Scholar]
- Simerly RB, Swanson LW (1986) The organization of neural inputs to the medial preoptic nucleus of the rat. J Comp Neurol 246: 312–342 [DOI] [PubMed] [Google Scholar]
- Simerly RB, Swanson LW (1988) Projections of the medial preoptic nucleus: a Phaseolus vulgaris leucoagglutinin anterograde tract‐tracing study in the rat. J Comp Neurol 270: 209–242 [DOI] [PubMed] [Google Scholar]
- Simerly RB (2004) Anatomical substrates of hypothalamic integration In The Rat Nervous System, Paxinos G. (ed), 3rd edn, pp 336–368. San Diego: Elsevier; [Google Scholar]
- Simmons DA, Hoffman NW, Yahr P (2011) A forebrain‐retrorubral pathway involved in male sex behavior is GABAergic and activated with mating in gerbils. Neuroscience 175: 162–168 [DOI] [PMC free article] [PubMed] [Google Scholar]
- Sparta DR, Stamatakis AM, Phillips JL, Hovelso N, van Zessen R, Stuber GD (2012) Construction of implantable optical fibers for long‐term optogenetic manipulation of neural circuits. Nat Protoc 7: 12–23 [DOI] [PMC free article] [PubMed] [Google Scholar]
- Stamatakis AM, Sparta DR, Jennings JH, McElligott ZA, Decot H, Stuber GD (2014) Amygdala and bed nucleus of the stria terminalis circuitry: implications for addiction‐related behaviors. Neuropharmacology 76(Pt B): 320–328 [DOI] [PMC free article] [PubMed] [Google Scholar]
- Sternson SM, Roth BL (2014) Chemogenetic tools to interrogate brain functions. Annu Rev Neurosci 37: 387–407 [DOI] [PubMed] [Google Scholar]
- Strobl C, Malley J, Tutz G (2009) An introduction to recursive partitioning: rationale, application, and characteristics of classification and regression trees, bagging, and random forests. Psychol Methods 14: 323–348 [DOI] [PMC free article] [PubMed] [Google Scholar]
- Sugiyama Y (1965) On the social change of hanuman langurs (Presbytis entellus). Primates 6: 381–418 [Google Scholar]
- Tachikawa KS, Yoshihara Y, Kuroda KO (2013) Behavioral transition from attack to parenting in male mice: a crucial role of the vomeronasal system. J Neurosci 33: 5120–5126 [DOI] [PMC free article] [PubMed] [Google Scholar]
- Trivers RL (1972) Parental investment and sexual selection In Sexual Selection and the Descent of Man 1871–1971, Campbell B. (ed), pp 136–172. Chicago: Aldine‐Atherton; [Google Scholar]
- Tsuneoka Y, Maruyama T, Yoshida S, Nishimori K, Kato T, Numan M, Kuroda KO (2013) Functional, anatomical, and neurochemical differentiation of medial preoptic area subregions in relation to maternal behavior in the mouse. J Comp Neurol 521: 1633–1663 [DOI] [PubMed] [Google Scholar]
- Veening JG, Coolen LM (2014) Neural mechanisms of sexual behavior in the male rat: emphasis on ejaculation‐related circuits. Pharmacol Biochem Behav 121: 170–183 [DOI] [PubMed] [Google Scholar]
- Wang Z, Storm DR (2011) Maternal behavior is impaired in female mice lacking type 3 adenylyl cyclase. Neuropsychopharmacology 36: 772–781 [DOI] [PMC free article] [PubMed] [Google Scholar]
- Welch BL (1938) The significance of the difference between two means when the population variances are unequal. Biometrika 29: 350–362 [Google Scholar]
- Wu Z, Autry AE, Bergan JF, Watabe‐Uchida M, Dulac CG (2014) Galanin neurons in the medial preoptic area govern parental behaviour. Nature 509: 325–330 [DOI] [PMC free article] [PubMed] [Google Scholar]
- Yahr P, Finn PD, Hoffman NW, Sayag N (1994) Sexually dimorphic cell groups in the medial preoptic area that are essential for male sex behavior and the neural pathways needed for their effects. Psychoneuroendocrinology 19: 463–470 [DOI] [PubMed] [Google Scholar]
- Yang Y, Atasoy D, Su HH, Sternson SM (2011) Hunger states switch a flip‐flop memory circuit via a synaptic AMPK‐dependent positive feedback loop. Cell 146: 992–1003 [DOI] [PMC free article] [PubMed] [Google Scholar]
- Yang CF, Chiang MC, Gray DC, Prabhakaran M, Alvarado M, Juntti SA, Unger EK, Wells JA, Shah NM (2013) Sexually dimorphic neurons in the ventromedial hypothalamus govern mating in both sexes and aggression in males. Cell 153: 896–909 [DOI] [PMC free article] [PubMed] [Google Scholar]
- Zhang J, Webb DM (2003) Evolutionary deterioration of the vomeronasal pheromone transduction pathway in catarrhine primates. Proc Natl Acad Sci USA 100: 8337–8341 [DOI] [PMC free article] [PubMed] [Google Scholar]
- Zhang F, Gradinaru V, Adamantidis AR, Durand R, Airan RD, de Lecea L, Deisseroth K (2010) Optogenetic interrogation of neural circuits: technology for probing mammalian brain structures. Nat Protoc 5: 439–456 [DOI] [PMC free article] [PubMed] [Google Scholar]
Associated Data
This section collects any data citations, data availability statements, or supplementary materials included in this article.
Supplementary Materials
Expanded View Figures PDF
Table EV1
Table EV2
Table EV3
Review Process File