

Abstract
Degradation of mitochondria via selective autophagy, termed mitophagy, contributes to mitochondrial quality and quantity control whose defects have been implicated in oxidative phosphorylation deficiency, aberrant cell differentiation, and neurodegeneration. How mitophagy is regulated in response to cellular physiology remains obscure. Here, we show that mitophagy in yeast is linked to the phospholipid biosynthesis pathway for conversion of phosphatidylethanolamine to phosphatidylcholine by the two methyltransferases Cho2 and Opi3. Under mitophagy‐inducing conditions, cells lacking Opi3 exhibit retardation of Cho2 repression that causes an anomalous increase in glutathione levels, leading to suppression of Atg32, a mitochondria‐anchored protein essential for mitophagy. In addition, loss of Opi3 results in accumulation of phosphatidylmonomethylethanolamine (PMME) and, surprisingly, generation of Atg8–PMME, a mitophagy‐incompetent lipid conjugate of the autophagy‐related ubiquitin‐like modifier. Amelioration of Atg32 expression and attenuation of Atg8–PMME conjugation markedly rescue mitophagy in opi3‐null cells. We propose that proper regulation of phospholipid methylation is crucial for Atg32‐mediated mitophagy.
Keywords: autophagy, methylation, mitochondria, phospholipid, yeast
Subject Categories: Autophagy & Cell Death, Metabolism, Physiology
Introduction
Mitochondria act as dynamic, multitasking platforms that constantly remodel their shape and activity in order to adjust their metabolism and signaling for cell homeostasis, death, and differentiation (Kasahara & Scorrano, 2014; Labbe et al, 2014; Mishra & Chan, 2014). The energy‐converting organelles properly change their quantity in response to diverse intra‐ and extracellular cues (Nunnari & Suomalainen, 2012). When cells need high levels of ATP, mitochondrial biogenesis is strongly activated to replicate pre‐existing organelles. Conversely, a decrease in cellular energy demands or hypoxia leads to suppression of their proliferation and induction of their turnover. Since mitochondria also generate reactive oxygen species from the respiratory chain, their quality must be maintained by safeguarding against oxidative stress or eliminating damaged organelles (Rugarli & Langer, 2012; Youle & van der Bliek, 2012).
Numerous studies in the last decade have established that mitochondrial degradation depends on autophagy, a membrane trafficking process in which newly generated cup‐shaped structures, called isolation membranes, sequester cytoplasmic constituents as cargoes and expand to form autophagosomes, double membrane‐bound vesicles that ultimately fuse with lysosomes (or vacuoles in yeast) to digest the cargoes by hydrolytic enzymes for recycling (Mizushima, 2011; Weidberg et al, 2011). Importantly, autophagy can mediate degradation of mitochondria in a highly selective manner, thereby contributing to mitochondrial quality and quantity control (Okamoto, 2014; Rogov et al, 2014; Stolz et al, 2014). Defects in this catabolic process, termed mitophagy, are associated with mitochondrial dysfunction and a myriad of disorders including aberrant hematopoiesis and neuronal degeneration, underscoring its physiological relevance (Ney, 2011; Hirota et al, 2012; Narendra et al, 2012).
Selectivity of mitophagy is determined by various landmark molecules on the surface of mitochondria that recruit core autophagy‐related (Atg) proteins essential for autophagosome biogenesis. Despite the diversity of landmark molecules, the basic principles underlying mitophagy are conserved among eukaryotes (Youle & Narendra, 2011; Liu et al, 2014). There are two major types of mitophagy, receptor‐ and ubiquitin‐mediated processes (Okamoto, 2014). In the budding yeast Saccharomyces cerevisiae, mitophagy requires Atg32, a single‐pass membrane protein anchored to mitochondria (Kanki et al, 2009; Okamoto et al, 2009). Loss of Atg32 results in mitochondrial genome instability during prolonged starvation and chronological lifespan shortening under calorie restriction, highlighting the biological significance of mitophagy (Kurihara et al, 2012; Richard et al, 2013). Atg32 serves as a receptor that interacts with Atg8, a phosphatidylethanolamine (PE)‐conjugated ubiquitin‐like modifier necessary for formation of autophagosomes, and Atg11, a selective autophagy‐specific scaffold required for assembly of core Atg proteins (Kanki & Klionsky, 2008; Kanki et al, 2009; Okamoto et al, 2009). The cytosolically exposed N‐terminal domain of Atg32 is both necessary and sufficient for these protein–protein interactions and mitophagy (Aoki et al, 2011; Kondo‐Okamoto et al, 2012). Phosphorylation of Atg32 stabilizes Atg32–Atg11 interaction, which is a crucial step for promoting degradation of mitochondria (Aoki et al, 2011; Kondo‐Okamoto et al, 2012; Kanki et al, 2013). In addition to this post‐translational modification, induction of the ATG32 gene expression is a key determinant for mitophagy efficiency (Okamoto et al, 2009; Aihara et al, 2014). Indeed, the Atg32 protein levels increase to facilitate mitophagy under non‐fermentable and nitrogen‐depleted conditions (Okamoto et al, 2009; Aoki et al, 2011; Eiyama et al, 2013). Although oxidative stress seems to trigger upregulation of Atg32 in respiring cells (Okamoto et al, 2009), how this signaling event is established remains largely unknown.
Emerging evidence reveals that the receptor‐mediated mitophagy involves an evolutionarily conserved mode of protein–protein interactions between receptor molecules and Atg8 family members including LC3, GABARAP, and GATE‐16 (Noda et al, 2010; Birgisdottir et al, 2013). In mammals, NIX, BNIP3, and FUNDC1 are mitochondria‐anchored receptors that interact with these Atg8 homologs and promote mitophagy in a manner similar to Atg32‐mediated process (Liu et al, 2014). Notably, Atg32–Atg8 interaction contributes to mitophagy, implying the relevance of its evolutionary conservation (Kondo‐Okamoto et al, 2012). How recruitment of Atg8 to the mitochondrial surface assists formation of autophagosomes surrounding mitochondria has not been defined. In addition, whether lipidation of Atg8, a prerequisite step for acting on the autophagosomal membrane, is regulated upon mitophagy remains to be investigated.
Here, we have uncovered a previously unappreciated link between phospholipid biosynthesis and mitophagy. Loss of Opi3, an endoplasmic reticulum (ER)‐localized phospholipid methyltransferase acting in biosynthesis of phosphatidylcholine (PC) from PE (Henry et al, 2012), impairs Atg32 expression and Atg8 lipidation, synergistically leading to strong mitophagy deficiencies. These defects result from aberrantly elevated synthesis of the major antioxidant glutathione (GSH), and atypical conjugation of Atg8 to phosphatidylmonomethylethanolamine (PMME). Thus, our findings demonstrate that mitophagy induction is regulated in concert with phospholipid methylation and implicate that PE‐to‐PC biosynthesis disorders may raise the risk of disrupting autophagosome biogenesis.
Results
Opi3 is required for efficient mitophagy
To elucidate how Opi3 functions in autophagy‐dependent degradation of mitochondria, we examined opi3‐null mutants by microscopy and Western blotting. Cells expressing mitochondrial matrix‐targeted GFP (mito‐GFP) and vacuole‐anchored mCherry (Vph1–mCherry) were grown to stationary phase in medium containing non‐fermentable carbon source and observed using fluorescence microscopy. Since GFP is quite resistant against vacuolar proteases, its fluorescence can be retained in the vacuole. As described previously (Okamoto et al, 2009), wild‐type cells displayed vacuole‐localized green signals, indicating transport of mitochondria to the vacuole in a manner dependent on the mitophagy receptor Atg32 (Fig 1A). By contrast, mito‐GFP was barely overlapped with Vph1–mCherry in cells lacking Opi3 (Fig 1A). Next, processing of mitochondrial matrix‐localized dihydrofolate reductase–mCherry (mito‐DHFR–mCherry) was monitored for cells grown under the same conditions. Upon mitophagy, mitochondria are degraded, and mito‐DHFR–mCherry is processed to become a free mCherry in the vacuole (Kondo‐Okamoto et al, 2012). Consistent with our microscopic observations, loss of Opi3 resulted in a strong reduction in mitochondrial degradation (31% compared with wild‐type cells) (Fig 1B and C), which could be effectively rescued by reintroduction of the OPI3 gene into the null mutant (Fig EV1A and B). We also found the higher protein levels of Por1 and Mge1, authentic mitochondrial outer membrane and matrix proteins, respectively, in cells lacking Opi3 compared to those in wild‐type cells under prolonged respiratory growth, further confirming the mitophagy defects (Fig 1D and E).
Figure 1. Cells lacking Opi3 exhibit severe mitophagy defects.
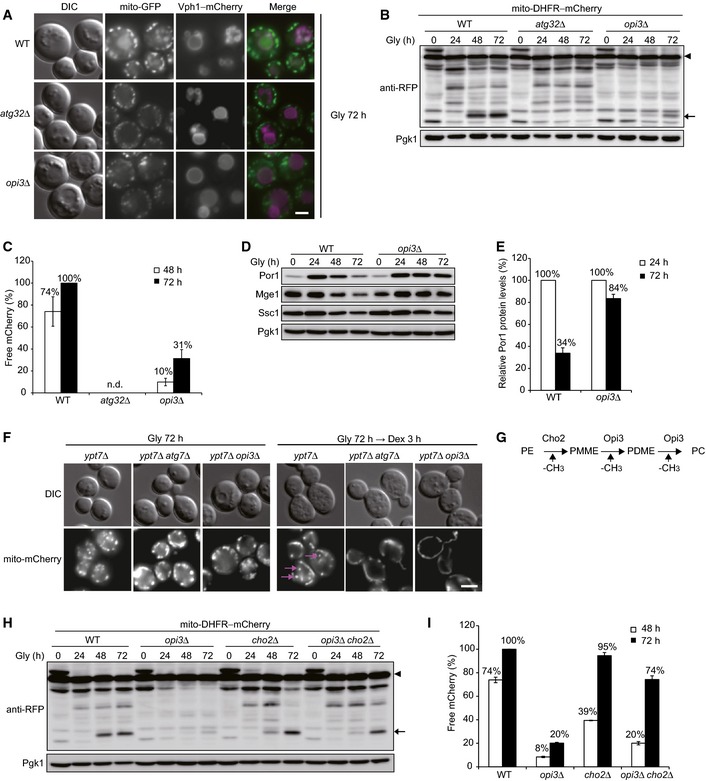
- Representative images of mitochondria‐targeted GFP (mito‐GFP) and vacuole‐targeted mCherry (Vph1–mCherry) patterns. Wild‐type, atg32Δ, and opi3Δ cells were grown in glycerol medium (Gly) for 72 h and observed under a fluorescence microscope. Scale bar, 2 μm.
- Wild‐type, atg32Δ, and opi3Δ cells expressing mito‐DHFR–mCherry (depicted by arrowhead) were cultured as in (A). Cells were harvested at the indicated time points and subjected to Western blotting. Generation of free mCherry (depicted by arrow) indicated transport of mitochondria to the vacuole. Pgk1 was monitored as a loading control.
- The amounts of free mCherry detected in (B) were quantified at the indicated time points. The signal intensity value of free mCherry in wild‐type cells at 72 h was set to 100%. Data represent the averages of three experiments, with error bars indicating standard deviations.
- Authentic mitochondrial proteins in wild‐type and opi3Δ cells cultured as in (B) were analyzed by Western blotting. Por1 is an outer membrane protein. Mge1 and Ssc1 are matrix proteins. Pgk1 was monitored as a loading control.
- The Por1 protein levels analyzed in (D) were quantified at the indicated time points. The signal intensity values in wild‐type and opi3Δ cells at 24 h were set to 100%. Data represent the averages of three experiments, with error bars indicating standard deviations.
- Representative images of mitochondria‐targeted mCherry (mito‐mCherry) patterns. ypt7Δ, ypt7Δ atg7Δ, and ypt7Δ opi3Δ cells grown in glycerol medium (Gly) for 72 h were shifted to fresh dextrose (Dex) medium for 3 h and observed as in (A). Mitophagosomes are depicted by arrows. Scale bar, 2 μm.
- A schematic diagram of the phospholipid methylation pathway in the yeast S. cerevisiae. Cho2 and Opi3 are methyltransferases to synthesize phosphatidylcholine (PC) from phosphatidylethanolamine (PE). PMME, phosphatidylmonomethylethanolamine; PDME, phosphatidyldimethylethanolamine.
- Wild‐type, opi3Δ, cho2Δ, and opi3Δ cho2Δ cells expressing mito‐DHFR–mCherry were cultured and analyzed as in (A) and (B), respectively. Pgk1 was monitored as a loading control.
- The amounts of free mCherry detected in (H) were quantified as in (C). The signal intensity value of free mCherry in wild‐type cells at 72 h was set to 100%. Data represent the averages of three experiments, with error bars indicating standard deviations.
Figure EV1. Loss of Opi3 leads to minor defects in bulk autophagy, pexophagy, and the Cvt pathway.
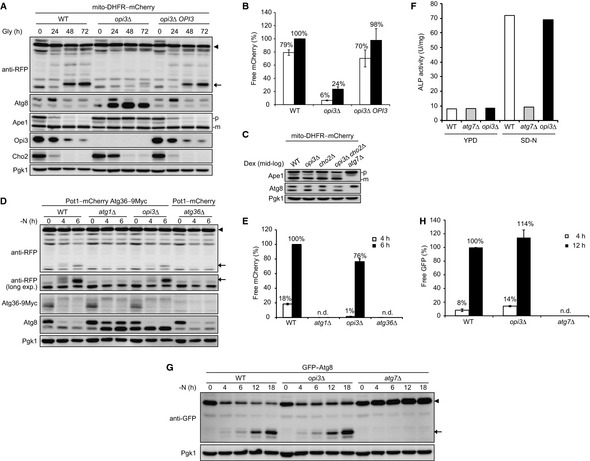
- Reintroduction of an OPI3 gene into the opi3‐null mutant rescues mitophagy. Wild‐type, opi3Δ, and opi3Δ cells with a chromosomally reintroduced OPI3 gene expressing mito‐DHFR–mCherry (depicted by arrowhead) were grown in glycerol medium (Gly). Cells were harvested at the indicated time points and subjected to Western blotting. Generation of free mCherry (depicted by arrow) indicated transport of mitochondria to the vacuole. The cytosolic protein Pgk1 was monitored as a loading control.
- The amounts of free mCherry detected in (A) were quantified at the indicated time points. The signal intensity value of free mCherry in wild‐type cells at the 72‐h time point was set to 100%. Data represent the averages of three experiments, with error bars indicating standard deviations.
- Deletion of the OPI3 gene does not affect the Cvt pathway under fermentable conditions. Wild‐type, opi3Δ, cho2Δ, opi3Δ cho2Δ, and atg7Δ cells expressing mito‐DHFR–mCherry were grown in dextrose medium (Dex) and harvested at mid‐log phase. The vacuolar aminopeptidase Ape1 is synthesized as a precursor (p) in the cytosol, transported to the vacuole via the Cvt pathway, and processed into a mature form (m) in the vacuolar lumen. Pgk1 was monitored as a loading control.
- Pexophagy is only slightly reduced in starving cells lacking Opi3. Wild‐type, atg1Δ, and opi3Δ cells expressing Pot1–mCherry (a peroxisome marker depicted by arrowhead) and Atg36–9Myc (a protein essential for pexophagy), and atg36Δ cells expressing Pot1–mCherry were grown in oleic acid medium, transferred to dextrose medium lacking nitrogen (−N), and harvested at the indicated time points. Generation of free mCherry (depicted by arrow) indicated transport of peroxisomes to the vacuole. Pgk1 was monitored as a loading control.
- The amounts of free mCherry detected in (D) were quantified at the indicated time points. The signal intensity value of free mCherry in wild‐type cells at the 6‐h time point was set to 100%. Data represent the averages of three experiments, with error bars indicating standard deviations.
- Opi3 is dispensable for autophagy. Wild‐type, atg7Δ, and opi3Δ cells expressing Pho8Δ60 (a cytosolic alkaline phosphatase for monitoring autophagy activity) pre‐grown in nutrient‐rich dextrose medium (YPD) were incubated in synthetic dextrose medium lacking nitrogen (SD‐N) for 6 h and subjected to alkaline phosphatase (ALP) assays. Pho8Δ60 is transported to the vacuole via autophagy and processed into an active form in the vacuolar lumen.
- Starvation‐induced autophagy flux is normal in the absence of Opi3. Wild‐type, opi3Δ, and atg7Δ cells expressing GFP–Atg8 (depicted by arrowhead) were grown to mid‐log phase in rich dextrose medium, incubated for the indicated time points in starvation medium (−N), and subjected to Western blotting. Generation of free GFP (depicted by arrow) indicates transport of autophagosomes to the vacuole. Atg7 is an E1 enzyme essential for autophagy. Pgk1 was monitored as a loading control.
- The amounts of free GFP detected in (G) were quantified at the 4‐ and 12‐h time points. The signal intensity value of free GFP in wild‐type cells at the 12‐h time point was set to 100%. Data represent the averages of three experiments, with error bars indicating standard deviations.
It remains conceivable that sequestration of mitochondria occurs normally, whereas fusion of mitophagosomes to vacuoles is impaired in the opi3‐null mutant. To test this possibility, we used a strain lacking Ypt7, a Rab family GTPase required for homotypic vacuole fusion. Deletion of the YPT7 gene blocks membrane vesicle fusion with the vacuole, resulting in accumulation of autophagosome‐related structures in the cytosol. Under mitophagy‐inducing conditions, cells lacking Ypt7 accumulate mitochondria‐containing autophagic vesicles termed mitophagosomes. As described previously (Okamoto et al, 2009), when these cells were shifted to medium containing fermentable carbon source, mitochondrial fragments were fused to become tubules that could be morphologically distinguished from mitophagosomes (Fig 1F). Under the same conditions, mitochondrial vesicles were hardly seen in cells lacking Opi3 or Atg7 (Fig 1F). These observations suggest that mitophagosome formation is impaired in the absence of Opi3.
Next, we investigated the cytoplasm‐to‐vacuole targeting (Cvt) pathway, peroxisome‐specific autophagy (pexophagy), and non‐selective autophagy in the opi3‐null mutant. The Cvt pathway is a constitutively active, autophagy‐related process selective for several vacuolar proteins such as Ape1, a vacuolar aminopeptidase. Ape1 is synthesized as a precursor in the cytosol and processed into a mature form in the vacuole. When vegetatively grown in medium containing fermentable carbon source, the opi3‐null mutant exhibited wild‐type‐like Ape1 processing (Fig EV1C). For pexophagy, peroxisomal matrix‐localized Pot1–mCherry was monitored in cells shifted from oleic acid medium to nitrogen starvation medium. Upon pexophagy, peroxisomes are degraded, and Pot1–mCherry is processed to become a free mCherry in the vacuole. We found a partial defect in peroxisomal degradation, which was much weaker than that in mitophagy, in cells lacking Opi3 (Fig EV1D and E). Finally, autophagic activity during nitrogen starvation was assessed with a well‐established alkaline phosphatase assay. Even in the absence of Opi3, cytoplasmic constituents were non‐selectively transported to the vacuole with near wild‐type efficiency (Fig EV1F). We also monitored vacuolar protease‐dependent processing of GFP–Atg8 and found wild‐type‐like autophagy flux in the opi3‐null mutant under starved conditions (Fig EV1G and H). Collectively, these results support the idea that loss of Opi3 leads to dominant defects in degradation of mitochondria.
Given the fact that Opi3 plays a critical role in PE‐to‐PC conversion (Henry et al, 2012), we initially hypothesized that altered phospholipid composition such as a decrease in PC content is the primary cause of mitophagy deficiencies in the opi3‐null mutant. To test this idea, we monitored degradation of mitochondria in cells lacking Cho2, another ER‐localized phospholipid methyltransferase acting upstream of Opi3, that are also defective in PE‐to‐PC conversion (Fig 1G) (Henry et al, 2012). Unexpectedly, mitochondria were substantially degraded in the cho2‐ and opi3 cho2‐null mutants (95 and 74%, respectively, compared to wild‐type cells) (Fig 1H and I). Thus, it seems unlikely that mitophagy depends on PC homeostasis.
PMME and GSH are elevated in cells lacking Opi3 under mitophagy‐inducing conditions
To elucidate how single loss of Opi3 leads to severe defects in mitochondrial degradation, we first examined the expression profiles of Cho2 and Opi3. To our surprise, when shifted to medium containing non‐fermentable carbon source, wild‐type cells exhibited a marked reduction in the Cho2 protein levels (Fig 2A). Notably, this downregulation was delayed in opi3‐null cells (Fig 2A). These results suggest that, in the absence of Opi3, Cho2 functions negatively affect mitophagy.
Figure 2. PMME and GSH increase in opi3‐null cells under mitophagy‐inducing conditions.
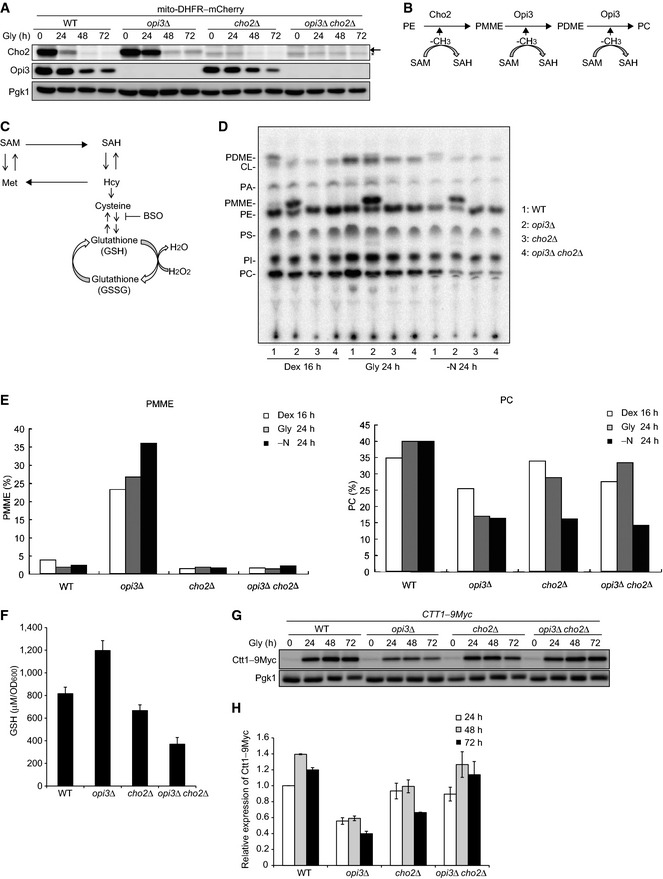
- Wild‐type, opi3Δ, cho2Δ, and opi3Δ cho2Δ cells expressing mito‐DHFR–mCherry were cultured and analyzed as in Fig 1B. Cho2‐specific and Cho2‐non‐specific bands are depicted by arrow and asterisk, respectively. Pgk1 was monitored as a loading control.
- A schematic diagram of PC biosynthesis from PE in budding yeast. PE, phosphatidylethanolamine; PMME, phosphatidylmonomethylethanolamine; PDME, phosphatidyldimethylethanolamine; PC, phosphatidylcholine; SAM, S‐adenosyl methionine; SAH, S‐adenosyl homocysteine (see text for details).
- A schematic diagram of the transmethylation cycle and transsulfuration–GSH pathway. Hcy, homocysteine; BSO, buthionine sulfoximine (see text for details).
- One‐dimensional thin‐layer chromatography (1‐D TLC) for wild‐type, opi3Δ, cho2Δ, and opi3Δ cho2Δ cells. Cells were grown in synthetic media containing dextrose (Dex) or glycerol (Gly), or subjected to nitrogen starvation (−N) in the presence of 32Pi, and collected at the indicated time points. Total cellular phospholipids were then extracted in the organic phase and separated by 1‐D TLC. CL, cardiolipin; PA, phosphatidic acid; PC, phosphatidylcholine; PDME, phosphatidyldimethyl‐ethanolamine; PE, phosphatidylethanolamine; PI, phosphatidylinositol; PMME, phosphatidylmonomethylethanolamine; PS, phosphatidylserine.
- The radioactive spots of PMME and PC in (D) were quantified using densitometry. The signal intensity value of total phospholipids in each sample was set to 100%.
- Wild‐type, opi3Δ, cho2Δ, and opi3Δ cho2Δ cells were grown in synthetic glycerol medium for 24 h, collected, and subjected to quantification of total cellular reduced glutathione (GSH). Data represent the averages of three experiments, with error bars indicating standard deviations.
- Wild‐type, opi3Δ, cho2Δ, and opi3Δ cho2Δ cells expressing a chromosomally Myc‐tagged Ctt1, a cytosolic catalase, were cultured and analyzed as in (A). Pgk1 was monitored as a loading control.
- The Ctt1–Myc protein levels analyzed in (F) were quantified at the indicated time points. The signal intensity values in wild‐type cells at 24 h were set to 1.0. Data represent the averages of three experiments, with error bars indicating standard deviations.
As Cho2 generates phosphatidylmonomethylethanolamine (PMME), one of the substrates for Opi3, it seems plausible that this mono‐methylated phospholipid accumulates in the cell if Opi3 functions are compromised (Fig 2B). We also noticed previous studies suggesting an increased level of PMME in an opi3 mutant (Greenberg et al, 1982, 1983). To confirm a high PMME content in our opi3‐null strain, we analyzed total cellular phospholipid composition by one‐dimensional thin‐layer chromatography (1‐D TLC), a method that allows separation of phospholipids with high resolution and reproducibility (Vaden et al, 2005). Cells under fermentable, non‐fermentable (mitophagy‐inducing), and nitrogen starvation conditions were labeled with 32Pi and subjected to phospholipid extraction. Our assays revealed strongly increased levels of PMME in opi3‐null cells under all the aforementioned conditions, which was not the case in wild‐type, cho2‐null, and opi3 cho2‐null cells (Fig 2D and E). As expected, the PC contents were significantly reduced in opi3‐, cho2‐, and opi3 cho2‐null cells (Fig 2D and E), but still partially maintained via the Kennedy pathway, an alternative process for PC biosynthesis using choline and phosphoethanolamine (Henry et al, 2012).
Cho2 and Opi3 catalyze transfer of a methyl group from S‐adenosyl methionine (SAM) to PE, PMME, and PDME (Tehlivets, 2011; Henry et al, 2012) (Fig 2B). Concomitantly, each reaction converts SAM to S‐adenosyl homocysteine (SAH), a precursor for homocysteine (Hcy) biosynthesis (Tehlivets et al, 2013) (Fig 2B and C). Hcy can then be utilized to generate methionine (Met) and SAM in the methylation cycle or subjected to produce cysteine (Cys) and GSH, a principal antioxidant, in the transsulfuration–GSH pathway (Tehlivets et al, 2013) (Fig 2C). Hence, we hypothesized that loss of Opi3 results in dysregulation of Cho2‐mediated SAH production, ultimately facilitating GSH biosynthesis (Fig 2B and C). The cellular GSH content was indeed elevated in opi3‐null cells under mitophagy‐inducing conditions (1.5‐ to 3‐fold increase compared with wild‐type, cho2‐null, and opi3 cho2‐null cells) (Fig 2F). In addition, we investigated the protein levels of chromosomally Myc‐tagged Ctt1, a cytosolic catalase (Morano et al, 2012), and found that this oxidative stress marker is partially but significantly suppressed in opi3‐null cells (1.5‐ to 2‐fold decrease compared with wild‐type, cho2‐null, and opi3 cho2‐null cells) (Fig 2G and H).
Taken together, these data raise the possibility that PMME and/or GSH accumulated in cells lacking Opi3 may be deleterious for mitophagy.
Loss of Opi3 leads to suppression of Atg32 induction
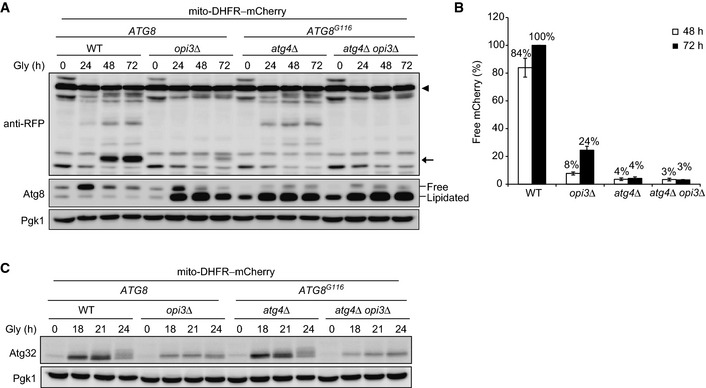
Previous studies have shown that GSH can affect the Atg32 protein levels and abrogate mitochondrial degradation (Deffieu et al, 2009; Okamoto et al, 2009). Thus, we monitored the expression profiles of chromosomally HA‐tagged Atg32 in vacuolar protease‐deficient cells under respiratory conditions. In this variant, vacuole‐dependent degradation of Atg32 is mostly blocked, thereby allowing us to examine the protein levels irrespective of mitophagy activity. As described previously (Okamoto et al, 2009), Atg32–HA was transiently upregulated in wild‐type cells (Fig 3A). By contrast, opi3‐null cells displayed a remarkable reduction in the Atg32 protein levels, which was hardly seen in cho2‐ and opi3 cho2‐null cells (Fig 3A). Notably, Atg32–HA induction was partially restored in opi3‐null cells treated with buthionine sulfoximine (BSO), an inhibitor of the glutamate cysteine ligase Gsh1 in the transsulfuration–GSH pathway (1.5‐fold increase compared with untreated opi3‐null cells) (Figs 2C and 3B and C) (Biterova & Barycki, 2010; Tehlivets et al, 2013). A reduction in the Atg32 content and its partial recovery by BSO treatment were also detected at the transcriptional level in cells lacking Opi3 (Fig 3D). Collectively, these results are consistent with the notion that Cho2 continues, at least for a certain period, to increase the GSH levels through the transsulfuration pathway, thereby suppressing Atg32 induction in opi3‐null cells under mitophagy‐inducing conditions.
Figure 3. Atg32 is not induced in cells lacking Opi3.
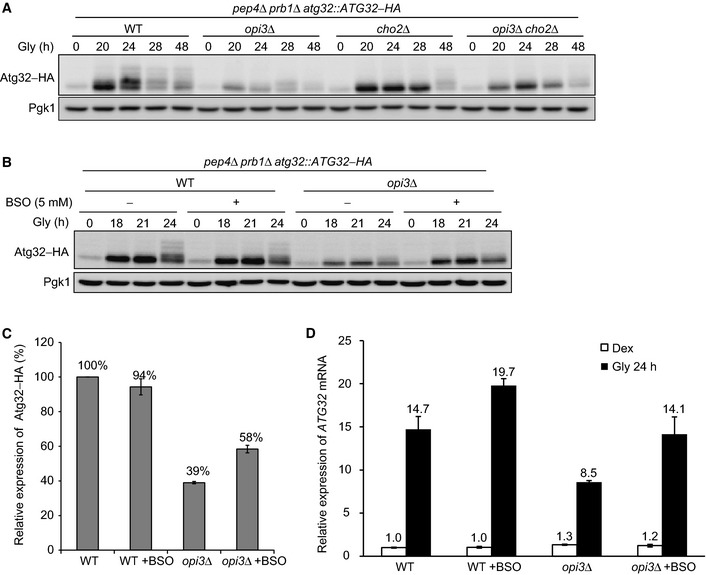
- Wild‐type, opi3Δ, cho2Δ, and opi3Δ cho2Δ cells expressing a chromosomally integrated Atg32–HA were generated from a vacuolar protease‐deficient strain (pep4Δ prb1Δ), cultured, and analyzed as in Fig 1B. Pgk1 was monitored as a loading control.
- Wild‐type and opi3Δ cells expressing a chromosomally integrated Atg32–HA were generated from a vacuolar protease‐deficient strain (pep4Δ prb1Δ), cultured in the presence or absence of BSO, an inhibitor of GSH synthesis from cysteine, and analyzed as in (A). Pgk1 was monitored as a loading control.
- The Atg32–HA protein levels analyzed in (B) were quantified. The signal intensity values in wild‐type cells at the 21‐h time point were set to 100%. Data represent the averages of three experiments, with error bars indicating standard deviations.
- Wild‐type and opi3Δ cells pre‐grown in dextrose medium (Dex) were incubated in glycerol medium (Gly) for 24 h in the presence or absence of BSO, harvested, and subjected to total RNA isolation. The ATG32 mRNA levels were quantified by real‐time PCR with ACT1 mRNA as a normalization control. The signal intensity value of ATG32 mRNA in Dex‐growing wild‐type cells was set to 1.0. Data represent the averages of three experiments, with error bars indicating standard deviations.
To test whether defects in Atg32 induction primarily inhibit degradation of mitochondria, we attempted to increase the Atg32 protein levels with two low‐copy plasmids encoding Atg32–HA. Overexpressed Atg32 could target to mitochondria and interact with Atg8 and Atg11 in the absence of Opi3 (Fig EV2A and B). However, we found that mitochondrial degradation in opi3‐null cells overexpressing Atg32–HA was only slightly elevated compared to cells with empty vectors (Fig EV2C and D). Thus, it seems likely that loss of Opi3 leads to severe mitophagy defects through other mechanisms.
Figure EV2. Overexpression of Atg32 only slightly restores mitophagy in opi3‐null cells.
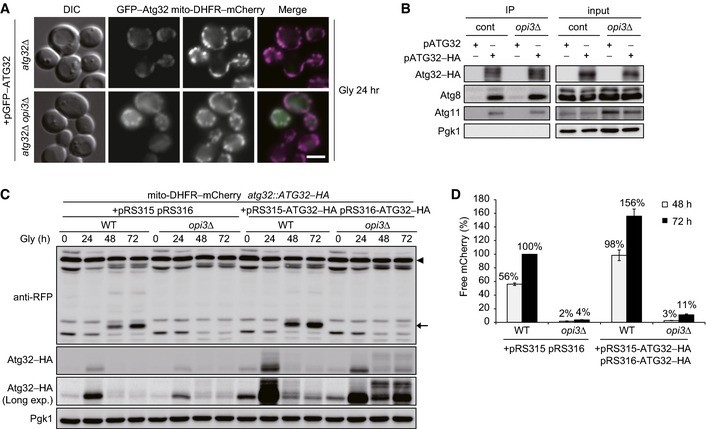
- Atg32 properly targets to mitochondria in the absence of Opi3. atg32Δ and atg32Δ opi3Δ cells expressing mito‐DHFR–mCherry and a plasmid‐encoded GFP–Atg32 were grown in glycerol medium (Gly) for 24 h and observed using fluorescence microscopy. Scale bar, 2 μm.
- Deletion of the OPI3 gene does not affect interactions of Atg32 with Atg8 and Atg11. Wild‐type and opi3Δ cells expressing plasmid‐encoded versions of Atg32 or Atg32–HA were grown in glycerol medium and subjected to coimmunoprecipitation using anti‐HA antibody‐conjugated agarose. Eluted immunoprecipitates (IP) and detergent‐solubilized mitochondrial fractions (input) were analyzed by Western blotting.
- Atg32 overexpression only slightly restores mitophagy in the opi3‐null mutant. Wild‐type and opi3Δ cells expressing mito‐DHFR–mCherry (depicted by arrowhead) and a chromosomally encoded Atg32–HA were transformed with two Atg32–HA‐expressing plasmids or empty vectors, cultured in glycerol medium (Gly), and analyzed as in Fig 1B. Generation of free mCherry (depicted by arrow) indicates transport of mitochondria to the vacuole. Pgk1 was monitored as a loading control.
- The amounts of free mCherry detected in (A) were quantified at the indicated time points as in Fig 1C. The signal intensity value of free mCherry in wild‐type cells containing two empty vectors at the 72‐h time point was set to 100%. Data represent the averages of three experiments, with error bars indicating standard deviations.
Lipidated Atg8 anomalously increases in opi3‐null cells
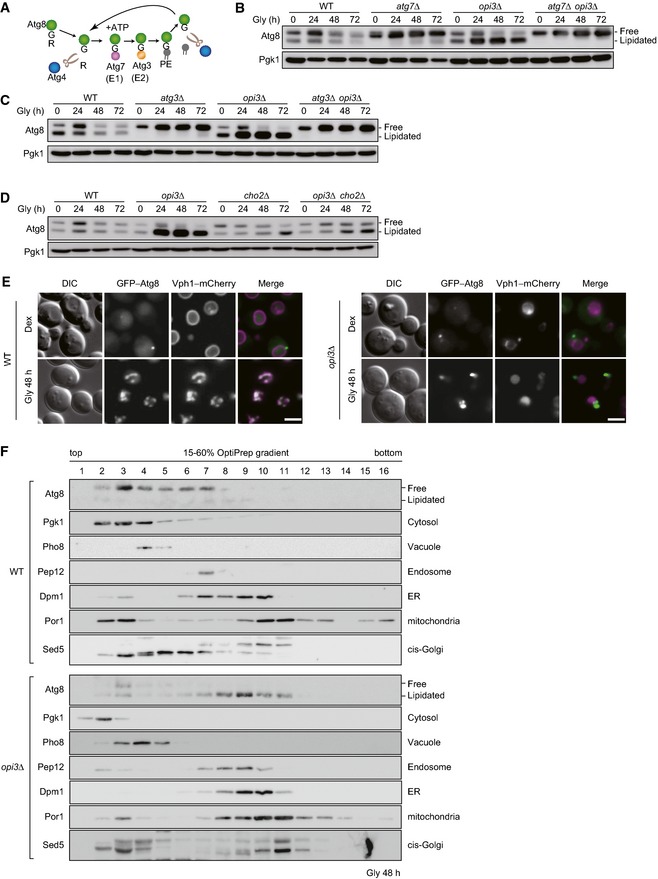
Given the fact that PMME is a mono‐methylated derivative of PE, we postulated that PMME accumulation might affect the function of Atg8, a PE‐conjugated ubiquitin‐like modifier crucial for both autophagosome formation and cargo recognition in autophagy‐related processes including mitophagy. Accordingly, we analyzed the expression profiles of Atg8 using urea–SDS–PAGE to separate the free and lipidated forms (Nakatogawa & Ohsumi, 2012). When grown under mitophagy‐inducing conditions, wild‐type cells contained both free and PE‐conjugated Atg8 (Fig 4B). In urea‐containing gel, the free form migrates slower than the lipidated form that is absent in cells lacking Atg7, an E1 enzyme essential for activating Atg8–PE generation (Fig 4A and B) (Nakatogawa, 2013). Under the same conditions, a drastically increased Atg8 band was detected in the opi3‐null mutant (Fig 4B). This form of Atg8 was likely to be a lipidated molecule, since it migrated in parallel to the PE‐conjugated form in wild‐type cells, but almost completely disappeared in the atg7 opi3‐null mutant (Fig 4B). Similar results were obtained from cells lacking Atg3, an E2 enzyme required for conjugation of Atg8 to PE (Fig 4A and C) (Nakatogawa, 2013). Although accumulation of lipidated Atg8 could result from alterations in Atg4, a cysteine protease responsible for cleavage of the Atg8 C‐terminal arginine and conjugated phospholipid (Fig 4A) (Nakatogawa, 2013), Atg4 was normally expressed in opi3‐null cells (Fig EV3A). We also confirmed that wild‐type‐like Atg8 profiles were recovered by reintroduction of the OPI3 gene into the null mutant (Fig EV1A).
Figure 4. Loss of Opi3 causes drastic lipidation of Atg8.
-
AA schematic diagram of post‐translational modification for Atg8. The C‐terminal arginine of Atg8 is first removed by the cysteine protease Atg4. The resulting Atg8 variant, which exposes its glycine at the C‐terminus, is an active form for subsequent conjugation steps involving the E1 enzyme Atg7 and the E2 enzyme Atg3. These reactions lead to formation of a covalent bond between the C‐terminal glycine of Atg8 and the amino group of phosphatidylethanolamine (PE). Atg4 also mediates cleavage of the Atg8–PE bond and allows Atg8 to be recyclable for the next round of conjugation.
-
B–DCells grown in glycerol medium (Gly) were harvested at the indicated time points and analyzed by Western blotting. Strains examined were (B) wild‐type, atg7Δ, opi3Δ, and atg7Δ opi3Δ; (C) wild‐type, atg3Δ, opi3Δ, and atg3Δ opi3Δ; and (D) wild‐type, opi3Δ, cho2Δ, and opi3Δ cho2Δ cells. Pgk1 was monitored as a loading control.
-
EWild‐type and opi3Δ cells expressing chromosomally encoded Vph1–mCherry (a vacuolar marker) and GFP–Atg8 were pre‐grown in dextrose medium (Dex), incubated in glycerol medium (Gly) for 48 h, and observed using fluorescence microscopy. Scale bar, 2 μm.
-
FWild‐type and opi3Δ cells grown in glycerol medium (Gly) for 48 h were subjected to density gradient analysis. The sample were divided into 16 fractions from the top of the gradients and analyzed by immunoblotting with antibodies against Atg8, Pgk1, Pho8, Pep12, Dpm1, Por1, and Sed5.
Figure EV3. Deletion of the OPI3 gene alters autophagy flux, Cho2 repression, and Atg32 induction.
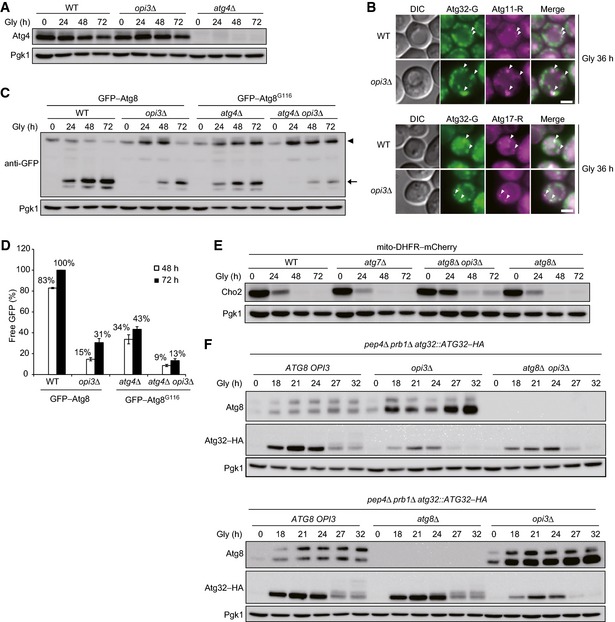
- Atg4 expression is not altered in the absence of Opi3. Wild‐type, opi3Δ, and atg4Δ cells expressing mito‐DHFR–mCherry were grown in glycerol medium (Gly), harvested at the indicated time points, and subjected to Western blotting. Pgk1 was monitored as a loading control.
- Atg32 properly localizes to the pre‐autophagosomal structure (PAS) in opi3‐null cells. Wild‐type and opi3Δ cells expressing Atg32–GFP (Atg32–G) and Atg11–2xmCherry (Atg11–R) or Atg17–2xmCherry (Atg17–R) were grown in glycerol medium (Gly) for 36 h and observed under a fluorescence microscope. Atg11–2xmCherry and Atg17–2xmCherry were used as PAS markers. Arrowheads indicate Atg32–GFP colocalized with Atg11–2xmCherry or Atg17–2xmCherry. Scale bar, 3 μm.
- Deletion of the OPI3 gene leads to a strong reduction in autophagy flux. Wild‐type or opi3Δ cells expressing GFP–Atg8 (depicted by arrowhead), and atg4Δ or atg4Δ opi3Δ cells expressing GFP–Atg8G116 (depicted by arrowhead) were generated from a strain for mitophagy assays, grown in glycerol medium (Gly), and harvested at the indicated time points. Generation of free GFP (depicted by arrow) indicated transport of autophagosome‐related vesicles to the vacuole. Pgk1 was monitored as a loading control.
- The amounts of free GFP detected in (C) were quantified at the indicated time points. The signal intensity value of free mCherry in wild‐type cells at the 72‐h time point was set to 100%. Data represent the averages of three experiments, with error bars indicating standard deviations.
- Cho2 repression is retarded in opi3‐null cells even without Atg8 lipidation. Wild‐type, atg7Δ, atg8Δ opi3Δ, and atg8Δ cells expressing mito‐DHFR–mCherry were grown in glycerol medium (Gly) and harvested at the indicated time points. Pgk1 was monitored as a loading control.
- Loss of Opi3 suppresses Atg32 induction independently of Atg8 lipidation. Wild‐type, opi3Δ, and atg8Δ opi3Δ cells expressing chromosomally encoded Atg32–HA were generated from a vacuolar protease‐deficient strain (pep4Δ prb1Δ), grown in glycerol medium (Gly), harvested at the indicated time points, and subjected to Western blotting. Pgk1 was monitored as a loading control.
Importantly, the cho2‐ and opi3 cho2‐null mutants did not display a drastic increase in Atg8 lipidation (Fig 4D). Based on the previous reports demonstrating that PMME does not accumulate in cells containing mutations on the CHO2 locus or both OPI3 and CHO2 loci (Kodaki & Yamashita, 1987; Summers et al, 1988), it seems conceivable that Atg8 may be conjugated to PMME and aberrantly accumulated in the opi3‐null mutant. Indeed, PMME contains a secondary amine head group that can theoretically be available for Atg8 coupling.
Interestingly, we found irregular localization patterns of Atg8 in cells lacking Opi3. During fermentable growth (Dex, mitophagy‐non‐inducing conditions), GFP–Atg8 expressed in wild‐type and opi3‐null cells was dispersed in the cytosol and localized as a discrete dot adjacent to the vacuolar Vph1–mCherry (Fig 4E). This dot is likely to be the pre‐autophagosomal structure (PAS), a protein assembly site for autophagosome formation (Suzuki et al, 2001). When grown in mitophagy‐inducing medium (Gly), wild‐type cells displayed colocalization of GFP–Atg8 with Vph1–mCherry, indicating active autophagy flux (Fig 4E). Under the same conditions, GFP–Atg8 seemed to form aggregates juxtaposed but not overlapping with Vph1–mCherry in cells lacking Opi3 (Fig 4E). The PAS involved in mitophagy appears unaffected, as Atg32–GFP colocalized with the PAS markers Atg11–mCherry and Atg17–mCherry even in the absence of Opi3 (Fig EV3B). In addition, we monitored vacuolar protease‐dependent processing of GFP–Atg8 and confirmed strongly impaired autophagy flux in the opi3‐null mutant under mitophagy‐inducing conditions (31% compared with wild‐type cells) (Fig EV3C and D). Moreover, our subcellular fractionation assays revealed that Atg8 coexisted with the cytosol/vacuole and late endosome in wild‐type and opi3‐null cells, respectively (Fig 4F), suggesting that Atg8‐phospholipid conjugates (likely Atg8–PMME) aberrantly associate with the late endosome‐like structure.
Finally, we investigated if accumulation of lipidated Atg8 affects Cho2 repression and Atg32 induction in cells lacking Opi3. Downregulation of Cho2 was delayed in atg8 opi3‐null cells, indicating that retardation of Cho2 repression was not due to Atg8 (Fig EV3E). We also found that the Atg32 protein levels were significantly reduced in atg8 opi3‐null cells, indicating that Atg32 repression does not depend on Atg8 (Fig EV3F).
Collectively, these data raise the possibility that cells lacking Opi3 produce abnormally lipidated, mitophagy‐incompetent Atg8.
Atg8–PMME can be generated but inefficiently deconjugated
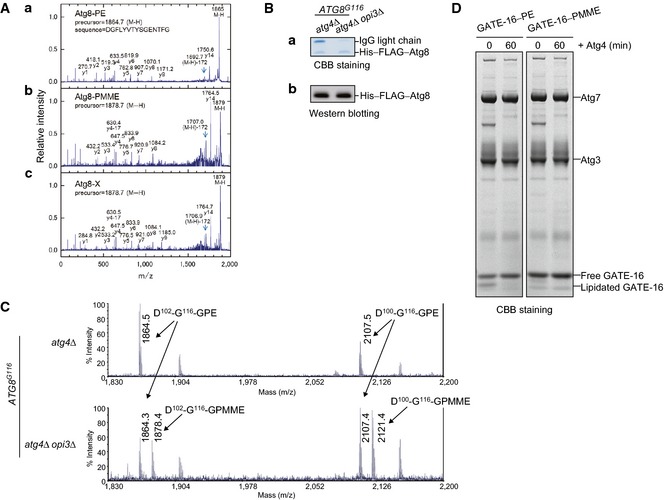
Our findings that mitophagy‐deficient opi3‐null cells contain high levels of PMME and lipidated Atg8 led us to test whether Atg8 can be coupled to PMME through the autophagic conjugation systems. Lipidation of Atg8 has been reconstituted in vitro with recombinant proteins Atg8G116 (activated variant lacking the C‐terminal arginine), Atg7, Atg3, and Atg12–Atg5 (an E3‐like protein conjugate essential for autophagy) in the presence of ATP and liposomes containing PE (Ichimura et al, 2004; Hanada et al, 2007) (Fig 5A). In addition, purified Atg4, a cysteine protease responsible for cleavage of the Atg8 C‐terminal arginine, can deconjugate Atg8G116–PE (Kirisako et al, 2000; Nakatogawa et al, 2007) (Fig 5A). We performed in vitro reconstitution assays and detected formation of Atg8G116–PMME as efficient as that of Atg8G116–PE (Fig 5B, lanes 2 and 8). However, to our surprise, Atg4 could almost completely deconjugate Atg8G116–PE within 1 min, while Atg8G116–PMME was not fully deconjugated even after 10‐min incubation with Atg4 (Fig 5B, lanes 3 and 11). We conclude that conjugation of Atg8G116 to PMME is efficient, but the reverse reaction is not in vitro.
Figure 5. Atg8 is conjugated to PMME but cannot be efficiently delipidated.
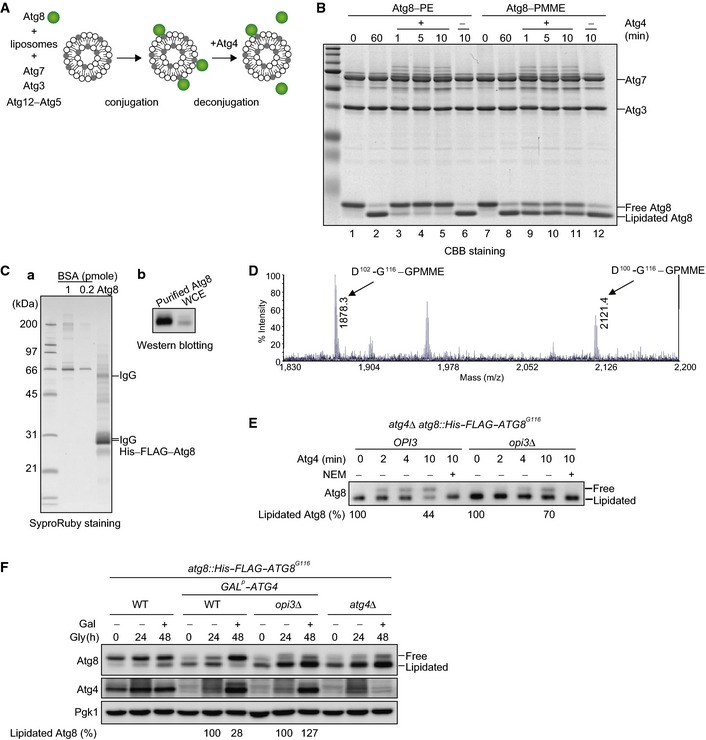
- A schematic diagram of Atg8 conjugation and deconjugation reactions in vitro. Atg8G116, an activated variant lacking the C‐terminal arginine, was incubated with liposomes containing PE or PMME in the presence of Atg7 (E1), Atg3 (E2), Atg12–Atg5 (E3‐like conjugate), and ATP. The Atg4 cysteine protease was then added to the reactions for Atg8 delipidation.
- Atg8 lipidation reaction was performed for 60 min as in (A). The reactions were further incubated with Atg4 or mock‐treated for the indicated time periods. Samples were then analyzed by urea–SDS–PAGE and Coomassie Brilliant Blue (CBB) staining.
- Membrane‐enriched fractions were isolated from opi3Δ cells expressing His–FLAG–Atg8, solubilized, and subjected to tandem affinity chromatography. Proteins were then eluted with SDS‐sample buffer and analyzed by SDS–PAGE and SyproRuby staining (a), or urea–SDS–PAGE and Western blotting (b). Bovine serum albumin (BSA) was used as a standard.
- Negative‐ion MALDI‐MS spectrum of the C‐terminal peptide of His–FLAG–Atg8 expressed in cells lacking Opi3. His–FLAG–Atg8 was purified as in (C), and the C‐terminal fragments were generated by saponification and protease treatment. The GPMME‐modified peptide, observed at m/z 1878.3, was further subjected to MS/MS (see Fig EV4A).
- In vitro Atg4 processing assays. Membrane‐enriched fractions were isolated from atg4Δ or atg4Δ opi3Δ cells expressing His–FLAG–Atg8G116 and treated with Atg4 for the indicated time periods in the presence or absence of N‐ethylmaleimide (NEM), a cysteine protease inhibitor. Samples were then purified and analyzed as in (C).
- Wild‐type or atg4Δ cells expressing His‐FLAG‐ATG8G116, and wild‐type or opi3Δ cells expressing His‐FLAG‐ATG8G116 with the ATG4 gene under the GAL promoter were grown in glycerol medium (Gly) for 24 h, supplemented with galactose (Gal), and subjected to Western blotting. The amounts of lipidated Atg8 detected in wild‐type or opi3Δ cells containing the GAL‐driven ATG4 gene were quantified at the 24‐ and 48‐h time points. The signal intensity values of lipidated Atg8 in wild‐type and opi3Δ cells at the 24 h time point were set to 100%. Pgk1 was monitored as a loading control.
To ask whether Atg8–PMME can be formed in vivo, His–FLAG‐tagged Atg8 was expressed in opi3‐null cells under mitophagy‐inducing conditions and purified using tandem affinity purification (Fig 5C). According to the previously reported procedures (Ichimura et al, 2000), we obtained the hydrophilic head of phospholipid covalently linked to His–FLAG–Atg8 by mild alkaline treatment, a process that removes fatty acid from glycerophospholipids, and subsequent digestion with lysyl endopeptidase. For mass spectrometry, in vitro‐generated Atg8–PE and Atg8–PMME were also examined as controls. We detected two peptide fragments containing the C‐terminal glycine residue that correspond to Atg8 (102–116) and (100–116) with a moiety of glycerophosphomonomethylethanolamine (D102‐G116–GPMME and D100‐G116–GPMME, respectively, in Fig 5D). Consistent with these data, tandem mass spectra indicated peptide fragments from Atg8–PMME and His–FLAG–Atg8 in the opi3‐null mutant that were heavier by Mr 14 than the corresponding fragments from Atg8–PE (y1‐9 ions in Fig EV4A). The value Mr 14 is identical to the mass deference between GPMME and glycerophosphoethanolamine (GPE). In conclusion, we establish PMME as an atypical target for Atg8 lipidation in living cells.
Figure EV4. Yeast and human Atg8 family proteins are conjugated to PMME in vitro .
- Atg8 is conjugated to PMME in cells lacking Opi3. Membrane‐enriched fractions were isolated from opi3Δ cells expressing His–FLAG–Atg8, solubilized, and subjected to tandem affinity chromatography as in Fig 5C and D. Negative‐ion MALDI‐MS/MS spectra of the C‐terminal peptide of His–FLAG–Atg8 from opi3Δ cells (c) was compared with those of in vitro‐generated Atg8–PE (a) and Atg8–PMME (b).
- Proteins were purified from atg4Δ or atg4Δ opi3Δ cells expressing His–FLAG–Atg8G116 as in Fig 5C and analyzed by SDS–PAGE and CBB staining (a) or Western blotting (b).
- Atg8G116 is conjugated to PE and PMME in atg4 opi3‐null cells. Negative‐ion MALDI‐MS spectra of the C‐terminal peptides of His–FLAG–Atg8G116 purified as in (B). The C‐terminal fragments were generated by saponification and protease treatment.
- GATE‐16 is conjugated to PMME but cannot be efficiently delipidated in vitro. Lipidation reaction of the human Atg8 homolog GATE‐16 was performed for 2 h as in Fig 5A and B. The reactions were further incubated with Atg4 for the indicated time periods. Samples were then analyzed by Bis‐Tris NuPAGE and Coomassie Brilliant Blue (CBB) staining.
Based on the results that in vitro‐generated Atg8–PMME is not efficiently deconjugated by Atg4, we sought to test if that is also the case for lipidated Atg8 from cells lacking Opi3. Membrane fractions were isolated from atg4‐ or atg4 opi3‐null cells expressing His–FLAG–Atg8G116 and treated with recombinant Atg4. As described previously (Kirisako et al, 2000), the protein levels of lipidated His–FLAG–Atg8G116 from atg4‐null cells were reduced by 44% compared with untreated samples, whereas 70% of the lipidated protein from atg4 opi3‐null cells remained unprocessed (Fig 5E). We performed affinity purification and mass spectrometry, and verified the presence of Atg8G116–PE and Atg8G116–PMME in atg4‐ and atg4 opi3‐null mutants, respectively (Fig EV4B and C).
To further prove that Atg4 does not efficiently catalyze delipidation of PMME‐conjugated Atg8 in living cells, we put the ATG4 gene under the control of the GAL promoter in wild‐type and opi3‐null cells expressing His–FLAG–Atg8G116. In these cells, lipidated Atg8 can initially be accumulated in the presence of dextrose where ATG4 expression is mostly suppressed (at the Gly‐0 h time point). Cells are then shifted to a glycerol medium supplemented with galactose that strongly induces ATG4 expression (at the Gly‐24 h time point). We found that wild‐type and opi3‐null cells contained a similar amount of Atg4 at the Gly‐48 h time point. Although the protein levels of lipidated His–FLAG–Atg8G116 were reduced by 28% compared with those at the Gly‐24 h time point in wild‐type cells, the lipidated protein was even increased to 127% in opi3‐null cells (Fig 5F).
Taken together, these results support the idea that Atg8–PMME is a poor substrate for Atg4 in vivo.
Recycling of Atg8 is critical for mitophagy
During the course of this study, we noticed that aberrant accumulation of lipidated Atg8 in opi3‐null cells under mitophagy‐inducing conditions seemingly resembled delipidation defects in atg4‐null cells expressing Atg8G116 (Ichimura et al, 2000). In the latter case, starvation‐induced autophagy is substantially attenuated, suggesting that Atg8 recycling contributes to efficient autophagosome formation (Nair et al, 2012; Nakatogawa et al, 2012; Yu et al, 2012). Hence, we examined mitophagy in atg4‐null and atg4 opi3‐null cells expressing Atg8G116. Strikingly, both mutants exhibited much more severe defects (4 and 3%, respectively, compared with wild‐type cells) than opi3‐null cells (24% compared with wild‐type cells) (Fig 6A and B). Moreover, vacuolar protease‐dependent processing of GFP–Atg8G116 was significantly reduced in atg4‐null and atg4 opi3‐null cells under mitophagy‐inducing conditions (43 and 13%, respectively, compared with wild‐type cells), indicating defective autophagy flux (Fig EV3C and D). Together, our data suggest that mitophagy impairment in cells lacking Opi3 is primarily caused by Atg8‐recycling defects.
Figure 6. Mitophagy is strongly impaired in Atg8 deconjugation‐deficient cells.
- Wild‐type or opi3Δ cells expressing full‐length Atg8, and atg4Δ or atg4Δ opi3Δ cells expressing Atg8G116 were generated from a strain for mitophagy assays, cultured, and analyzed as in Fig 1B. Generation of free mCherry (depicted by arrow) from mito‐DHFR–mCherry (depicted by arrowhead) indicated transport of mitochondria to the vacuole. Pgk1 was monitored as a loading control.
- The amounts of free mCherry detected in (A) were quantified at the indicated time points as in Fig 1C. The signal intensity value of free mCherry in wild‐type cells at 72 h was set to 100%. Data represent the averages of three experiments, with error bars indicating standard deviations.
- Atg32 is normally induced in the Atg8 delipidation mutant. Wild‐type or opi3Δ cells expressing Atg8, and atg4Δ or atg4Δ opi3Δ cells expressing Atg8G116 were generated from a strain for mitophagy assays, grown in glycerol medium (Gly), harvested at the indicated time points, and subjected to Western blotting. Pgk1 was monitored as a loading control.
Atg32‐overexpressing opi3‐null cells treated with choline partially recover mitophagy
To verify whether two distinct defects in Atg32 induction and Atg8 recycling synergistically inhibit degradation of mitochondria, we attempted to increase the Atg32 protein levels with two low‐copy plasmids encoding Atg32–HA and decrease the Cho2 protein levels with choline in the opi3‐null mutant. It has been previously reported that choline supplementation can partially attenuate Cho2 activity (Gaynor et al, 1991). Strikingly, choline treatment resulted in significant restoration of mitophagy in opi3‐null cells overexpressing Atg32 (50% compared with wild‐type cells) (Fig 7A and B). We also confirmed partially abrogated Atg8 lipidation (probably PMME conjugation) in opi3‐null cells supplemented with choline (Fig EV5A and B). Moreover, under the same conditions, formation of GFP–Atg8 aggregates was markedly reduced (Figs 4E and EV5C). These data support the idea that mitophagy deficiencies in cells lacking Opi3 are attributed principally to strong Atg32 suppression and aberrant Atg8 lipidation.
Figure 7. Atg32 overexpression and choline treatment partially rescue mitophagy in opi3‐null cells.
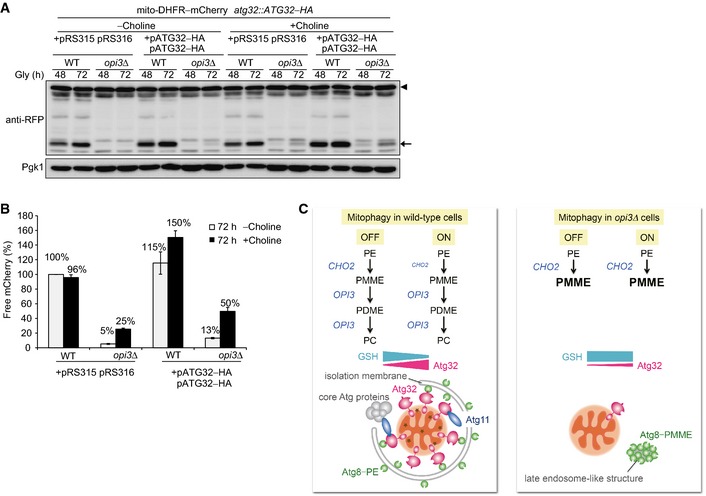
- Wild‐type and opi3Δ cells expressing mito‐DHFR–mCherry and a chromosomally encoded Atg32–HA were transformed with two Atg32–HA‐expressing plasmids or empty vectors, cultured in the presence or absence of choline, and analyzed as in Fig 1B. Generation of free mCherry (depicted by arrow) from mito‐DHFR–mCherry (depicted by arrowhead) indicated transport of mitochondria to the vacuole. Pgk1 was monitored as a loading control.
- The amounts of free mCherry detected in (A) were quantified at the 72‐h time point as in Fig 1C. The signal intensity value of free mCherry in wild‐type cells containing two empty vectors without choline treatment was set to 100%. Data represent the averages of three experiments, with error bars indicating standard deviations.
- A model for mitophagy regulation through the phospholipid methylation pathway in wild‐type and opi3‐null cells. PE, phosphatidylethanolamine; PC, phosphatidylcholine; PMME, phosphatidylmonomethylethanolamine; PDME, phosphatidyldimethylethanolamine; GSH, reduced glutathione (see text for details).
Figure EV5. Cho2 expression affects Atg8–PMME formation and mitophagy.
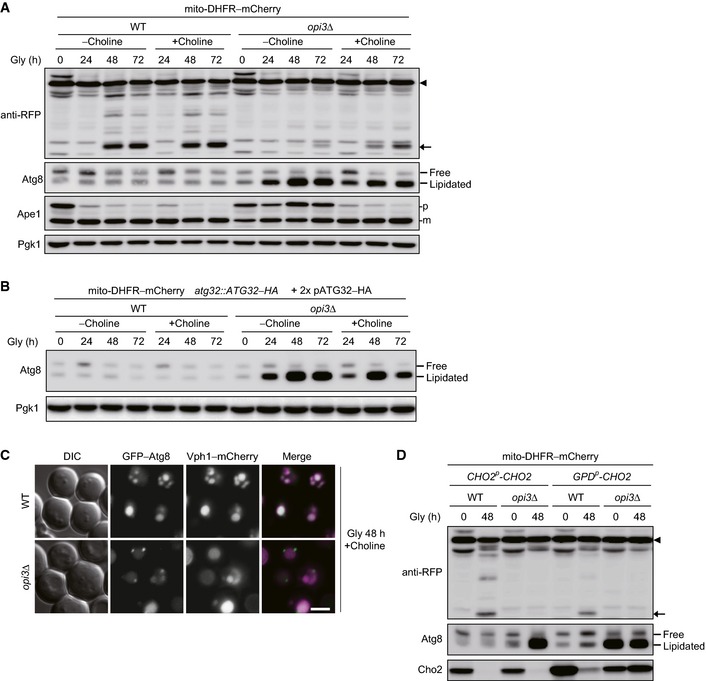
- Choline supplementation partially rescues mitophagy in cells lacking Opi3. Wild‐type and opi3Δ cells expressing mito‐DHFR–mCherry (depicted by arrowhead) cultured in the presence or absence of choline were harvested at the indicated time points and subjected to Western blotting. Generation of free mCherry (depicted by arrow) indicated transport of mitochondria to the vacuole. Pgk1 was monitored as a loading control.
- Atg8 lipidation is partially reduced by choline treatment in opi3‐null cells overexpressing Atg32. Wild‐type and opi3Δ cells expressing mito‐DHFR–mCherry and a chromosomally encoded Atg32–HA were transformed with two Atg32–HA‐expressing plasmids, cultured in the presence or absence of choline, and analyzed as in Fig 7A. Pgk1 was monitored as a loading control.
- Atg8 does not form aggregates in the opi3‐null mutant supplemented with choline. Wild‐type and opi3Δ cells expressing chromosomally encoded Vph1–mCherry (a vacuolar marker) and GFP–Atg8 were pre‐grown in dextrose medium, incubated in glycerol medium (Gly) for 48 h in the presence of choline, and observed using fluorescence microscopy. Scale bar, 2 μm.
- Overexpression of Cho2 leads to partial suppression of mitophagy in wild‐type cells. Wild‐type and opi3Δ cells expressing mito‐DHFR–mCherry (depicted by arrowhead) and Cho2 under the endogenous (CHO2 p ‐CHO2) or strong constitutive (GPD p ‐CHO2) promoter were grown in glycerol medium (Gly) for 48 h, harvested, and subjected to Western blotting. Generation of free mCherry (depicted by arrow) indicated transport of mitochondria to the vacuole.
Finally, we investigated the impact of Cho2 overexpression on mitophagy in wild‐type cells. Although the protein levels of Cho2 under the strong, constitutive GPD promoter were still significantly reduced during respiratory growth, mitophagy was partially suppressed, likely due to moderate accumulation of PMME‐conjugated Atg8 (Fig EV5D). Thus, it seems possible that Cho2‐mediated PE methylation can act as a physiological process to affect degradation of mitochondria.
Discussion
In this study, we demonstrate that the phospholipid methylation pathway is intimately linked to mitophagy in the budding yeast S. cerevisiae. This biosynthetic process involves Cho2 and Opi3, two methyltransferases that sequentially catalyze conversion of PE to PMME and PMME to PC, respectively, producing a major component of cellular membranes (Henry et al, 2012). Despite the fact that loss of either Cho2 or Opi3 causes defects in PC biosynthesis, mitophagy is severely impaired in the absence of Opi3, but neither Cho2 nor both enzymes. We revealed that Cho2 expression is anomalously prolonged in opi3‐null cells, promoting generation of PMME, a mono‐methylated PE derivative, and most likely facilitating a methyl group donation from SAM to PE and concomitant conversion of SAM to SAH. Notably, SAH can be utilized to generate the antioxidant GSH via the transsulfuration–GSH pathway (Tehlivets et al, 2013). The opi3‐null mutant indeed exhibits an increase in GSH levels and suppression of Atg32, an oxidative stress‐inducible protein required for mitophagy. To our surprise, we found that Atg8, a phospholipid‐linkable ubiquitin‐like protein essential for autophagosome formation, is atypically conjugated to PMME in cells lacking Opi3. Unlike the PE conjugate in wild‐type cells, Atg8–PMME is not efficiently deconjugated by the cysteine protease Atg4, and therefore accumulated as a non‐recyclable molecule in the late endosome‐like structure, which attenuates formation of autophagosomes surrounding mitochondria. Collectively, our findings reveal that the proper control of Cho2 and Opi3 activities is crucial for mitophagy.
We propose that phospholipid methylation plays a dual role in PC biosynthesis and mitochondrial degradation (Fig 7C). In wild‐type cells under respiratory (mitophagy‐inducing) conditions, Cho2 expression is rapidly downregulated, thereby abrogating SAH and Hcy production. It is likely that GSH biosynthesis via the transsulfuration–GSH pathway is not strongly activated, while mitochondria are fully active in respiring cells, which thus leads to increased oxidative stress. Consequently, Atg32 is upregulated in order to promote mitophagy. In addition, wild‐type cells mostly generate Atg8–PE, a recyclable lipid conjugate that functions properly in mitophagosome formation. In opi3‐null cells under the same conditions, Cho2 repression is substantially retarded, presumably facilitating production of SAH, Hcy, and GSH, which could therefore suppress oxidative stress and Atg32 induction. Concomitantly, cells lacking Opi3 accumulate PMME that is abnormally linked to Atg8. The atypical lipid conjugate Atg8–PMME, which accumulates to the late endosome‐like structure, is a poor substrate for Atg4, resulting in strong impairment of Atg8 recycling and mitophagosome formation. Accordingly, mitophagy is severely blocked in the opi3‐null mutant.
It is interesting to note that, in spite of PMME accumulation under fermentable (Dex) and starved (‐N) conditions (Fig 2D and E), loss of Opi3 only slightly affects the Cvt pathway, pexophagy, and bulk autophagy (Fig EV1C–H). We consider it likely that Atg8 is not drastically conjugated to PMME and that Atg8–PE is still predominantly generated to mediate the Cvt pathway in the fermenting opi3‐null mutant. We speculate that Atg8 is conjugated to both PE and PMME in starving cells lacking Opi3 and that Atg8–PE can promote pexophagy and bulk autophagy even in the presence of Atg8–PMME. How Atg8 becomes highly susceptible to its PMME‐linked state under non‐fermentable (mitophagy‐inducing) conditions remains obscure. It is possible that PMME could somehow be efficiently loaded to the Atg8 lipidation system (Atg7, Atg3, Atg8, and the Atg12–Atg5 conjugate) during respiratory growth. Alternatively, PMME could become a conjugation‐prone substrate for the Atg8 lipidation system in respiring cells. In addition, we do not exclude the possibility that Atg4‐dependent delipidation of Atg8–PMME might effectively occur under fermentable conditions. Further investigations are needed to clarify this issue.
Is Atg8–PMME capable of mediating autophagosome formation? Our GFP–Atg8 processing assays revealed that opi3‐null cells exhibited a 3‐fold reduction in autophagy flux compared with wild‐type cells (Fig EV3C and D). Assuming that Atg8–PE is produced with a decreased level but functional for autophagy‐related processes in respiring cells lacking Opi3, it seems probable that PMME‐conjugated Atg8 is not competent for generation of isolation membranes, thereby being excluded from autophagy flux. Consistent with this idea, transport of Ape1 (Cvt cargo) and autophagic bodies to the vacuole is partially impaired in the absence of Opi3 under mitophagy‐inducing conditions (Fig EV1A, and data not shown). The reason for the incompetency of Atg8–PMME is not entirely clear. Notably, Atg8 (likely PMME‐conjugated) forms aggregates in opi3‐null cells (Fig 4E), whereas it (PE‐conjugated) seems to be distributed throughout various organelles including the vacuole, endosome, and ER in atg4‐null cells (Nair et al, 2012; Nakatogawa et al, 2012). Thus, it is conceivable that the self‐assembly potency of Atg8–PMME might be aberrantly higher than that of the PE‐conjugated form and/or that Atg8–PMME might somehow be preferentially sorted to the late endosome‐like structures, ultimately preventing Atg8 from transport to the PAS for autophagosome biogenesis.
Although bulk autophagy and the Cvt pathway under starved and fermentable conditions, respectively, are partially impaired in atg4‐null cells expressing Atg8G116 (defective in Atg8 recycling) (Nair et al, 2012; Nakatogawa et al, 2012; Yu et al, 2012), mitophagy under non‐fermentable conditions hardly occur in the same cells (Fig 6A and B). The Atg32 expression profile is wild‐type‐like in this Atg8 delipidation mutant, indicating that the mitophagy machinery is not significantly altered (Fig 6C). How does Atg8 recycling deficiency predominantly affect degradation of mitochondria? Recent studies in yeast suggest that autophagosomes are formed at ER exit sites and the ER–Golgi intermediate compartment (Graef et al, 2013; Suzuki et al, 2013), whereas mitophagosomes are formed at the ER–mitochondria contacts associated with the mitochondrial constriction and division sites through the interaction between Atg11 and Dnm1, a dynamin‐related GTPase required for mitochondrial fission (Mao et al, 2013; Bockler & Westermann, 2014), raising the possibility that Atg8 targets to those formation sites in distinct ways. In addition, we have previously shown that defects in the interaction between Atg32 and free Atg8 cause partial impairment of mitophagy (Kondo‐Okamoto et al, 2012). Accordingly, the Atg8 delipidation mutant lacks a cytosolic pool of Atg8 that may be crucial for its Atg32‐mediated mitochondrial targeting and subsequent mitophagosome formation.
Intriguingly, a set of transcription factors seems to coordinate regulation of phospholipid methylation and mitophagy. The DNA binding protein Ume6 and the Sin3–Rpd3 histone deacetylase (HDAC) have been implicated as positive and negative regulators, respectively, of CHO2 expression (Jackson & Lopes, 1996; Elkhaimi et al, 2000; Chen et al, 2007). In addition, a recent study suggests that Ume6, Sin3, and Rpd3 form a heterotrimer to suppress ATG32 expression (Aihara et al, 2014). Thus, one scenario could be that Ume6 dissociates from the CHO2 and ATG32 promoter regions to decrease the Cho2 protein levels and increase the Atg32 protein levels, respectively, in cells under mitophagy‐inducing conditions. Cho2 repression could then contribute to a decrease in GSH levels and subsequent Atg32 induction (Figs 2A and F, and 3A). Whether the Sin3–Rpd3 HDAC complex interacts with a yet unidentified DNA binding protein to decrease the Cho2 protein levels under the same conditions remains obscure.
As two ubiquitin‐like conjugation systems essential for autophagy are well conserved among eukaryotes, it is conceivable that PMME could also be an unwanted target for lipidation of their Atg8 homologs. Indeed, GATE‐16–PMME can be formed but inefficiently deconjugated by Atg4 in vitro (Fig EV4D), raising the possibility that autophagosome formation might be compromised by PMME conjugation of this Atg8 homolog in mammals. Interestingly, phospholipid methyltransferases are dispersively present throughout various eukaryotic organisms (Lykidis, 2007). For example, Cho2 and Opi3 homologs have not been found in fruit flies, nematodes, and plants. The Kennedy pathway using choline and phosphoethanolamine probably plays a primary role in their PC biosynthesis without generating PMME. We therefore assume that there may have been an evolutionary advantage to rely on the Kennedy pathway, thereby circumventing the risk of Atg8–PMME formation. In mammals, PE N‐methyltransferase (PEMT), an Opi3‐type enzyme, is mainly expressed in liver and catalyzes all three methylation steps to produce PC (Vance, 2014). Whether malfunction of PEMT causes PMME accumulation that ultimately leads to autophagy deficiency and liver disease awaits future studies. In conclusion, our findings provide insight into how phospholipid methylation is linked to mitophagy induction, and imply that the appropriate control of PE‐to‐PC conversion is critical for autophagosome formation.
Materials and Methods
Strains and growth conditions
Yeast strains and plasmids used in this study are described in Tables EV1 and EV2. Standard genetic and molecular biology methods were used for yeast and bacterial strains. Yeast cultures were prepared as described elsewhere (Okamoto et al, 2009). Yeast cells were grown at 30°C in rich medium (YPD; 1% yeast extract, 2% peptone, 2% dextrose), and synthetic medium (0.17% yeast nitrogen base without amino acids and ammonium sulfate, 0.5% ammonium sulfate, 0.5% casamino acids) containing 2% dextrose (SDCA) or 0.1% dextrose plus 3% glycerol (SDGlyCA), supplemented with necessary amino acids. For mitophagy induction, cell grown to mid‐log phase in SDCA were incubated at 30°C in SDGlyCA. For autophagy induction, cells grown to mid‐log phase in YPD were incubated at 30°C in starvation medium (SD‐N; 0.17% yeast nitrogen base without amino acids and ammonium sulfate, 2% dextrose). For pexophagy induction, cells grown in oleate medium (synthetic medium plus 0.12% oleate [v/v], 0.2% Tween‐40R [v/v], 0.1% yeast extract) were incubated at 30°C in SD‐N. For Atg4 repression and induction under the GAL promoter, cells grown to mid‐log phase in SDCA were incubated at 30°C in SDGlyCA for 24 h and then supplemented with 0.1% galactose.
Fluorescence microscopy
Cells were observed as described elsewhere (Eiyama et al, 2013) using an inverted microscope (Axio Observer; Carl Zeiss) equipped with differential interference contrast optics, epifluorescence capabilities, a 100× objective lens (αPlan‐APOCHROMAT 100x, Na: 1.46; Carl Zeiss), a monochrome CCD camera (AxioCam MRm; Carl Zeiss), and filter sets for GFP and mCherry (13 and 20, respectively; Carl Zeiss). Images were captured using image acquisition and analysis software (Axio Vision 4.6; Carl Zeiss).
Glutathione measurement assay
Glutathione was quantified by GSSG/GSH Quantification kit (Dojindo Molecular Technologies), according to the manufacturer's protocol. Briefly, 15 OD600 units of cells were harvested, resuspended in 5% sulfosalicylic acid, and vortexed (4 × 1 min) with glass beads, incubated on ice for 15 min, and then centrifuged for 10 min at 17,900 × g. The supernatant was diluted fivefold with water and then subjected to glutathione measurement assay.
Immunoblotting
Samples corresponding to 0.1 OD600 units of cells were separated by SDS–PAGE followed by Western blotting and immunodecoration with following antibodies: Pgk1 and Por1 (Invitrogen); GFP (Roche Diagnostics GmbH); HA (16B12) (Covance); RFP, Cho1, Cho2, and Opi3 gifted from Drs. Toshiya Endo (Kyoto Sangyo University, Japan) and Yasushi Tamura (Yamagata University, Japan); Ape1 and Atg8 from Dr. Hitoshi Nakatogawa (Tokyo Institute of Technology, Japan); and Atg32 (4A11A6). After treatment with enhanced chemiluminescence reagents, proteins were detected using a luminescent image analyzer (LAS‐4000 mini; GE Healthcare).
RNA preparation and quantitative RT–PCR
RNA was isolated by MasterPure yeast RNA purification kit (Epicentre) from 2 OD600 units of cells, according to the manufacturer's protocol. RNA concentration was measured by absorption spectrometer. Equal amounts of total RNA were mixed with RNA‐direct CYBR Green Real‐time PCR Master Mix (TOYOBO) and the following primers: ATG32 forward 5′‐TGTCACTGCAGCATACGAACAC, reverse 5′‐CTGCTCAGTTGAAGAAGGAGATG; ACT1 forward 5′‐TATCGTCGGTAGACCAAGACAC, reverse 5′‐TCGTCCCAGTTGGTGACAATAC. The Applied Biosystems StepOne Plus (Applied Biosystems) was used for quantitative RT–PCR analysis. For each gene, triplicated samples were calculated to average values and then normalized to actin. These numbers were set to relative expression of ATG32 mRNA expression as arbitrary values.
Phospholipid composition assay
Cells were grown at 30°C in media containing [32P]Pi (10 μCi ml−1) (MP Biomedicals), and total cellular lipids were analyzed as described elsewhere (Kuroda et al, 2011; Tani & Kuge, 2012). The radiolabeled cells were collected by centrifugation, washed with distilled water, and then suspended in 150 μl of 80% ethanol. After heating at 95°C for 30 min, 800 μl of chloroform/methanol (1:1, v/v) and subsequently 330 μl of PBS were added to the sample. The sample was mixed well and then centrifuged at 10,000 × g for 1 min. The lower phase was collected, dried, and applied to a LK5 silica gel 150 A TLC plate (Whatman), which had been pre‐washed in chloroform/methanol (1:1, v/v) and treated with 2% boric acid in ethanol. The TLC plate was developed two times with chloroform/ethanol/water/triethylamine (30:35:7:35, v/v) and then analyzed with a Bio Imaging analyzer FLA‐2000 (Fuji Photo Film).
Density gradient centrifugation analysis
Yeast cells grown to mid‐log phase in SDCA medium were incubated at 30°C in SDGlyCA medium for 48 h. Cells were harvested and were washed with 5 ml wash buffer A (0.1 M Tris–HCl [pH 8.0], 10 mM DTT). The cells were suspended in 5 ml spheroplast buffer (1× SGlyCA, 1.0 M sorbitol, 1 mg/ml Zymolyase 100T [Seikagaku Biobusiness]) and incubated at 30°C for 60 min to be converted to spheroplasts. Spheroplasts were washed with 20 ml of wash buffer B (20 mM HEPES‐KOH [pH 7.2], 1.2 M sorbitol) and suspended in 4 ml of density gradient buffer (20 mM HEPES‐KOH [pH 7.2], 0.2 M sorbitol, 1 mM PMSF [Sigma], 1× protease inhibitor cocktail for mammal [Sigma], 20 mM N‐ethylmaleimide [NEM]). Then, spheroplasts were lysed by passage through a 3‐μm pore‐sized polycarbonate membrane (Millipore). After centrifugation at 500 × g for 10 min, 900 μl of yeast cell lysates was layered on 10 ml of a 15–60% (vol/vol) OptiPrep (Axis‐Shield) linear gradient prepared using density gradient buffer (20 mM HEPES‐KOH [pH 7.2], 0.2 M sorbitol, 5 mM EDTA, 1× protease inhibitor cocktail for mammal [Sigma], and 10 mM N‐ethylmaleimide [NEM]) and centrifugated at 150,000 × g for 16 h at 4°C. The samples were divided into 16 fractions from the top of the gradients and analyzed by SDS–PAGE and immunoblotting.
In vitro Atg8‐lipidation and ‐delipidation assay
Recombinant protein expression/purification, liposome preparation, and in vitro conjugation of Atg8 to PE or PMME were performed according to methods described elsewhere (Ichimura et al, 2004; Hanada et al, 2007; Nakatogawa et al, 2007). Briefly, yeast Atg8 (5 μM), Atg7 (E1, 1 μM), Atg3 (E2, 1 μM), and Atg12–Atg5 (E3‐like conjugate, 0.2 μM) proteins were purified from E. coli and incubated with liposomes (350 μM lipids, Avanti Polar Lipids) composed of 55 mol% dioleoylphosphatidylethanolamine (DOPE) or dioleoylphosphatidylmonomethylethanolamine (DOPMME), 35 mol% 1‐palmitoyl‐2‐oleoylphosphatidylcholine (POPC), and 10 mol% phosphatidylinositol (PI) from yeast in the presence of 1 mM ATP at 30°C for 60 min. The reactions were further treated with or without purified Atg4 (0.6 μM) at 30°C for 10 min and analyzed by urea–SDS–PAGE and CBB staining.
Protein purification and in vitro Atg4 processing assay
2,000 OD600 units of cells gown in SDGlyCA for 24 h were subjected to protein purification. Membrane‐enriched fractions treated with protease inhibitor cocktail and 20 mM N‐ethylmaleimide (NEM) were resuspended in lysis buffer (50 mM Tris–HCl [pH 7.5], 100 mM NaCl, 0.1 mM EDTA, 1.6% Triton X‐100) containing 1 mM phenylmethylsulfonyl fluoride (PMSF) at 4°C for 30 min and subjected to centrifugation (15,000 × g) at 4°C for 15 min. The supernatant was incubated with Ni‐NTA agarose (Nacalai Tesuque) at 4°C for 1 h with gentle agitation. The beads were washed once with wash buffer (50 mM Tris–HCl [pH 7.5], 100 mM NaCl, 0.1 mM EDTA, 0.4% Triton X‐100) containing protease inhibitor cocktail and then eluted with elution buffer (50 mM Tris–HCl, 100 mM NaCl, 0.1 mM EDTA, 250 mM Imidazole). Collected fractions were incubated with anti‐FLAG M2 affinity gel (Sigma) at 4°C for 1 h with gentle agitation. The beads were washed twice with TBS buffer, and immunoprecipitates were extracted by SDS‐sample buffer. For in vivo processing assay, 20 OD600 units of membrane‐enriched fractions were prepared without protease inhibitor cocktail and NEM, and subjected to processing assay with 0.15 μM recombinant Atg4 with or without NEM. After incubation, the samples were lysed with 2× lysis buffer, and proteins were purified by the same procedures as described above.
Preparation of C‐terminal fragments of Atg8
Polyacrylamide gel slices containing Atg8–PE, Atg8–PME, or His–FLAG–Atg8 were dried and treated with 0.06 M NaOH in 30% CH3OH at 40°C for 4 h to saponify ester bonds between glycerol and fatty acids of phospholipids. Thereafter, each protein band was subjected to in‐gel digestion with lysylendopeptidase (2 pmol) in 50 mM Tris–HCl (pH 8.0), which was prepared with 40 atom % H2 18O, at 37°C for 12 h. The resulting peptides were extracted with 0.1% trifluoroacetic acid (TFA) in 50% acetonitorile from the gel and desalted with NuTip apillary C18 (Glygen) prior to mass measurements.
Matrix‐assisted laser desorption/ionization (MALDI) mass spectrometry
To analyze the lipid modification of Atg8, the lysylendopeptidase digest was applied onto a flat surface of a stainless steel plate (a MALDI sample plate). Thereafter, the matrix solution (5 mg/ml of α‐CHCA) was blotted. The MS and MS/MS measurements were carried out in a negative‐ion mode using a MALDI‐TOF/TOF (4700 proteomics analyzer, Applied Biosystems). Ions were generated by irradiating the sample area with a 200 Hz Nd:YAG laser operated at 355 nm. Calibration was performed using MH− ions of a mixture of angiotensin I (m/z 1294.6), dynorphin (m/z 1602.0), ACTH (1–24) (m/z 2930.6), and β‐endorphin (m/z 3461.8). For MS/MS, the precursor ions were accelerated at 8 kV in MS1 and fragmented in a collision cell using air as the collision gas. The resultant fragment ions, re‐accelerated at 15 kV, were analyzed in MS2 equipped with a reflectron.
Further details are provided in Appendix Supplementary Methods.
Author contributions
KS, AE, SWS, MS‐N, NO, MT, and TT designed and performed the experiments, analyzed the results, and wrote the manuscript. AH, SN, CK‐K, EA, and HK performed the experiments and analyzed the results. NK‐O initiated and designed the project, and edited the manuscript. HN designed the experiments, analyzed the results, and wrote the manuscript. OK and YO designed and commented on the project. KO initiated and designed the project, directed the research, and wrote the manuscript.
Conflict of interest
The authors declare that they have no conflict of interest.
Supporting information
Appendix
Expanded View Figures PDF
Table EV1
Table EV2
Review Process File
Acknowledgements
We thank Toshiya Endo (Kyoto Sangyo University, Kyoto, Japan), Yasushi Tamura (Yamagata University, Yamagata, Japan), and Yoshiharu Inoue (Kyoto University, Kyoto, Japan) for kind gifts of antibodies, plasmids, yeast strains, and protocols. We are also grateful to Hayashi Yamamoto (Tokyo Institute of Technology, Yokohama, Japan) for helpful discussions and comments on the manuscript. This work was supported in part by Japan Society for the Promotion of Science (JSPS), Grant‐in‐Aid for JSPS Fellows (2540092) to NK‐O, (261682) to AE, and (15J06634) to SWS, Scientific Research (B) (25291045) to KO, Young Scientists (B) (26840067) to KS, and Scientific Research (C) (26440052) to NK‐O, by the Ministry of Education, Culture, Science, and Technology of Japan, Grant‐in‐Aid for Scientific Research on Priority Areas (22020012), Scientific Research on Innovative Areas (23113717, 26111513, and 15H01536), Challenging Exploratory Research (23657090 and 25650067), and special coordination funds from the Osaka University Life Science Young Independent Researcher Support Program to Disseminate Tenure Tracking System, and by Grants from the Ono Medical Research Foundation to KO. NK‐O, AE, and SWS were supported by JSPS Research Fellowships RPD, DC1, and SPD, respectively, for Young Scientists.
The EMBO Journal (2015) 34: 2703–2719
References
- Aihara M, Jin X, Kurihara Y, Yoshida Y, Matsushima Y, Oku M, Hirota Y, Saigusa T, Aoki Y, Uchiumi T, Yamamoto T, Sakai Y, Kang D, Kanki T (2014) Tor and the Sin3‐Rpd3 complex regulate expression of the mitophagy receptor protein Atg32 in yeast. J Cell Sci 127: 3184–3196 [DOI] [PubMed] [Google Scholar]
- Aoki Y, Kanki T, Hirota Y, Kurihara Y, Saigusa T, Uchiumi T, Kang D (2011) Phosphorylation of Serine 114 on Atg32 mediates mitophagy. Mol Biol Cell 22: 3206–3217 [DOI] [PMC free article] [PubMed] [Google Scholar]
- Birgisdottir AB, Lamark T, Johansen T (2013) The LIR motif – crucial for selective autophagy. J Cell Sci 126: 3237–3247 [DOI] [PubMed] [Google Scholar]
- Biterova EI, Barycki JJ (2010) Structural basis for feedback and pharmacological inhibition of Saccharomyces cerevisiae glutamate cysteine ligase. J Biol Chem 285: 14459–14466 [DOI] [PMC free article] [PubMed] [Google Scholar]
- Bockler S, Westermann B (2014) Mitochondrial ER contacts are crucial for mitophagy in yeast. Dev Cell 28: 450–458 [DOI] [PubMed] [Google Scholar]
- Chen M, Hancock LC, Lopes JM (2007) Transcriptional regulation of yeast phospholipid biosynthetic genes. Biochim Biophys Acta 1771: 310–321 [DOI] [PubMed] [Google Scholar]
- Deffieu M, Bhatia‐Kissova I, Salin B, Galinier A, Manon S, Camougrand N (2009) Glutathione participates in the regulation of mitophagy in yeast. J Biol Chem 284: 14828–14837 [DOI] [PMC free article] [PubMed] [Google Scholar]
- Eiyama A, Kondo‐Okamoto N, Okamoto K (2013) Mitochondrial degradation during starvation is selective and temporally distinct from bulk autophagy in yeast. FEBS Lett 587: 1787–1792 [DOI] [PubMed] [Google Scholar]
- Elkhaimi M, Kaadige MR, Kamath D, Jackson JC, Biliran H Jr, Lopes JM (2000) Combinatorial regulation of phospholipid biosynthetic gene expression by the UME6, SIN3 and RPD3 genes. Nucleic Acids Res 28: 3160–3167 [DOI] [PMC free article] [PubMed] [Google Scholar]
- Gaynor PM, Gill T, Toutenhoofd S, Summers EF, McGraw P, Homann MJ, Henry SA, Carman GM (1991) Regulation of phosphatidylethanolamine methyltransferase and phospholipid methyltransferase by phospholipid precursors in Saccharomyces cerevisiae . Biochim Biophys Acta 1090: 326–332 [DOI] [PubMed] [Google Scholar]
- Graef M, Friedman JR, Graham C, Babu M, Nunnari J (2013) ER exit sites are physical and functional core autophagosome biogenesis components. Mol Biol Cell 24: 2918–2931 [DOI] [PMC free article] [PubMed] [Google Scholar]
- Greenberg ML, Reiner B, Henry SA (1982) Regulatory mutations of inositol biosynthesis in yeast: isolation of inositol‐excreting mutants. Genetics 100: 19–33 [DOI] [PMC free article] [PubMed] [Google Scholar]
- Greenberg ML, Klig LS, Letts VA, Loewy BS, Henry SA (1983) Yeast mutant defective in phosphatidylcholine synthesis. J Bacteriol 153: 791–799 [DOI] [PMC free article] [PubMed] [Google Scholar]
- Hanada T, Noda NN, Satomi Y, Ichimura Y, Fujioka Y, Takao T, Inagaki F, Ohsumi Y (2007) The Atg12‐Atg5 conjugate has a novel E3‐like activity for protein lipidation in autophagy. J Biol Chem 282: 37298–37302 [DOI] [PubMed] [Google Scholar]
- Henry SA, Kohlwein SD, Carman GM (2012) Metabolism and regulation of glycerolipids in the yeast Saccharomyces cerevisiae . Genetics 190: 317–349 [DOI] [PMC free article] [PubMed] [Google Scholar]
- Hirota Y, Kang D, Kanki T (2012) The physiological role of mitophagy: new insights into phosphorylation events. Int J Cell Biol 2012: 354914 [DOI] [PMC free article] [PubMed] [Google Scholar]
- Ichimura Y, Kirisako T, Takao T, Satomi Y, Shimonishi Y, Ishihara N, Mizushima N, Tanida I, Kominami E, Ohsumi M, Noda T, Ohsumi Y (2000) A ubiquitin‐like system mediates protein lipidation. Nature 408: 488–492 [DOI] [PubMed] [Google Scholar]
- Ichimura Y, Imamura Y, Emoto K, Umeda M, Noda T, Ohsumi Y (2004) In vivo and in vitro reconstitution of Atg8 conjugation essential for autophagy. J Biol Chem 279: 40584–40592 [DOI] [PubMed] [Google Scholar]
- Jackson JC, Lopes JM (1996) The yeast UME6 gene is required for both negative and positive transcriptional regulation of phospholipid biosynthetic gene expression. Nucleic Acids Res 24: 1322–1329 [DOI] [PMC free article] [PubMed] [Google Scholar]
- Kanki T, Klionsky DJ (2008) Mitophagy in yeast occurs through a selective mechanism. J Biol Chem 283: 32386–32393 [DOI] [PMC free article] [PubMed] [Google Scholar]
- Kanki T, Wang K, Cao Y, Baba M, Klionsky DJ (2009) Atg32 is a mitochondrial protein that confers selectivity during mitophagy. Dev Cell 17: 98–109 [DOI] [PMC free article] [PubMed] [Google Scholar]
- Kanki T, Kurihara Y, Jin X, Goda T, Ono Y, Aihara M, Hirota Y, Saigusa T, Aoki Y, Uchiumi T, Kang D (2013) Casein kinase 2 is essential for mitophagy. EMBO Rep 14: 788–794 [DOI] [PMC free article] [PubMed] [Google Scholar]
- Kasahara A, Scorrano L (2014) Mitochondria: from cell death executioners to regulators of cell differentiation. Trends Cell Biol 24: 761–770 [DOI] [PubMed] [Google Scholar]
- Kirisako T, Ichimura Y, Okada H, Kabeya Y, Mizushima N, Yoshimori T, Ohsumi M, Takao T, Noda T, Ohsumi Y (2000) The reversible modification regulates the membrane‐binding state of Apg8/Aut7 essential for autophagy and the cytoplasm to vacuole targeting pathway. J Cell Biol 151: 263–276 [DOI] [PMC free article] [PubMed] [Google Scholar]
- Kodaki T, Yamashita S (1987) Yeast phosphatidylethanolamine methylation pathway. Cloning and characterization of two distinct methyltransferase genes. J Biol Chem 262: 15428–15435 [PubMed] [Google Scholar]
- Kondo‐Okamoto N, Noda NN, Suzuki SW, Nakatogawa H, Takahashi I, Matsunami M, Hashimoto A, Inagaki F, Ohsumi Y, Okamoto K (2012) Autophagy‐related protein 32 acts as autophagic degron and directly initiates mitophagy. J Biol Chem 287: 10631–10638 [DOI] [PMC free article] [PubMed] [Google Scholar]
- Kurihara Y, Kanki T, Aoki Y, Hirota Y, Saigusa T, Uchiumi T, Kang D (2012) Mitophagy plays an essential role in reducing mitochondrial production of reactive oxygen species and mutation of mitochondrial DNA by maintaining mitochondrial quantity and quality in yeast. J Biol Chem 287: 3265–3272 [DOI] [PMC free article] [PubMed] [Google Scholar]
- Kuroda T, Tani M, Moriguchi A, Tokunaga S, Higuchi T, Kitada S, Kuge O (2011) FMP30 is required for the maintenance of a normal cardiolipin level and mitochondrial morphology in the absence of mitochondrial phosphatidylethanolamine synthesis. Mol Microbiol 80: 248–265 [DOI] [PubMed] [Google Scholar]
- Labbe K, Murley A, Nunnari J (2014) Determinants and functions of mitochondrial behavior. Annu Rev Cell Dev Biol 30: 357–391 [DOI] [PubMed] [Google Scholar]
- Liu L, Sakakibara K, Chen Q, Okamoto K (2014) Receptor‐mediated mitophagy in yeast and mammalian systems. Cell Res 24: 787–795 [DOI] [PMC free article] [PubMed] [Google Scholar]
- Lykidis A (2007) Comparative genomics and evolution of eukaryotic phospholipid biosynthesis. Prog Lipid Res 46: 171–199 [DOI] [PubMed] [Google Scholar]
- Mao K, Wang K, Liu X, Klionsky DJ (2013) The scaffold protein Atg11 recruits fission machinery to drive selective mitochondria degradation by autophagy. Dev Cell 26: 9–18 [DOI] [PMC free article] [PubMed] [Google Scholar]
- Mishra P, Chan DC (2014) Mitochondrial dynamics and inheritance during cell division, development and disease. Nat Rev Mol Cell Biol 15: 634–646 [DOI] [PMC free article] [PubMed] [Google Scholar]
- Mizushima N (2011) Autophagy in protein and organelle turnover. Cold Spring Harb Symp Quant Biol 76: 397–402 [DOI] [PubMed] [Google Scholar]
- Morano KA, Grant CM, Moye‐Rowley WS (2012) The response to heat shock and oxidative stress in Saccharomyces cerevisiae . Genetics 190: 1157–1195 [DOI] [PMC free article] [PubMed] [Google Scholar]
- Nair U, Yen WL, Mari M, Cao Y, Xie Z, Baba M, Reggiori F, Klionsky DJ (2012) A role for Atg8‐PE deconjugation in autophagosome biogenesis. Autophagy 8: 780–793 [DOI] [PMC free article] [PubMed] [Google Scholar]
- Nakatogawa H, Ichimura Y, Ohsumi Y (2007) Atg8, a ubiquitin‐like protein required for autophagosome formation, mediates membrane tethering and hemifusion. Cell 130: 165–178 [DOI] [PubMed] [Google Scholar]
- Nakatogawa H, Ishii J, Asai E, Ohsumi Y (2012) Atg4 recycles inappropriately lipidated Atg8 to promote autophagosome biogenesis. Autophagy 8: 177–186 [DOI] [PubMed] [Google Scholar]
- Nakatogawa H, Ohsumi Y (2012) SDS‐PAGE techniques to study ubiquitin‐like conjugation systems in yeast autophagy. Methods Mol Biol 832: 519–529 [DOI] [PubMed] [Google Scholar]
- Nakatogawa H (2013) Two ubiquitin‐like conjugation systems that mediate membrane formation during autophagy. Essays Biochem 55: 39–50 [DOI] [PubMed] [Google Scholar]
- Narendra D, Walker JE, Youle R (2012) Mitochondrial quality control mediated by PINK1 and Parkin: links to parkinsonism. Cold Spring Harb Perspect Biol 4: a011338 [DOI] [PMC free article] [PubMed] [Google Scholar]
- Ney PA (2011) Normal and disordered reticulocyte maturation. Curr Opin Hematol 18: 152–157 [DOI] [PMC free article] [PubMed] [Google Scholar]
- Noda NN, Ohsumi Y, Inagaki F (2010) Atg8‐family interacting motif crucial for selective autophagy. FEBS Lett 584: 1379–1385 [DOI] [PubMed] [Google Scholar]
- Nunnari J, Suomalainen A (2012) Mitochondria: in sickness and in health. Cell 148: 1145–1159 [DOI] [PMC free article] [PubMed] [Google Scholar]
- Okamoto K, Kondo‐Okamoto N, Ohsumi Y (2009) Mitochondria‐anchored receptor Atg32 mediates degradation of mitochondria via selective autophagy. Dev Cell 17: 87–97 [DOI] [PubMed] [Google Scholar]
- Okamoto K (2014) Organellophagy: eliminating cellular building blocks via selective autophagy. J Cell Biol 205: 435–445 [DOI] [PMC free article] [PubMed] [Google Scholar]
- Richard VR, Leonov A, Beach A, Burstein MT, Koupaki O, Gomez‐Perez A, Levy S, Pluska L, Mattie S, Rafesh R, Iouk T, Sheibani S, Greenwood M, Vali H, Titorenko VI (2013) Macromitophagy is a longevity assurance process that in chronologically aging yeast limited in calorie supply sustains functional mitochondria and maintains cellular lipid homeostasis. Aging 5: 234–269 [DOI] [PMC free article] [PubMed] [Google Scholar]
- Rogov V, Dotsch V, Johansen T, Kirkin V (2014) Interactions between autophagy receptors and ubiquitin‐like proteins form the molecular basis for selective autophagy. Mol Cell 53: 167–178 [DOI] [PubMed] [Google Scholar]
- Rugarli EI, Langer T (2012) Mitochondrial quality control: a matter of life and death for neurons. EMBO J 31: 1336–1349 [DOI] [PMC free article] [PubMed] [Google Scholar]
- Stolz A, Ernst A, Dikic I (2014) Cargo recognition and trafficking in selective autophagy. Nat Cell Biol 16: 495–501 [DOI] [PubMed] [Google Scholar]
- Summers EF, Letts VA, McGraw P, Henry SA (1988) Saccharomyces cerevisiae cho2 mutants are deficient in phospholipid methylation and cross‐pathway regulation of inositol synthesis. Genetics 120: 909–922 [DOI] [PMC free article] [PubMed] [Google Scholar]
- Suzuki K, Kirisako T, Kamada Y, Mizushima N, Noda T, Ohsumi Y (2001) The pre‐autophagosomal structure organized by concerted functions of APG genes is essential for autophagosome formation. EMBO J 20: 5971–5981 [DOI] [PMC free article] [PubMed] [Google Scholar]
- Suzuki K, Akioka M, Kondo‐Kakuta C, Yamamoto H, Ohsumi Y (2013) Fine mapping of autophagy‐related proteins during autophagosome formation in Saccharomyces cerevisiae . J Cell Sci 126: 2534–2544 [DOI] [PubMed] [Google Scholar]
- Tani M, Kuge O (2012) Involvement of complex sphingolipids and phosphatidylserine in endosomal trafficking in yeast Saccharomyces cerevisiae . Mol Microbiol 86: 1262–1280 [DOI] [PubMed] [Google Scholar]
- Tehlivets O (2011) Homocysteine as a risk factor for atherosclerosis: is its conversion to s‐adenosyl‐L‐homocysteine the key to deregulated lipid metabolism? J Lipids 2011: 702853 [DOI] [PMC free article] [PubMed] [Google Scholar]
- Tehlivets O, Malanovic N, Visram M, Pavkov‐Keller T, Keller W (2013) S‐adenosyl‐L‐homocysteine hydrolase and methylation disorders: yeast as a model system. Biochim Biophys Acta 1832: 204–215 [DOI] [PMC free article] [PubMed] [Google Scholar]
- Vaden DL, Gohil VM, Gu Z, Greenberg ML (2005) Separation of yeast phospholipids using one‐dimensional thin‐layer chromatography. Anal Biochem 338: 162–164 [DOI] [PubMed] [Google Scholar]
- Vance DE (2014) Phospholipid methylation in mammals: from biochemistry to physiological function. Biochim Biophys Acta 1838: 1477–1487 [DOI] [PubMed] [Google Scholar]
- Weidberg H, Shvets E, Elazar Z (2011) Biogenesis and cargo selectivity of autophagosomes. Annu Rev Biochem 80: 125–156 [DOI] [PubMed] [Google Scholar]
- Youle RJ, Narendra DP (2011) Mechanisms of mitophagy. Nat Rev Mol Cell Biol 12: 9–14 [DOI] [PMC free article] [PubMed] [Google Scholar]
- Youle RJ, van der Bliek AM (2012) Mitochondrial fission, fusion, and stress. Science 337: 1062–1065 [DOI] [PMC free article] [PubMed] [Google Scholar]
- Yu ZQ, Ni T, Hong B, Wang HY, Jiang FJ, Zou S, Chen Y, Zheng XL, Klionsky DJ, Liang Y, Xie Z (2012) Dual roles of Atg8‐PE deconjugation by Atg4 in autophagy. Autophagy 8: 883–892 [DOI] [PMC free article] [PubMed] [Google Scholar]
Associated Data
This section collects any data citations, data availability statements, or supplementary materials included in this article.
Supplementary Materials
Appendix
Expanded View Figures PDF
Table EV1
Table EV2
Review Process File