

Abstract
Midbrain dopamine (DA) neurons are involved in cognition, control of motor activity, and emotion-related behaviors. Degeneration of DA neurons particularly in the substantia nigra (SN) is a hall marker in Parkinson’s disease (PD). The homeobox transcription factor, Pitx3, plays a critical role in the development, function, and maintenance of midbrain DA neurons. We found that in young adult Pitx3 null mice, Pitx3(−/−), there was decreased tyrosine hydroxylase (TH) staining, indicating a loss of DA neurons particularly in the SN. In addition, fast-scan cyclic voltammetry and microdialysis assays of DA release indicated that the lack of Pitx3 caused a significant reduction of striatal DA release. Tonic DA release was impaired more significantly than the phasic DA release induced by burst firing of DA neurons. Furthermore, behavioral tests revealed that Pitx3(−/−) mice displayed abnormal motor activities, including impaired motor coordination and decreased locomotion. In summary, these data provide further evidence that Pitx3 is specifically required for DA-related function and, if impaired, Pitx3 could contribute during the pathogenesis of PD.
Keywords: Transcription factor, Substantia nigra, Animal model, Parkinson’s disease, Striatum
Graphical Abstract
1. Introduction
Midbrain dopamine (DA) neurons play an essential role in the control of motor activity and other behaviors related to emotion and cognition. Degeneration of these neurons, especially in the substantia nigra compacta (SNc), causes Parkinson’s disease (PD), which is a severe neurological disease primarily characterized by DA dysfunction in the nigrostriatal system (Braak, et al., 2003; Jellinger, 2012; Li, et al., 2009; Simon, et al., 2003).
Several transcription factors regulate the differentiation of midbrain DA neuron precursors. Nurr1, a member of the Nur77/NGFI-B subfamily of the nuclear receptor superfamily of transcription factors, is strongly implicated in the growth, maintenance, and survival of DA neurons. Mice harboring null alleles of Nurr1 do not express tyrosine hydroxylase (TH) (Baffi, et al., 1999; Eells, et al., 2001; Kim, et al., 2003; Le, et al., 1999; Sakurada, et al., 1999), which catalyzes the initial step of DA neurotransmitter biosynthesis. Furthermore, mice deficient in Nurr1(+/−) show a rapid onset of age-related decline in DA signaling that precedes the significant loss of DA neurons (Zhang, et al., 2012). Another factor, LIM homeodomain transcription factor (Lmx1b), contributes partially to the specification of DA neuronal progenitors beginning on embryonic day 12.5 in the mouse, but Lmx1b is not essential for TH gene expression (Smidt, et al., 2000). A third transcription factor, the bicoid-related homeodomain-containing transcription factor, Pitx3, plays an important roles in the development, function, and maintenance of midbrain DA neurons (Andersson, et al., 2006; Li, et al., 2009; Wallen and Perlmann, 2003). Pitx3 is expressed in the SNc and the ventral tegmental area (VTA) DA neurons (Smidt, et al., 1997; Zhao, et al., 2004). However, the lack of Pitx3 results in the preferential loss of the SNc neuronal sub-population whereas the VTA neurons remain relatively intact, a phenotype that closely resembles that of PD (Hwang, et al., 2003; Maxwell, et al., 2005; Smidt, et al., 2004; van den Munckhof, et al., 2003). Moreover, Pitx3 directly regulates the expression of a cascade of molecules in DA neurons, including TH, Vmat2, En1, BDNF and GDNF, indicating that Pitx3 expression is important for the function of adult midbrain DA neurons (Kim, et al., 2014; Maxwell, et al., 2005; Peng, et al., 2011; Peng, et al., 2007; Yang, et al., 2008).
To further identify the biological functions of Pitx3 in the midbrain DA system, we used the Pitx3-null (Pitx3−/−) mice to examine Pitx3-regulated DA release and the loss of DA neurons associated with the decline of motor activities. In the present study, we report that Pitx3-lacking mice (3–5 months in age) showed a loss of DA neurons mainly in the SNc, as revealed by the loss of TH-positive staining. In addition, fast-scan cyclic voltammetry and microdialysis assays of DA signaling indicated that the lack of Pitx3 caused significant reduction of striatal DA release. Associated with the loss of DA neurons and DA signaling there were motor-activity deficits, including impaired motor coordination and decreased locomotion. In summary, these data provide direct evidence that the lack of Pitx3 caused DA neuron loss, decreased DA signaling, and contributed to deficits in locomotor activities.
2. Methods
2.1 Pitx3 null mutant mice
Pitx3 heterozygous null mice (Pitx3+/−), were kindly provided by Professor Beeler, Department of Neurobiology, The University of Chicago, Chicago, IL, USA. The mice were inbred and expanded at the transgenic animal center of Baylor College of Medicine. The siblings of the inbred mice were analyzed for their genotypes through the restriction enzyme digestion of PCR product from mouse tail extracted DNA. We employed 3–5 months old Pitx3 homozygous null mice for our experiments and their wild-type littermates as controls with the same genetic background for the behavioral and anatomy experiments. Because the Pitx3(−/−) mice displayed a dramatic decrease in DA release beginning in the early ages (3–5 months) and there was not a dramatic age-associated decline shortly beyond that age group, we grouped data from mice at 3–5 m age when examining DA release with fast-scan cyclic voltammetry. Mice were housed and handled in accordance with the guidelines approved by the animal care committee at Baylor College of Medicine.
2.2 Behavioral assessment of Pitx3(−/−) mice
The behavioral performance of Pitx3(−/−) or their wild-type littermates was evaluated using the rotarod test and the locomotor activity test. Motor coordination was determined with an accelerating rotarod treadmill (Columbus Instruments, Columbus, OH, USA). Initially, each mouse was required to perch on the stationary rod for 30 s to accustom itself to the environment. Then the animals were trained at a constant speed of 5 rpm for 90 s. After this training session, the mice were tested three times at 1 h intervals on 3 consecutive days for a total of nine tests. During each test, the rotarod was set at a starting speed of 5 rpm for 30 s and the speed was increased by 0.1 revolution per second. All animals were tested three times for each experiment, and the means of the test results underwent statistical analysis. Locomotive activities were carried out from 9 AM to 11 AM in a relatively dark room, and the behavioral performance was monitored by the AccuScanDigiscan system (AccuScan Instruments, Inc., Columbus, OH, USA). Data collected by computer included total distance traveled (cm/60 min) and moving time (s/60 min). Each mouse was placed in the testing chamber for 30 min for adaptation, followed by a 60 min recording by the computer-generated automatic analysis system.
2.3 Tyrosine hydroxylase (TH) immunohistochemistry
Mice were transcardially perfused with ice-cold phosphate-buffered saline (pH 7.4), and the central part of the striatum and the midbrain were dissected for DA biochemistry and TH immunostaining. The midbrains were fixed, rapidly frozen, and sectioned into 30 μm slices. The slices were systematically chosen at 150 μm intervals. Free-floating sections were incubated successively for 15 min with 0.05% H2O2 in 0.1 M PBS to remove endogenous peroxidase activity for 1 h with 2% goat serum/0.1% Triton X-100 in 0.1 M PBS to block non-specific binding sites, and for 24 hours at 4°C with the primary anti-TH antibody (rabbit, 1:4000; Protos Biotech, New York, NY, USA) to detect DA neurons. After washing, sections were then incubated for 2 h at a routine time with the appropriate biotinylated secondary antibody (anti-rabbit, 1:200; Vector Laboratories Inc., Burlingame, CA, USA). The avidin–biotin method was used to amplify the signal (ABC Kit; Vector Laboratories Inc.) and 3,3′-diaminobenzidine tetrachloride (DAB) was used to visualize bound antibodies.
We used stereological methods to evaluate the number of TH-positive DA neurons in the SNc using a stereological system (Axioskop 2; Carl Zeiss Inc., Thornwood, NY, USA). Counting was performed with the computer-assisted stereological toolbox software program, Stereo Investigator 7.0 (MicroBrightField, Inc., Willston, VT, USA). The SN was outlined under 2.5 × magnification, and 50% of the outlined region was analyzed using a sampling design generated with the following stereologic parameters: grid size, 200 × 200 μm; counting frame size, 150 × 150 μm; and dissector height, 14 μm.
2.4 Determination of striatal DA content
The concentration of DA in the striatal tissue was quantified by high-performance liquid chromatography (HPLC). We made coronal sections. While avoiding the ventral striatum that contains the nucleus accumbens, we selected the middle part of the striatum by dissection. Then that tissue was homogenized (10% wt/vol) by sonication in ice-cold 0.1 M perchloric acid. Homogenates were centrifuged at 10,000 g for 10 min at 4°C, and the supernatant was collected and filtered through acro-disc filters (0.25 μm; Fisher Scientific, Pittsburgh, PA, USA) and subjected to HPLC (HTEC-500; Eicom, Kyoto, Japan) with the SC-3ODS column (EICOMPAK; Eicom, Kyoto, Japan) and detected by an electrochemical detector (AD Instruments Pty Ltd., Castle Hill, NSW, Australia). The mobile phase consisted of 0.1 mM citric acid, 0.1 M sodium acetate, 220 mg/L octane sulfate sodium, 5 mg/L EDTA, and 20% methanol. The pH was adjusted to 3.5.
2.5 Fast-scan cyclic voltammetric measurement of DA signals from striatal brain slices
A combination of ketamine, xylazine, and acepromazine was used to achieve deep anesthesia before mice were decapitated and the brains were rapidly removed. Horizontal slices (350 μm) were cut on a vibratome, and they were incubated at 32 ± 0.5 °C for 30 min (Zhou, et al., 2001). Then the slices were held at room temperature for > 30 min, and they were studied at 34 ± 1 °C in artificial cerebrospinal fluid: 125 mM NaCl, 2.5 mM KCl, 1.3 mM MgCl2, 2.5 mM CaCl2, 26 mM NaHCO3, 1.25 mM NaH2PO4 and 10 mM glucose, saturated with 95% O2 and 5% CO2.
Carbon-fiber microelectrodes (10 μm diameter and approximately 100 μm exposed length; P55s, Amoco Polymers, Greenville, SC, USA) were used to perform fast-scan cyclic voltammetry within the middle portion of the dorsolateral striatum (L. Zhang, et al., 2009; Zhou, et al., 2001). The carbon-fiber microelectrode potential was linearly scanned at 10 Hz from 0 to −400 to 1000 to −400 to 0 mV against a silver/silver chloride reference electrode at a rate of 300 mV/ms. The data were acquired and analyzed using an Axopatch 200B amplifier, a Digidata1320 interface, and a pClamp 8 system (Axon Instruments Inc., Union City, CA, USA). The background current was subtracted digitally from the voltammograms, which were sampled at 50 kHz. The peak amplitude oxidation currents was at roughly 600 mV for DA, and each voltammogram was converted into a DA concentration based on a post-experimental calibration of the carbon-fiber electrode against fresh solutions of 0.5 to 10 μM DA.
A bipolar tungsten electrode was used to deliver intra-striatal stimuli. The poles of the stimulating electrode were about 150 μm away from each other, and the tip of the carbon-fiber recording microelectrode was about 200 μm away from each of the two poles of the stimulating electrode. Different stimulation protocols were used, and phasic burst stimulations were applied at an intraburst frequency of 20 Hz based on our previous in vivo unit recordings of DA neuron bursts from freely moving rats (T. Zhang, et al., 2009). Each stimulus pulse was 1 ms in duration and about 0.6 mA at constant current. Unless trains of stimuli were applied, isolated stimuli were separated by 2 min to allow recovery of the DA release.
The electrically stimulated DA response was measured as the peak amplitude (μM) or was measured as the area under the curve of DA concentration (μM-s). The phasic/tonic relative DA signal was calculated by comparing the burst evoked DA signal to the single-pulse evoked DA signal. The results are presented as the means ± SEM. Two-way ANOVA was used to judge the changes in frequency-dependent DA release between genotypes.
2.6 In vivo microdialysis and HPLC for DA quantification
Microdialysis was performed as described previously (Dong, et al., 2010; Zhang, et al., 2012). Guide cannulae (CMA/7) (CMA/Microdialysis, Solna, Sweden) were aimed at the dorsal striatum. That is, we avoided the ventral striatum containing the nucleus accumbens while placing the probe in the middle of the striatum. The probe was not in the extreme dorsal area, but rather more central in location. The stereotaxic coordinates (relative to bregma) were 0.38 mm AP, 2.0 mm LAT, and −2.5 mm DV, and the post-microdialysis anatomy found all the probes within the striatum indicated in Figure 3C (Paxinos and Franklin, 2001). We allowed 3–5 days of recovery from surgery. At least 14 h before the experiment, the probe was positioned and microdialysate buffer (149 mMNaCl, 2.8 mMKCl, 1.2 mM CaCl2, 1.2 mM MgCl2, and 0.25 mM ascorbic acid, 5.4 mM D-glucose) was perfused at 0.5 μl/min overnight and, then, 2.0 μl/min beginning at least 1 h prior to baseline sampling.
Fig. 3.

Decreased evoked DA release in striatal slices from Pitx3(−/−) mice. In horizontal brain slices, DA release was evoked by a single electrical stimulus pulse, and the extracellular DA concentration in the dorsal striatum was measured using fast-scan cyclic voltammetry. (A) The magnitude of the DA response; (B) the area under the DA concentration curve (μM× s). (C) The post-microdialysis anatomy found all the probes were within the dorsal striatum (CPu = caudate putamen) as indicated by the black bars (Paxinos and Franklin, 2001). (D) An analysis by HPLC of the microdialysis samples provided the DA concentrations of freely moving mice. * p < 0.05, ** p < 0.01 versus wild-type mice.
The DA content of microdialysates was determined by HPLC: pump (Model 582; ESA, Inc., Chelmsford, MA, USA), autosampler (Model 542; ESA, Inc.), and a HR-80 × 3.2 mm column (3-μm particle size; ESA Inc.). A coulometric cell (5014B; ESA, Inc.) was connected to an ESA Coulochem II detector. Quantification of dialysate DA concentration was estimated relative to external standards (0–2 nM). The slope and the y-intercept were calculated for the standard curve, and then the microdialysate concentration was interpolated from the regression by using the slope-intercept equation.
3. Results
3.1 Rotarod and locomotor performance of Pitx3(−/−) mice
Both rotarod performance and locomotive activities of Pitx3(−/−) mice and their wild-type littermates were evaluated. Compared with their wild-type littermates, Pitx3(−/−) mice showed a poorer rotarod performance, as shown by their reduced time on the rotarod (Fig. 1A). The time spent on the rod was 58.7% (p < 0.01, n = 6–7 for each group) less in Pitx3(−/−) than wild-type mice. In addition, the locomotive activities (total distance traveled and moving time) were also significantly decreased (Fig. 1B and 1C, p < 0.05, n = 6–7 for each group). The total distance travelled and the moving time in Pitx3(−/−) mice were 41.3% (p < 0.05) and 44.8% (p < 0.05) less than wild-type mice. Compared with the wild-type control mice, the Pitx3(−/−) mice displayed a significantly poorer locomotor performance.
Fig. 1.

Behavioral assessment of Pitx3(−/−) mice. Behavior activity was evaluated by the time the mice stayed on a rotating rod (A), total distance traveled (B), and moving time (C). Data were expressed as means ± SEM. * p < 0.05, ** p < 0.01 versus wild type.
3.2 TH-positive neurons in SNc and striatal DA levels in Pitx3(−/−) mice
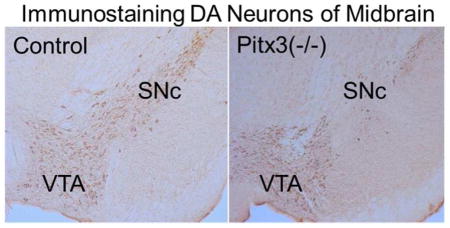
The number of TH-positive DA neurons in the SN of Pitx3(−/−) and wild-type (control) mice was determined with an unbiased stereological optical dissector using the Cavalieri principle (Pakkenberg, et al., 1991). The number of TH-positive neurons in the SNc of Pitx3(−/−) mice was significantly reduced (Fig. 2A): 470 ± 68 vs. 3462 ± 535, data from 6 Pitx3 null mice and 5 control mice, p < 0.001 (Fig. 2B). The decrease in TH-positive neurons was smaller in the VTA of these relatively young Pitx3(−/−) mice compared to controls (Fig. 2C): 3507 ± 449 vs. 4090 ± 502, data from 6 Pitx3 null mice and 5 control mice, p > 0.05.
Fig. 2.

Immunostaining and quantitative analysis of DA neurons in the midbrain. (A) Representative photomicrographs of midbrain TH immunohistochemistry (10×). (B) The relative TH immunopositive neurons in the SNc. Each value was presented as the mean ± SEM based on the number of TH immunopositive neurons relative to wild-type control mice. ** p<0.001 versus wild type. (C) The relative TH immunopositive neurons in the VTA
The main target of DA projections from the SNc is the dorsal striatum. Therefore, tissue from the central portion of the dorsal striatum was homogenized, and the concentrations of DA and its metabolites DAPOC and HAV were measured. Consistent with the TH cell counts, Pitx3(−/−) mice showed a significant decline of DA content compared with control mice (n = 5–6 mice, p < 0.05, Table 1) as shown by a decreased DA concentration and unchanged ratios of DAPOC/DA and HAV/DA. Furthermore, the 5-HT metabolism was not significantly altered (Table 1).
Table 1.
Concentration of Monoamines
| Catecholamine | Wild type (ng/mg) | Pitx3(−/−)(ng/mg) |
|---|---|---|
| DA | 6.47±0.31 | 3.58±0.29** |
| DOPAC | 1.86±0.25 | 0.98±0.31* |
| HVA | 0.89±0.09 | 0.64±0.08 |
| 5-HT | 1.19±0.21 | 1.12±0.19 |
| 5-HIAA | 0.52±0.03 | 0.42±0.03 |
p < 0.05 versus wild-type control mice
p < 0.01 versus wild-type control mice
3.3 Reduced DA release from Pitx3(−/−) mice in the striatum
Because Pitx3 is particularly important for the development of DA neurons in the SNc, we examined electrically evoked DA release in the dorsal striatum, which is innervated overwhelmingly by the SNc. In horizontal brain slices, DA release was evoked by a single electrical stimulus pulse (600 μA, 1 ms), and the real-time extracellular DA concentration in the dorsal striatum was measured using fast-scan cyclic voltammetry (L. Zhang, et al., 2009; Zhou, et al., 2001). The magnitude of the DA response (Fig. 3A) was quantified by measuring the peak amplitude (μM) and the area under the DA concentration curve (μM× s), which is plotted in Figure 3B. The mean peak amplitude of the single-pulse evoked DA signal was 92% smaller in Pitx3(−/−) mice compared to control mice: 0.09 ± 0.01 μM (n = 21) in Pitx3(−/−) mice and 1.12 ± 0.11 μM (n = 28, p < 0.001) in age-matched wild-type control mice. The area under the curve subsumes factors arising from the amplitude of the DA release and the rate of DA removal by diffusion and DA transporter (DAT) reuptake (Schmitz, et al., 2003; L. Zhang, et al., 2009). The DA signal, as measured by the area-under-curve, was also significantly different between the genotypes (Fig. 3B). This result indicates that the removal of DA from the extracellular space did not sufficiently compensate for the decreased release in the Pitx3(−/−) mice.
The cyclic voltammetry measurements (including Fig. 3A,B) examine only the evoked DA release exclusively in the DA target area, the dorsal striatum. To examine the overall function of the intact DA system projection from the midbrain SNc to the middle of striatum (within the dorsal striatum), we measured the basal DA concentration using in vivo microdialysis in freely moving mice. The range of the placement of the microdialysis probes within the dorsal striatum is indicated in Figure 3C (black bars). Although the basal DA concentration was significantly different (Fig. 3D) between the wild-type control mice (4.0 ± 0.6 nM, n = 7) and the Pitx3(−/−) mice (2.2 ± 0.4 nM, n = 8, p < 0.05), the difference was not as great as that seen when measuring evoked DA release with voltammetry (Fig. 3B). This difference, between Figure 3B and 3D, may arise in part because the microdialysis probe sampled a much broader area, including more ventral portions of the dorsal striatum where DA release is not as strongly influenced by the Pitx3 genotype. To estimate the apparent concentration of DA in the extracellular space, the no-net-flux method of quantitative microdialysis was applied (Justice, 1993). This background concentration of extracellular DA was again smaller in the Pitx3 deficiency mice: 19.7 ± 0.7 nM, (n = 7, p < 0.05) in the Pitx3(−/−) mice and 27.1 ± 0.5 nM in the wild-type control mice. The results indicated decreased DA signaling to the dorsal striatum in Pitx3 null mice.
3.4 Tonic and phasic DA signaling in Pitx3(−/−) and wild-type mice in the dorsal striatum
Although the DA release in the Pitx3(−/−) mice is severely impaired in the dorsal striatum to a 1-pulse stimulus, DA release also responds biologically to phasic bursts. Therefore, we examined the phasic versus tonic DA release by providing isolated 1-pulse stimuli or 5-pulses at 20 Hz to mimic a phasic burst. The burst frequency was applied at 20 Hz to match the approximate average burst frequency we have previously measured in freely moving rodents (T. Zhang, et al., 2009). In this case, the 1-pulse and 5-pulse bursts were applied in isolation, separating the individual stimuli by 2 min. For the control case (Fig. 4A, Control), the phasic burst causes a slightly larger DA release than the single pulse, consistent with previous results in the dorsal striatum (L. Zhang, et al., 2009). In the Pitx3(−/−) mice, the phasic 5-pulse stimulation causes a relatively larger increase in the DA release. This increase in phasic release relative to the single pulse can be seen by normalizing the Pitx3 1-pulse DA release to the DA release produced in the control case (Fig. 4B). When the ratio of phasic to 1-pulse DA release are compared for the control and the Pitx3(−/−) case, the ratio is significantly larger (p < 0.01) in the Pitx3 case (Fig. 4B, C).
Fig. 4.

Tonic and phasic DA signaling in Pitx3(−/−) and wild-type mice in the dorsal striatum. (A) Examples of a single stimulus (1p, solid traces) and a 20 Hz, 5-pulse burst stimulus (5p, dashed traces) are shown for a wild-type (Control) and Pitx3 null mouse. (B) The traces for the Pitx3 null mouse (right traces of panel A) are normalized to the amplitude of the control (left traces of panel A) to reveal the greater relative phasic DA release in Pitx3 nulls. (C) The averaged data for the normalized ratio of phasic to 1p DA release. * p < 0.05, ** p < 0.01 versus wild type.
To more closely approximate the biological condition, the phasic bursts have to be applied along with ongoing tonic activity (Exley and Cragg, 2008; L. Zhang, et al., 2009). Rodent DA neurons fire at an average rate of about 4 Hz (Clark and Chiodo, 1988; Grace and Bunney, 1984; Hyland, et al., 2002; T. Zhang, et al., 2009). The firing activity includes background tonic activity with superimposed phasic bursts that are thought to represent salient events encountered in the environment. To explore how the loss of Pitx3 influences tonic versus phasic DA release under more biologically relevant conditions, we applied various stimulus trains and measured DA signals using fast-scan cyclic voltammetry. To mimic background tonic signaling, we applied stimuli at 2.5 Hz, and we represented phasic signaling by including bursts of 3 and 5 pulses at 20 Hz. The average of the stimulus train was 4 Hz to match the average firing observed in vivo, and the burst frequency was applied at 20 Hz to match the approximate average burst frequency we have measured in freely moving rodents (T. Zhang, et al., 2009).
The actual stimulus train (Fig. 5) was a 2.5 Hz tonic train that was allowed to reach pseudo steady state before we measured the DA signal arising from 4-pulses at 2.5 Hz (Fig. 5A–D). Then, the train included a 3-pulse burst, 2 tonic pulses, a 5-pulse burst, ending with 2 tonic stimulus pulses (Fig. 5A–D). An example recording was shown of the DA release recorded from a striatal slice taken from a control (Fig. 5A) and a Pitx3(−/−) (Fig. 5B) mouse, and the averaged data with indicated SEM are shown below (Fig. 5C,D). In both the control (Fig. 5A,C) and the Pitx3(−/−) (Fig. 5B,D), the phasic bursts increased DA release beyond the tonic DA concentration plateau. The phasic bursts, however, were more effective in elevating the DA release from the Pitx3(−/−) tissue relative to the tonic background. As the applied phasic bursts became longer (i.e., 5-pulse burst), the DA signal from the Pitx3(−/−) approached that seen in the wild-type control striatal slices (Fig. 5E). With tonic stimulation (2.5 Hz), the DA signal in Pitx3(−/−) was about 40% of the control, but during the 5-pulse phasic burst, the DA signal in Pitx3(−/−) was about 75% of the control (Fig. 5E).
Fig. 5.

Application of stimulus trains to measure DA release under more realistic biological activity using fast-scan cyclic voltammetry. (A–D) The stimulus train was a 2.5 Hz tonic train that was allowed to reach pseudo steady state before we began recording the DA signal arising from 4-pulses at 2.5 Hz, a 3-pulse burst, 3 single stimuli, 5-pulse burst, and 2 single stimuli. These stimulus trains are indicated under each recording: (A) example control, wild-type mouse, (B) example Pitx3(−/−) mouse, (C) averaged control, (D) averaged Pitx3(−/−). The SEMs are indicated by the line grey traces that mirror the dark average traces in (C) and (D). (E) The area under the curve is plotted for the single stimuli (1p), for the 3-pulse burst (3p), and for the 5-pulse burst (5p).
3.5 DA signal changes in the ventral striatum of Pitx3 null mice
The Pitx3(−/−) mice have the most severe DA neuron loss in the SNc, which projects much more strongly to the dorsal than ventral striatum (van Domburg and ten Donkelaar, 1991; Zhou, et al., 2002). However, the DA projections to the ventral striatum also are compromised, and we examined DA release in the ventral striatum using fast-scan cyclic voltammetry (Fig. 6). The magnitude of the DA response to a 1-pulse stimulus (Fig. 6A) was quantified by measuring the peak amplitude (μM): 0.25 ± 0.05μM (n = 21) in Pitx3 −/− mice and 0.39 ± 0.05μM (n = 8, p < 0.05) in control mice. We also measured the area under the DA concentration curve (μM x s), which is plotted in Figure 6B. The DA signal was smaller in ventral striatum from the Pitx3(−/−) mice, 60% of the control based on the area under the DA curve (Fig. 6B), but the decrease was not as large as observed in the dorsal striatum, which was 10% of the dorsal striatum control (Fig. 3B).
Fig. 6.

DA signal changes in the ventral striatum of Pitx3 null mice. The DA release in the ventral striatum was determined using fast-scan cyclic voltammetry. (A) Example traces showing the magnitude of the DA response to a 1-pulse stimulus from a Pitx3−/− slice (black trace) or from a wild-type slice (Control, grey trace). (B) The area under the DA concentration curve (μM× s) is plotted for control and Pitx3(−/−). (C–D) Using the same stimulus train (indicated below the traces) as was used for the dorsal striatum, here the average data from the ventral striatum are shown with SEM indicated.
To examine how the loss of Pitx3 influences tonic versus phasic DA release in the ventral striatum under more biologically relevant conditions, we applied the same stimulus train used to study the dorsal striatum. We applied stimuli at 2.5 Hz, and we represented phasic signaling by including bursts of 3 and 5 pulses at 20 Hz (Fig. 6C,D). The averaged recordings (Fig. 6C,D) with indicated SEM show that the DA signal is smaller in the Pitx3(−/−) mice. The results quantitatively differed between the ventral and dorsal striatum. With tonic stimulation (2.5 Hz), the ventral striatum DA signal in Pitx3(−/−) was about 63% of the control (Fig. 6C,D). During the 5-pulse phasic burst, the ventral DA signal in Pitx3(−/−) was about 61% of the control (Fig. 6C,D). The results indicate that with this stimulation pattern both tonic and phasic DA release are comparably decreased in the ventral striatum of Pitx3(−/−) mice.
4. Discussion
We found that Pitx3-null mice (3–5 months of age) show loss of TH expression associated with the loss of midbrain DA neurons. This decline was also observed as decreased striatal DA release and abnormal motor activities, suggesting that Pitx3 expression is critical for the health and functions of adult midbrain DA neurons. Previous studies have indicated that Pitx3-null mice have selective loss of A9 DA neurons in the midbrain and have shown impaired performance on motor coordination tasks (Hwang, et al., 2003; Nunes, et al., 2003). In this study, we also found decreased locomotor activities and impaired motor coordination compared to wild-type control mice. We also documented a striking decrease of DA neuron numbers in the SNc but only a slight decrease in the VTA in the Pitx3-null mice. The greater sensitivity and smaller sampling area of the carbon fiber fast-scan cyclic voltammetry measurements indicated decreased DA release was much more severe in the dorsal striatum, which is innervated mainly by the SNc. However, there was still a significant decrease in evoked DA release in the ventral striatum, which receives the vast major of its innervation from the VTA. These data support the notion that Pitx3 selectively controls proper development and maintenance of midbrain DA neurons, and those effects are seen most potently in the A9 DA neurons and the nigrostriatal pathway.
The quantitative differences in DA release between the dorsal and ventral striatum arising from innervation mainly from the SNc and VTA (respectively) may contribute to the quantitative differences measured with carbon-fiber voltammetry (Fig. 3B) versus microdialysis (Fig. 3D). These two approaches measure different aspects of DA release and, thus, should not be expected to show quantitatively identical results. Among their differences is that carbon-fibers are small and sample from a volume in the tens of μm (per side) range while microdialysis samples from a volume in the hundreds of μm (per side) range. That quantitative difference in DA release (between Fig 3B and 3D) may arise in part because the microdialysis probe samples a wider volume that will average the middle of the striatum, including the more ventral portions. Those more ventral areas of the striatum are expected to have a smaller decrease in DA signaling (arising from the Pitx3 −/− genotype) owing to a less severe loss of DA neurons in the VTA versus the SNc (Fig. 2). Thus, the Pitx3 −/− genotype is expected to show a gradient influence of DA release with the greatest decrease in DA release observed in the most dorsal extremes.
The development and function of midbrain DA neurons requires complex changes in transcriptional processes regulating gene expression (van den Munckhof, et al., 2003). Pitx3 may play roles in these transcriptional regulatory events, thereby, supporting mechanisms for changes in transcription during the development and function of midbrain DA neurons. The proper functioning of transcription factors requires the appropriate timing and dosage of activity (Smidt et al., 1997). For example, the successful generation of DA neurons from mouse embryonic stem cells using a Nestin-enhancer-Lmx1a construct suggests that precise dosage and timing of Lmx1a are essential for the differentiation of DA neurons from immature cells (Andersson, et al., 2006). The present study highlights the importance of the transcription factor, Pitx3, for the health and function of DA neurons.
Although there is some controversy, there is evidence that Pitx3 is involved in neurodegenerative diseases and, thereby, potentially provides a target for therapeutic strategies. Pitx3 genetic variants have been identified in PD patients in several reports (Bergman, et al., 2010; Fuchs, et al., 2009; Gui, et al., 2012; Le, et al., 2011; Liu, et al., 2011), but not in all studies (Cai, et al., 2011). In general, functional studies and some genetic analysis suggest the Pitx3-based transcriptional network and its regulation of the nigral DA neurons may contribute to neuronal development and survival. Those Pitx3-involved molecular mechanisms likewise may provide new therapeutic targets to slow or avert the degenerative decline of DA neurons during PD for a small subset of patients.
Highlights.
Pitx3 null mice have decreased midbrain dopamine neurons particularly in the SNc
Pitx3(−/−) mice have highly significant reduction of striatal dopamine release
Tonic DA release impaired more than phasic DA release induced by burst activity
Pitx3(−/−) mice have impaired motor coordination and decreased locomotion
Acknowledgments
This work was supported by grants from the National Institutes of Health: NINDS NS21229 and NIDA DA09411.
Footnotes
Disclosure Statement
There were no conflicts of interest for this study for any of the authors. The animal procedures were appropriate, and the mice were housed and handled in accordance with the guidelines set forth by the animal care committee at Baylor College of Medicine.
Publisher's Disclaimer: This is a PDF file of an unedited manuscript that has been accepted for publication. As a service to our customers we are providing this early version of the manuscript. The manuscript will undergo copyediting, typesetting, and review of the resulting proof before it is published in its final citable form. Please note that during the production process errors may be discovered which could affect the content, and all legal disclaimers that apply to the journal pertain.
References
- Andersson E, Tryggvason U, Deng Q, Friling S, Alekseenko Z, Robert B, Perlmann T, Ericson J. Identification of intrinsic determinants of midbrain dopamine neurons. Cell. 2006;124(2):393–405. doi: 10.1016/j.cell.2005.10.037. [DOI] [PubMed] [Google Scholar]
- Baffi JS, Palkovits M, Castillo SO, Mezey E, Nikodem VM. Differential expression of tyrosine hydroxylase in catecholaminergic neurons of neonatal wild-type and Nurr1-deficient mice. Neuroscience. 1999;93(2):631–42. doi: 10.1016/s0306-4522(99)00124-4. [DOI] [PubMed] [Google Scholar]
- Bergman O, Hakansson A, Westberg L, Nordenstrom K, Carmine Belin A, Sydow O, Olson L, Holmberg B, Eriksson E, Nissbrandt H. PITX3 polymorphism is associated with early onset Parkinson’s disease. Neurobiol Aging. 2010;31(1):114–7. doi: 10.1016/j.neurobiolaging.2008.03.008. [DOI] [PubMed] [Google Scholar]
- Braak H, Del Tredici K, Rub U, de Vos RA, Jansen Steur EN, Braak E. Staging of brain pathology related to sporadic Parkinson’s disease. Neurobiol Aging. 2003;24(2):197–211. doi: 10.1016/s0197-4580(02)00065-9. [DOI] [PubMed] [Google Scholar]
- Cai Y, Ding H, Gu Z, Baskys A, Ma J, Chan P. PITX3 polymorphism is not associated with Parkinson’s disease in a Chinese population. Neurosci Lett. 2011;505(3):260–2. doi: 10.1016/j.neulet.2011.10.034. [DOI] [PubMed] [Google Scholar]
- Clark D, Chiodo LA. Electrophysiological and pharmacological characterization of identified nigrostriatal and mesoaccumbens dopamine neurons in the rat. Synapse. 1988;2(5):474–85. doi: 10.1002/syn.890020503. [DOI] [PubMed] [Google Scholar]
- Dong Y, Zhang T, Li W, Doyon WM, Dani JA. Route of nicotine administration influences in vivo dopamine neuron activity: habituation, needle injection, and cannula infusion. J Mol Neurosci. 2010;40(1–2):164–71. doi: 10.1007/s12031-009-9231-6. [DOI] [PMC free article] [PubMed] [Google Scholar]
- Eells JB, Rives JE, Yeung SK, Nikodem VM. In vitro regulated expression of tyrosine hydroxylase in ventral midbrain neurons from Nurr1-null mouse pups. J Neurosci Res. 2001;64(4):322–30. doi: 10.1002/jnr.1082. [DOI] [PubMed] [Google Scholar]
- Exley R, Cragg SJ. Presynaptic nicotinic receptors: a dynamic and diverse cholinergic filter of striatal dopamine neurotransmission. British journal of pharmacology. 2008;153(Suppl 1):S283–97. doi: 10.1038/sj.bjp.0707510. [DOI] [PMC free article] [PubMed] [Google Scholar]
- Fuchs J, Mueller JC, Lichtner P, Schulte C, Munz M, Berg D, Wullner U, Illig T, Sharma M, Gasser T. The transcription factor PITX3 is associated with sporadic Parkinson’s disease. Neurobiol Aging. 2009;30(5):731–8. doi: 10.1016/j.neurobiolaging.2007.08.014. [DOI] [PubMed] [Google Scholar]
- Grace AA, Bunney BS. The control of firing pattern in nigral dopamine neurons: single spike firing. J Neurosci. 1984;4(11):2866–76. doi: 10.1523/JNEUROSCI.04-11-02866.1984. [DOI] [PMC free article] [PubMed] [Google Scholar]
- Gui Y, Zhao Y, Liu H, Fu J, Xu Z, Hu X. A novel synonymous SNP in PITX3 is associated with Parkinson’s disease in Chinese population. Swiss Med Wkly. 2012;142:w13521. doi: 10.4414/smw.2012.13521. [DOI] [PubMed] [Google Scholar]
- Hwang DY, Ardayfio P, Kang UJ, Semina EV, Kim KS. Selective loss of dopaminergic neurons in the substantia nigra of Pitx3-deficient aphakia mice. Brain Res Mol Brain Res. 2003;114(2):123–31. doi: 10.1016/s0169-328x(03)00162-1. [DOI] [PubMed] [Google Scholar]
- Hyland BI, Reynolds JN, Hay J, Perk CG, Miller R. Firing modes of midbrain dopamine cells in the freely moving rat. Neuroscience. 2002;114(2):475–92. doi: 10.1016/s0306-4522(02)00267-1. [DOI] [PubMed] [Google Scholar]
- Jellinger KA. Neuropathology of sporadic Parkinson’s disease: evaluation and changes of concepts. Mov Disord. 2012;27(1):8–30. doi: 10.1002/mds.23795. [DOI] [PubMed] [Google Scholar]
- Justice JB., Jr Quantitative microdialysis of neurotransmitters. J Neurosci Methods. 1993;48(3):263–76. doi: 10.1016/0165-0270(93)90097-b. [DOI] [PubMed] [Google Scholar]
- Kim H, Quan X, Seong Y, Kim J. Impaired motor coordination in Pitx3 overexpression mice. Biochem Biophys Res Commun. 2014;446(4):1211–8. doi: 10.1016/j.bbrc.2014.03.085. [DOI] [PubMed] [Google Scholar]
- Kim KS, Kim CH, Hwang DY, Seo H, Chung S, Hong SJ, Lim JK, Anderson T, Isacson O. Orphan nuclear receptor Nurr1 directly transactivates the promoter activity of the tyrosine hydroxylase gene in a cell-specific manner. J Neurochem. 2003;85(3):622–34. doi: 10.1046/j.1471-4159.2003.01671.x. [DOI] [PubMed] [Google Scholar]
- Le W, Conneely OM, Zou L, He Y, Saucedo-Cardenas O, Jankovic J, Mosier DR, Appel SH. Selective agenesis of mesencephalic dopaminergic neurons in Nurr1-deficient mice. Exp Neurol. 1999;159(2):451–8. doi: 10.1006/exnr.1999.7191. [DOI] [PubMed] [Google Scholar]
- Le W, Nguyen D, Lin XW, Rawal P, Huang M, Ding Y, Xie W, Deng H, Jankovic J. Transcription factor PITX3 gene in Parkinson’s disease. Neurobiol Aging. 2011;32(4):750–3. doi: 10.1016/j.neurobiolaging.2009.03.015. [DOI] [PubMed] [Google Scholar]
- Li J, Dani JA, Le W. The role of transcription factor Pitx3 in dopamine neuron development and Parkinson’s disease. Curr Top Med Chem. 2009;9(10):855–9. [PMC free article] [PubMed] [Google Scholar]
- Liu J, Sun QY, Tang BS, Hu L, Yu RH, Wang L, Shi CH, Yan XX, Pan Q, Xia K, Guo JF. PITX3 gene polymorphism is associated with Parkinson’s disease in Chinese population. Brain Res. 2011;1392:116–20. doi: 10.1016/j.brainres.2011.03.064. [DOI] [PubMed] [Google Scholar]
- Maxwell SL, Ho HY, Kuehner E, Zhao S, Li M. Pitx3 regulates tyrosine hydroxylase expression in the substantia nigra and identifies a subgroup of mesencephalic dopaminergic progenitor neurons during mouse development. Dev Biol. 2005;282(2):467–79. doi: 10.1016/j.ydbio.2005.03.028. [DOI] [PubMed] [Google Scholar]
- Nunes I, Tovmasian LT, Silva RM, Burke RE, Goff SP. Pitx3 is required for development of substantia nigra dopaminergic neurons. Proc Natl Acad Sci U S A. 2003;100(7):4245–50. doi: 10.1073/pnas.0230529100. [DOI] [PMC free article] [PubMed] [Google Scholar]
- Pakkenberg B, Moller A, Gundersen HJ, Mouritzen Dam A, Pakkenberg H. The absolute number of nerve cells in substantia nigra in normal subjects and in patients with Parkinson’s disease estimated with an unbiased stereological method. J Neurol Neurosurg Psychiatry. 1991;54(1):30–3. doi: 10.1136/jnnp.54.1.30. [DOI] [PMC free article] [PubMed] [Google Scholar]
- Paxinos G, Franklin KBJ. The Mouse Brain in Stereotaxic Coordinates. 2. Academic Press, Elsevier Science; USA: 2001. [Google Scholar]
- Peng C, Aron L, Klein R, Li M, Wurst W, Prakash N, Le W. Pitx3 is a critical mediator of GDNF-induced BDNF expression in nigrostriatal dopaminergic neurons. J Neurosci. 2011;31(36):12802–15. doi: 10.1523/JNEUROSCI.0898-11.2011. [DOI] [PMC free article] [PubMed] [Google Scholar]
- Peng C, Fan S, Li X, Fan X, Ming M, Sun Z, Le W. Overexpression of pitx3 upregulates expression of BDNF and GDNF in SH-SY5Y cells and primary ventral mesencephalic cultures. FEBS Lett. 2007;581(7):1357–61. doi: 10.1016/j.febslet.2007.02.054. [DOI] [PubMed] [Google Scholar]
- Sakurada K, Ohshima-Sakurada M, Palmer TD, Gage FH. Nurr1, an orphan nuclear receptor, is a transcriptional activator of endogenous tyrosine hydroxylase in neural progenitor cells derived from the adult brain. Development. 1999;126(18):4017–26. doi: 10.1242/dev.126.18.4017. [DOI] [PubMed] [Google Scholar]
- Schmitz Y, Benoit-Marand M, Gonon F, Sulzer D. Presynaptic regulation of dopaminergic neurotransmission. J Neurochem. 2003;87(2):273–89. doi: 10.1046/j.1471-4159.2003.02050.x. [DOI] [PubMed] [Google Scholar]
- Simon HH, Bhatt L, Gherbassi D, Sgado P, Alberi L. Midbrain dopaminergic neurons: determination of their developmental fate by transcription factors. Ann N Y Acad Sci. 2003;991:36–47. [PubMed] [Google Scholar]
- Smidt MP, Asbreuk CH, Cox JJ, Chen H, Johnson RL, Burbach JP. A second independent pathway for development of mesencephalic dopaminergic neurons requires Lmx1b. Nat Neurosci. 2000;3(4):337–41. doi: 10.1038/73902. [DOI] [PubMed] [Google Scholar]
- Smidt MP, Smits SM, Bouwmeester H, Hamers FP, van der Linden AJ, Hellemons AJ, Graw J, Burbach JP. Early developmental failure of substantia nigra dopamine neurons in mice lacking the homeodomain gene Pitx3. Development. 2004;131(5):1145–55. doi: 10.1242/dev.01022. [DOI] [PubMed] [Google Scholar]
- Smidt MP, van Schaick HS, Lanctot C, Tremblay JJ, Cox JJ, van der Kleij AA, Wolterink G, Drouin J, Burbach JP. A homeodomain gene Ptx3 has highly restricted brain expression in mesencephalic dopaminergic neurons. Proc Natl Acad Sci U S A. 1997;94(24):13305–10. doi: 10.1073/pnas.94.24.13305. [DOI] [PMC free article] [PubMed] [Google Scholar]
- van den Munckhof P, Luk KC, Ste-Marie L, Montgomery J, Blanchet PJ, Sadikot AF, Drouin J. Pitx3 is required for motor activity and for survival of a subset of midbrain dopaminergic neurons. Development. 2003;130(11):2535–42. doi: 10.1242/dev.00464. [DOI] [PubMed] [Google Scholar]
- van Domburg PH, ten Donkelaar HJ. The human substantia nigra and ventral tegmental area. A neuroanatomical study with notes on aging and aging diseases. Adv Anat Embryol Cell Biol. 1991;121:1–132. [PubMed] [Google Scholar]
- Wallen A, Perlmann T. Transcriptional control of dopamine neuron development. Ann N Y Acad Sci. 2003;991:48–60. doi: 10.1111/j.1749-6632.2003.tb07462.x. [DOI] [PubMed] [Google Scholar]
- Yang D, Peng C, Li X, Fan X, Li L, Ming M, Chen S, Le W. Pitx3-transfected astrocytes secrete brain-derived neurotrophic factor and glial cell line-derived neurotrophic factor and protect dopamine neurons in mesencephalon cultures. J Neurosci Res. 2008;86(15):3393–400. doi: 10.1002/jnr.21774. [DOI] [PubMed] [Google Scholar]
- Zhang L, Doyon WM, Clark JJ, Phillips PE, Dani JA. Controls of tonic and phasic dopamine transmission in the dorsal and ventral striatum. Molecular pharmacology. 2009;76(2):396–404. doi: 10.1124/mol.109.056317. [DOI] [PMC free article] [PubMed] [Google Scholar]
- Zhang L, Le W, Xie W, Dani JA. Age-related changes in dopamine signaling in Nurr1 deficient mice as a model of Parkinson’s disease. Neurobiol Aging. 2012;33(5):1001 e7–16. doi: 10.1016/j.neurobiolaging.2011.03.022. [DOI] [PMC free article] [PubMed] [Google Scholar]
- Zhang T, Zhang L, Liang Y, Siapas AG, Zhou FM, Dani JA. Dopamine signaling differences in the nucleus accumbens and dorsal striatum exploited by nicotine. The Journal of neuroscience: the official journal of the Society for Neuroscience. 2009;29(13):4035–43. doi: 10.1523/JNEUROSCI.0261-09.2009. [DOI] [PMC free article] [PubMed] [Google Scholar]
- Zhao S, Maxwell S, Jimenez-Beristain A, Vives J, Kuehner E, Zhao J, O’Brien C, de Felipe C, Semina E, Li M. Generation of embryonic stem cells and transgenic mice expressing green fluorescence protein in midbrain dopaminergic neurons. Eur J Neurosci. 2004;19(5):1133–40. doi: 10.1111/j.1460-9568.2004.03206.x. [DOI] [PubMed] [Google Scholar]
- Zhou FM, Liang Y, Dani JA. Endogenous nicotinic cholinergic activity regulates dopamine release in the striatum. Nature neuroscience. 2001;4(12):1224–9. doi: 10.1038/nn769. [DOI] [PubMed] [Google Scholar]
- Zhou FM, Wilson CJ, Dani JA. Cholinergic interneuron characteristics and nicotinic properties in the striatum. J Neurobiol. 2002;53(4):590–605. doi: 10.1002/neu.10150. [DOI] [PubMed] [Google Scholar]