

Abstract
Introduction
Perivascular soft tissue tumors are relatively uncommon neoplasms of unclear line of differentiation, although most are presumed to originate from pericytes or modified perivascular cells. Among these, glomus tumor, myopericytoma, and angioleiomyoma share a spectrum of histologic findings and a perivascular growth pattern. In contrast, solitary fibrous tumor (previously termed hemangiopericytoma) was once hypothesized to have pericytic differentiation.
Methods
Here, we systematically examine pericyte immunohistochemical markers among glomus tumor (including malignant glomus tumor), myopericytoma, angioleiomyoma, and solitary fibrous tumor. Immunohistochemical staining and semiquantification was performed using well-defined pericyte antigens, including αSMA, CD146, and PDGFRβ.
Results
Glomus tumor and myopericytoma demonstrate diffuse staining for all pericyte markers, including immunohistochemical reactivity for αSMA, CD146, and PDGFRβ. Malignant glomus tumors all showed some degree of pericyte marker immunoreactivity, although it was significantly reduced. Angioleiomyoma shared a similar αSMA + CD146 + PDGFRβ+ immunophenotype; however, this was predominantly seen in the areas of perivascular tumor growth. Solitary fibrous tumors showed patchy PDGFRβ immunoreactivity only.
Discussion
In summary, pericyte marker expression is a ubiquitous finding in glomus tumor, myopericytoma, and angioleiomyoma. Malignant glomus tumor shows a comparative reduction in pericyte marker expression, which may represent partial loss of pericytic differentiation. Pericyte markers are essentially not seen in solitary fibrous tumor. The combination of αSMA, CD146, and PDGFRβ immunohistochemical stainings may be of utility for the evaluation of pericytic differentiation in soft tissue tumors.
Keywords: glomus tumor, myopericytoma, angioleiomyoma, solitary fibrous tumor, hemangiopericytoma, pericyte, CD146, PDGFRB, Mel-CAM, platelet-derived growth factor receptor
Introduction
Perivascular soft tissue tumors are relatively uncommon neoplasms of unclear line of differentiation, although most are presumed to originate from pericytes or a modified perivascular cell. Among these, glomus tumor, myopericytoma, and angioleiomyoma share a spectrum of histologic findings, including a perivascular growth pattern. Glomus tumor is a subcutaneous and soft tissue neoplasm with histological resemblance to the thermoregulatory glomus body.1 Glomus tumors are most common on the digits and have been recently found to have a recurrent MIR143– NOTCH fusion gene.2 Myopericytoma bears some histologic resemblance to glomus tumor but is most common on the lower extremities and is composed of eosinophilic tumor cells with more clear smooth muscle differentiation and a whorled perivascular pattern.3 Angioleiomyoma generally presents as a painful subcutaneous nodule, with a histological appearance of more differentiated smooth muscle cells, arranged in perivascular, fascicular, or cavernous growth patterns. Notably, there is well-recognized histologic overlap between these 3 tumors, leading some to use hybrid terms such as “glomangiopericytoma” and “glomangiomyoma.”4,5 Immunohistochemical staining patterns across glomus tumor, myopericytoma, and angioleiomyoma are relatively similar, although nonspecific, and include diffuse α-smooth muscle actin (αSMA) positivity, muscle specific actin, and h-caldesmon. Other immunohistochemical markers are occasionally positive including Desmin, CD34, and Calponin.6,7 Despite the well-described histopathologic features of these perivascular soft tissue tumors, a definitive line of differentiation has not yet been established.
Pericytes are mesenchymal cells that closely enwrap small blood vessels, regulating and supporting the microvasculature through direct contact with the endothelium. Pericytes demonstrate a distinct immunohistochemical profile, including expression of αSMA, CD146, and PDGFRβ, without endothelial differentiation (CD31, CD34).8,9 h-Caldesmon is expressed in vascular and vis- ceral smooth muscle cells and may be expressed in a sub- set of pericytes.10,11 Several lines of evidence have supported pericytic differentiation in glomus tumor, myopericytoma, and angioleiomyoma. First, the striking perivascular distribution of tumor cells first led to the hypothetical link to pericytes. Next, diffuse immunoreactivity of these perivascular tumors to αSMA, MSA, and vimentin further solidified a pericytic identity, although highly nonspecific.12-14 Finally, ultrastructural examination by transmission electron microscopy has suggested either a modified pericyte or smooth muscle phenotype in glomus tumor,15-17 myopericytoma,18 and angioleiomyoma.19 However, a definite pericytic line of differentiation has remained undetermined across this spectrum of related tumors.
Given the recent, expansive increase in knowledge regarding new immunohistochemical markers for pericytes, we sought to evaluate pericytic marker expression in perivascular soft tissue tumors. In the present study, convincing evidence of pericytic differentiation was observed in a spectrum of soft tissue tumors, including glomus tumor, myopericytoma, and angioleiomyoma. A relative reduction in pericyte marker expression was observed among malignant glomus tumors, suggestive of partial loss of pericytic differentiation. Moreover, pericytic differentiation was not observed in solitary fibrous tumor/hemangiopericytoma, once hypothesized to have pericyte origins.
Materials and Methods
Histology and Immunohistochemistry
Tumors were identified using a retrospective chart review of the pathology tissue archives of the Department of Pathology and Laboratory Medicine at the University of California, Los Angeles (UCLA), using the search terms “glomus tumor,” “myopericytoma,” “angioleiomyoma,” and “solitary fibrous tumor.” Slides were reviewed by 2 independent pathologists to ensure accuracy of diagnosis (SMD and AWJ). Diagnostic criteria for malignancy in glomus tumors were used as described by Folpe and colleagues,20,21 including deep-seated tumors greater than 2 cm, tumors with atypical mitotic figures, or tumors with moderate to high nuclear grade and >5 mitotic figures in 50 HPF. Patient information was obtained, including age, sex, tumor location, tumor size, and previous immunohistochemical stains performed during the initial diagnostic evaluation. Formalin-fixed paraffinembedded (FFPE) tumor tissue from patients were acquired from the tissue archives, under UCLA IRB approval # 13-000918.
Immunohistochemistry for pericyte markers was performed using the ABC method (Vectastain Elite ABC, Vector Laboratories, Burlingame, CA) using DAB as the chromogen (ImmPACT DAB, Vector Laboratories). Multiple antigens were detected by multiplexing the ABC method and DAB chromogen with an alkaline phosphatase polymer detection method (ImmPress-AP Polymer Detection, Anti-mouse IG, Vector Laboratories) and Vector Red chromogen (Vector Red Alkaline Phosphatase Substrate, Vector Laboratories).
The following primary antibodies were used: monoclonal rabbit anti-CD146 (1/500, EPR3208, ABCAM, Cambridge, MA), polyclonal rabbit anti-CD31 (1/100, XX, ABCAM), monoclonal mouse anti-αSMA (1/75 [1A4], ABCAM), monoclonal rabbit anti-PDGFRβ (1/100 [2E8E1], Cell Signaling Technologies, Beverly, MA), monoclonal mouse anti-CD34 (1/50 [QBEnd 10], Dako North America, Inc, Carpinteria, CA), monoclonal mouse anti-CD31 (1/100 [89C2], Cell Signaling Technologies), and monoclonal mouse anti-h-caldesmon (1/200 [h-CALD], ABCAM). The following secondary antibodies were used: polyclonal goat biotinylated anti-rabbit IgG (1/500, Sigma, St Louis, MO), polyclonal horse anti- mouse IgG (1/500 [H + L], Vector Laboratories), and polyclonal goat anti-rat Ig (1/500, Becton Dickinson and Company, Franklin Lakes, NJ).
Heat-mediated antigen retrieval was performed for all immunohistochemical stains in 1 mM Tris– EDTA, 0.01% Tween-20 (Sigma), pH 8. Nonspecific antibody binding was blocked (IHC-TEK Antibody Diluent, pH 7.4, IHC World, LLC, Woodstock, MD). Endogenous peroxidase and alkaline phosphatase blocking solution was used (BLOXALL Endogenous Peroxidase and Alkaline Phosphatase Blocking Solution, Vector Laboratories). Mayer's hematoxylin was used as a nuclear counterstain (1/5, ABCAM) and slides were mounted using an aqueous media (VectaMount AQ, Vector Laboratories).
Immunohistochemical Semiquantitation
Semiquantitative grading of immunohistochemical stains was performed with some modification of previous protocols by 3 blinded independent observers.22 Intensity of staining was graded on a 3-point scale (0-3+), defined as follows: 0, absent stain; 1+, weak, focal cytoplasmic staining or weak, noncontiguous membranous staining; 2+, moderate, focal to diffuse cytoplasmic staining or moderate, partially contiguous membranous staining; 3+, strong, diffuse cytoplasmic staining or strong, contiguous membranous staining. In cases of disagreement between observers, tumor staining was reevaluated by the same observers and the majority opinion was selected. In addition, the percentage of tumor cells stained was also evaluated, using a 5% incremental scale, and averages between observers were calculated. Statistical analysis of semiquantitation was performed when appropriate, using a 2-sample Wilcoxon rank-sum (Mann–Whitney) test, using STATA. P < .05 was considered significant.
Results
Pericytic Immunophenotype of Glomus Tumor
Glomus tumors (N = 9) were located on fingers, and ranged in size from 0.4 to 1.2 cm. Histologically, all tumors showed characteristic features of glomus tumor, including a proliferation of small, uniform, rounded glomus cells with a centrally placed, round nucleus and amphophilic to lightly eosinophilic cytoplasm. Tumors showed both solid and glomuvenous growth patterns. Clinical immunohistochemical stains included diffuse immunoreactivity for muscle-specific actin (MSA; 4/4 cases). All tumors were negative for epithelial markers (pan-keratin, EMA), melanocytic markers (S100, HMB45), and desmin when examined.
Pericytic markers were examined across all glomus tumor specimens, revealing a consistent staining pattern (Figure 1). Diffuse immunoreactivity was noted for αSMA, CD146, and PDGFRβ, observed both in solid growth patterns (Figure 1A-G) and those tumors with a glomuvenous growth pattern (Figure 1H-J). More variable and patchy immunoreactivity for h-caldesmon was observed. Next, semiquantitation of immunohistochemical staining was performed (Table 1). Moderate to strong and diffuse immunoreactivity for αSMA, CD146, and PDGFRβ was observed in nearly all tumors examined, and without significant variation in regard to architectural pattern.
Figure 1. Pericytic immunophenotype of glomus tumor.
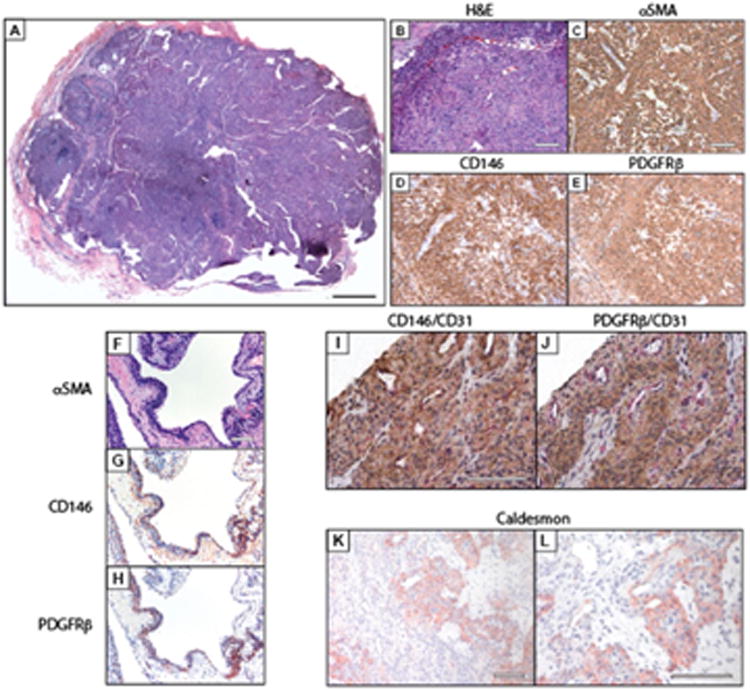
(A) Histological appearance of glomus tumor. (B-E) Pericyte markers in typical (solid) glomus tumor, including (B) hematoxylin-eosin (H&E). (C) α-smooth muscle actin (αSMA). (D) CD146, and (E) platelet-derived growth factor receptor-β (PDGFRβ) immunohistochemical staining. (F-H) Pericyte markers in glomuvenous malformation, including (F) H&E. (G) CD146, and (H) PDGFRβ immunohistochemical staining. (I, J) Dual immunohistochemical stains to include pericyte (CD146, PDGFRβ) and vascular markers (CD31). (I) CD146 (brown) and CD31 (red) co-immunohistochemical stains, (j) PDGFRβ (brown) and CD31 (red) co-immunohistochemical stains. (K, L) Representative images of h-caldesmon immunohistochemical staining. Black scale bar 200 μm. White scale bar: 100 μm.
Table 1.
Pericyte Markers in Glomus Tumor.
| Sample # | αSMA | αSMA % | CD146 | CD146 % | PDGFRβ | PDGFRβ % | h-Caldesmon | h-Caldesmon % |
|---|---|---|---|---|---|---|---|---|
| 1 | 3+ | 100 | 2+ | 100 | 2+ | 100 | 3+ | 75 |
| 2 | 3+ | 100 | 2+ | 90 | 2+ | 75 | 0 | 0 |
| 3 | 3+ | 100 | 2+ | 100 | 2+ | 60 | 3+ | 60 |
| 4 | 3+ | 100 | 2+ | 100 | 2+ | 100 | 2+ | 80 |
| 5 | 3+ | 100 | 3+ | 90 | 1+ | 40 | 0 | 0 |
| 6 | 3+ | 100 | 2+ | 50 | 2+ | 20 | 3+ | 60 |
| 7 | 3+ | 100 | 2+ | 60 | 2+ | 30 | 0 | 0 |
| 8 | 3+ | 100 | 2+ | 30 | 3+ | 70 | 2+ | 25 |
| 9 | 3+ | 100 | 3+ | 80 | 3+ | 70 | 3+ | 40 |
| Average (SD) | 3 | 100% (0) | 2.222 | 78% (±25%) | 2.111 | 63% (±28%) | 1.778 | 38% (±33%) |
Pericytic Markers in Malignant Glomus Tumor
Malignant glomus tumors (N = 4) were deep-seated (including deep soft tissue and visceral locations) and ranged in size from 4.5 to 5.5 cm. Increased mitotic rate was seen in 3 of 4 tumors (9-25 mitoses per 10 HPF). Moderate to high nuclear grade was seen in a single case. A variety of growth patterns were noted, including perivascular, infiltrative, and sheet-like arrangements of tumor cells (Figure 2A). Cytologically, increased pleomorphism was seen in some cases (Figure 2B). Clinical immunohistochemical stains included no expression of epithelial markers (including pan-keratin, Cam 5.2, EMA), melanocytic markers (S100, HMB45, MelanA, Sox10), or endothelial markers (CD31, CD34) when performed.
Figure 2. Pericytic immunophenotype of malignant glomus tumor.
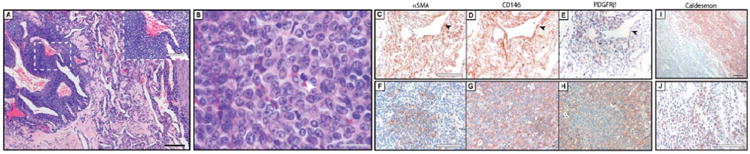
(A, B) Histological appearance of malignant glomus tumor at (A) low and (B) high magnification. White arrowhead indicates a mitotic figure. (C-E) Pericyte markers in malignant glomus tumor, to include perivascular growth pattern, including (C) αSMA, (D) CD146, and (E) PDGFRβ immunohistochemical staining. (F-H) Pericyte markers in malignant glomus tumor, to include solid growth pattern, including (F) αSMA, (G) CD146, and (H) PDGFRβ immunohistochemical staining. (I, J) Representative images of h-caldesmon immunohistochemical staining. Black scale bar: 200 μm. Gray scale bar: 20 μm. White scale bar: 100 μm.
Results showed that all tumors showed at least focal staining for all pericyte markers, but overall reduced pericyte marker expression in comparison to benign glomus tumor (Figure 2). A vague perivascular distribution of staining was noted (Figure 2C-E), although this was not necessarily a consistent feature. Loss of pericyte marker expression was most pronounced in areas of sheet-like growth pattern (Figure 2F-H). Semiquantification of immunohistochemical stains are shown in Table 2, and revealed a relative reduction in pericyte staining in comparison to benign glomus tumors. For example, a significant reduction in αSMA immunohistochemical staining intensity and distribution was observed as compared to benign glomus tumor (P = .0044 and .0007, respectively). Likewise, a significant reduction in PDGFRβ immunostaining intensity and distribution was observed (P = .0327 and .0736, respectively).
Table 2.
Pericyte Markers in Malignant Glomus Tumor.
| Sample # | αSMA | αSMA % | CD146 | CD146 % | PDGFRβ | PDGFRβ % | h-Caldesmon | h-Caldesmon % |
|---|---|---|---|---|---|---|---|---|
| 10 | 2+ | 90 | 3+ | 75 | 1+ | 10 | 3+ | 50 |
| 11 | 2+ | 85 | 3+ | 65 | 1+ | 30 | 2+ | 85 |
| 12 | 2+ | 5 | 2+ | 50 | 2+ | 70 | 1 + | 10 |
| 13 | 3+ | 80 | 3+ | 75 | 1+ | 5 | 3+ | 25 |
| Average (SD) | 2.25 | 65% (±40%) | 2.75 | 66% (± 12%) | 1.25 | 24% (± 15%) | 2.25 | 43% (±33%) |
Pericytic Immunophenotype of Myopericytoma
Myopericytomas (N = 3) were of the superficial soft tissues, located in the distal lower extremity, and ranged in size from 0.9 to 3.0 cm. All tumors showed characteristic features of myopericytoma, including oval-to-spindle shaped myoid appearing cells that show striking multilayered concentric growth around lesional blood vessels. Typical histological features of myopericytoma were observed (Figure 3A), including a prominent perivascular whorling of tumor cells (Figure 3B), subendothelial proliferation of myopericytoma cells with bulging of tumor into the lumen of blood vessels (Figure 3C), and perivascular tumor nodules outside the main tumor mass (Figure 3D). Clinical immunohistochemical stains showed negativity for epithelial (pan-keratin) and melanocytic markers (S100, HMB45) when performed.
Figure 3. Pericytic immunophenotype of myopericytoma.
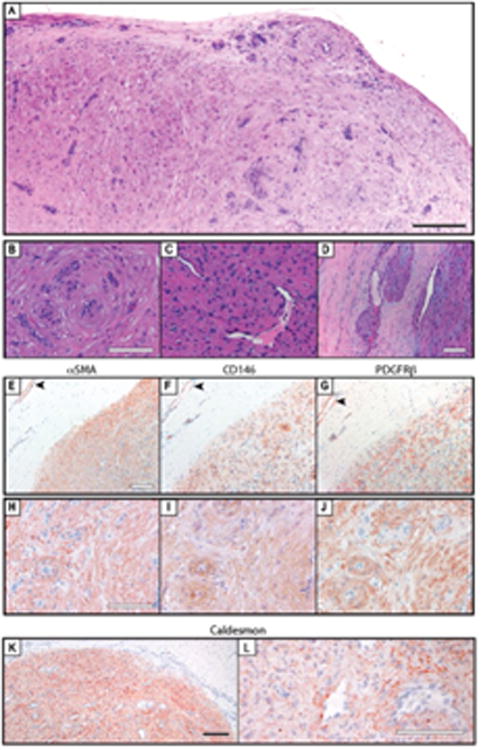
(A-D) Histological appearance of myopericytoma. Key histologic features included (B) perivascular whorling of tumor cells. (C) subendothelial tumor cell proliferation, and (D) perivascular tumor nodules outside the main tumor mass. (E-G) Pericyte markers in myopericytoma, to include tumor (lower right) and adjacent nonlesional blood vessels (upper left), including (E) αSMA. (F) CD146, and (G) PDGFRβ immunohistochemical staining. (H-J) Pericyte markers in myopericytoma, to include solid growth pattern, including (H) αSMA. (I) CD146, and (J) PDGFPβ immunohistochemical staining. (K, L) Representative images of h-caldesmon immunohistochemicai staining. Black scale bar: 200 μm. White scale bar 100 μm.
Similar to glomus tumor specimens, diffuse immunoreactivity for pericyte markers was observed (Figure 3). Interestingly, pericytes of juxtalesional blood vessels showed a similar intensity of staining (Figure 3E-G). The strongest immunoreactivity for all 3 markers tended to be in the areas of most prominent perivascular whorling of tumor cells (Figure 3H-J). Semiquantification revealed predominantly moderate to strong immunoreactivity for each pericyte marker across myopericytoma specimens (Table 3).
Table 3.
Pericyte Markers in Myopericytoma.
| Sample # | αSMA | αSMA % | CD146 | CD146 % | PDGFRβ | PDGFRβ % | h-Caldesmon | h-Caldesmon % |
|---|---|---|---|---|---|---|---|---|
| 14 | 3+ | 100 | 3+ | 100 | 3+ | 100 | 3+ | 75 |
| 15 | 2+ | 100 | 3+ | 100 | 2+ | 90 | 3+ | 75 |
| 16 | 3+ | 100 | 2+ | 90 | 1+ | 5 | 2+ | 80 |
| Average (SD) | 2.667 | 100% (0) | 2.667 | 97% (±6%) | 2 (±l) | 65% | 2.667 | 77% (±3%) |
Pericyte Markers in Angioleiomyoma
Angioleiomyomas (N = 9) were found in the dermis and superficial soft tissues of the distal upper and lower extremities, ranging in size from 0.7 to 2.5 cm. Tumors typically showed characteristics of both solid and venous growth patterns, being composed of cells with eosinophilic tumor cells with indistinct cell borders, consistent with smooth muscle differentiation. Clinical immunohistochemical stains demonstrated positivity for MSA (3/3 cases) and desmin (3/4 cases). All angioleiomyoma specimens showed negative immunohistochemical staining for vascular markers (CD34, CD31) and S100 (2/2 cases) when performed.
Interestingly, pericyte markers differed substantially based on the growth pattern within angioleiomyoma (Figure 4). Areas of venous-type growth pattern with a prominent perivascular arrangement of tumor cells showed stronger and more defined immunoreactivity for pericyte markers (Figure 4B-E). In contrast, areas of more prominent fascicular or sheet-like growth showed predominant αSMA immunoreactivity only, with little to no CD146 or PDGFRβ expression (Figure 4F-I). Interestingly, h-caldesmon showed the opposite pattern of staining, with stronger expression in the fascicular or sheet-like areas. Semiquantification showed moderate to strong and diffuse staining for αSMA, CD146, and h-caldesmon, with weak to moderate and focal staining for PDGFRβ (Table 4). In summary, although angioleiomyoma specimens demonstrated consistent immunoreactivity for each pericyte marker, angioleiomyoma showed more weak and variable immunoreactivity for PDGFRβ. In addition, tumor areas with a prominent perivascular (venous) growth pattern were also those areas that demonstrated greatest pericyte marker expression.
Figure 4. Pericyte markers in angioleiomyoma.
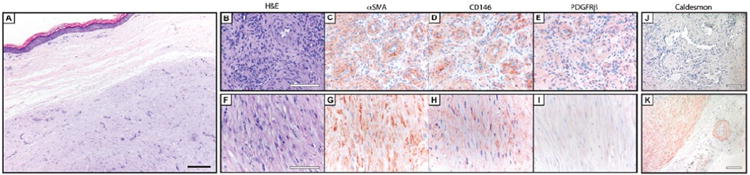
(A) Histological appearance of angioleiomyoma. (B-E) Pericyte markers in angioleiomyoma, to include perivascular growth pattern, including (B) H&E, (C) αSMA, (D) CD146, and (E) PDGFRβ immunohistochemical staining. (F-I) Pericyte markers in angioleiomyoma, to include fascicular growth pattern, including (F) H&E, (G) αSMA, (H) CD146, and (I) PDGFRβ immunohistochemical staining. (J, K) Representative images of h-caldesmon immunohistochemical staining in venous and fascicular growth patterns, respectively. Black scale bar: 200 μm. White scale bar: 100 μm.
Table 4.
Pericyte Markers in Angioleiomyoma.
| Sample # | αSMA | αSMA % | CD146 | CD146 % | PDGFRβ | PDGFRβ % | h-Caldesmon | h-Caldesmon % |
|---|---|---|---|---|---|---|---|---|
| 17 | 3+ | 100 | 2+ | 80 | 2+ | 10 | 2+ | 90 |
| 18 | 3+ | 100 | 3+ | 90 | 1+ | 5 | 3+ | 95 |
| 19 | 3+ | 100 | 3+ | 90 | 2+ | 25 | 2+ | 80 |
| 20 | 3+ | 100 | 3+ | 90 | 1+ | 5 | 3+ | 90 |
| 21 | 3+ | 100 | 1+ | 20 | 1+ | 5 | 1+ | 60 |
| 22 | 3+ | 100 | 2+ | 85 | 1+ | 5 | 2+ | 90 |
| 23 | 3+ | 100 | 2+ | 75 | 2+ | 80 | 2+ | 85 |
| 24 | 3+ | 100 | 2+ | 40 | 1+ | 5 | 1+ | 90 |
| 25 | 3+ | 100 | 3+ | 90 | 2+ | 40 | 3+ | 80 |
| Average (SD) | 3 | 100% (0) | 2.333 | 73% (±26%) | 1.444 | 20% (±26%) | 2.111 | 84% (± 10%) |
Absence of Pericyte Markers in Solitary Fibrous Tumor (SFT)
Solitary fibrous tumors (N = 10) were most commonly in the deep soft tissues, but included one pleural-based SFT. All tumors showed characteristic features of SFT, including a patternless architecture of spindled to ovoid tumor cells with variable amounts of hyalinized collagen and branching “hemangiopericytoma-like” blood vessels (Figure 5A). Within the tumors examined, a range of appearances were seen from more “solitary fibrous tumor” like (Figure 5B) to more hemangiopericytoma like in appearance (Figure 5C). Two diagnoses of “atypical SFT” were included, both of which showed increased mitotic activity (4-8 mitoses per 10 HPF), but were without other features of malignancy (no increased cellularity, no cytologic atypia, and no necrosis). Clinical immunohistochemical stains included positivity for CD34 (9/9 cases), BCL2 (2/2 cases), and CD99 (2/2 cases). Epithelial markers (pan-keratin, EMA), melanocytic markers (S100, HMB45), and vascular markers (CD31) were uniformly negative.
Figure 5. Absence of pericyte markers in solitary fibrous tumor (SFT).
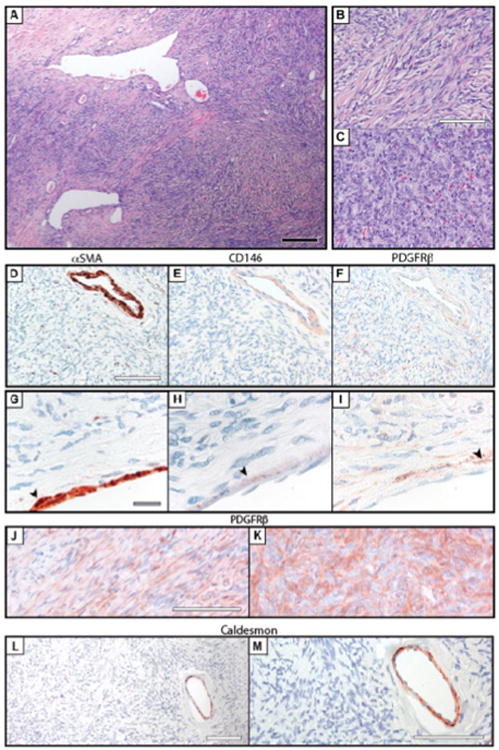
(A-C) Histological appearance of solitary fibrous tumor. A spectrum of morphologic findings were seen, from (B) more spindled cells set in a fibrous stroma to (C) more plump ovoid cells more consistent with “hemanglopericytoma” like features. (D-F) Pericyte markers in solitary fibrous tumor, to include perivascular growth pattern, including (D) αSMA, (E) CD146, and (F) PDGFRβ Immunohistochemical staing. (G-I) Pericyte markers in solitary fibrous tumor, to include a characteristic intralesional blood vessel, including (G) αSMA. (H) CD146, and (I) PDGFRβ immunohistochemical staining. (J-K) Intertumor variation in PDGFRβ immunoreactivity. (L, M) Representative images of h-caldesmon immunohistochemical staining. Black scale bar: 200 μm. White scale bar: 100 μm. Gray scale bar: 20 μm.
Results showed that immunoreactivity for pericyte antigens was essentially confined to the intralesional blood vessels (Figure 5). Higher magnification revealed flattened αSMA + CD146 + PDGFRβ+ cells along the abluminal surface of blood vessels, morphologically consistent with pericytes (Figure 5G-I). PDGFRβ immunohistochemical staining showed a range of staining patterns among SFT tumor cells (Figure 5J and K), with a subset of SFT samples examined showing weak to moderate PDGFRβ immunoreactivity (Table 5). In summary, SFT showed no consistent evidence of pericyte marker expression. In contrast, intralesional blood vessels in SFT appeared to retain their pericyte lining, which was distinct from the SFT tumor cells themselves.
Table 5.
Pericyte Markers in Solitary Fibrous Tumor.
| Sample # | αSMA | αSMA % | CD146 | CD146 % | PDGFRβ | PDGFRβ % | h-Caldesmon | h-Caldesmon % |
|---|---|---|---|---|---|---|---|---|
| 26 | 0 | 0 | 0 | 0 | 1+ | 50 | 0 | 0 |
| 27 | 0 | 0 | 0 | 0 | 0 | 0 | 0 | 0 |
| 28 | 0 | 0 | 0 | 0 | 1+ | 30 | 0 | 0 |
| 29 | 0 | 0 | 0 | 0 | 1+ | 5 | 1+ | 5 |
| 30 | 0 | 0 | 0 | 0 | 0 | 0 | 0 | 0 |
| 31 | 0 | 0 | 0 | 0 | 1+ | 15 | 0 | 0 |
| 32 | 0 | 0 | 0 | 0 | 2+ | 5 | 2+ | 5 |
| 33 | 0 | 0 | 0 | 0 | 1+ | 5 | 1 + | 5 |
| 34 | 0 | 0 | 0 | 0 | 0 | 0 | 0 | 0 |
| 35 | 0 | 0 | 0 | 0 | 2+ | 75 | 1+ | 5 |
| Average (SD) | 0 (N/A) | 0 (N/A) | 0 (N/A) | 0 (N/A) | 0.9 | 19% (±26%) | 0.5 | 2% (±3%) |
Discussion
In summary, glomus tumor, myopericytoma, and angioleiomyoma share a pericytic immunophenotype, including immunoreactivity for αSMA, CD146, and PDGFRβ. In contrast, solitary fibrous tumor does not share this pericytic immunophenotype, with focal PDGFRβ immunoreactivity only. These findings give further support to the classification of glomus tumor, myopericytoma, and angioleiomyoma as pericytic/perivascular tumors. Malignant glomus tumors demonstrate a relative loss of pericytic markers, potentially representing partial loss of pericytic differentiation.
Importantly, no known pericytic markers are absolutely specific. However, based on the available literature and the present study, the combination of αSMA + CD146 + PDGFRβ+ is quite specific for pericytic and/or smooth muscle differentiation. αSMA is expressed in pericytes,23 but is also expressed in smooth muscle and myoepithelial cells, among other normal tissues. CD146 is expressed in pericytes,23 but is also expressed in endothelium, smooth muscle, Schwann cells, among other normal tissues.24 PDGFRβ is expressed in pericytes,23 but also in diverse cell types including dermal fibroblasts, endothelium, smooth muscle, stromal cells in the breast, among other normal tissues.25 With this diverse expression profile in normal tissues, it is likewise not a wonder that these markers are each individually seen in multiple benign and neoplastic lesions. For example, Shih et al identified consistent CD146 expression in melanoma, mucoepidermoid carcinoma, gestational trophoblastic tumors, leiomyosarcoma, angiosarcoma, and Kaposi's sarcoma.24 Likewise, Palman et al identified consistent PDGFRβ expression in leiomyoma, leiomyosarcoma and angiosarcoma, as well as a number of benign and malignant mesenchymal neoplasms.25 Nevertheless, the combination of αSMA + CD146 + PDGFRβ+ appears specific for pericytic and/or smooth muscle differentiation. Other possible pericyte markers have yet to be investigated in perivascular soft tissue tumors, including NG2,23,26,27 RGS5,28,29 Ang-1 and Ang-2,30 and Nestin.31,32
Admittedly, pericytic differentiation within this group of tumors is currently of primarily academic interest. However, we hope that in the future the better understanding of pericytic differentiation within this group of tumors may help avoid pitfalls in the practice of surgical pathology. For example, glomus tumors may be mistaken for subungual melanocytic tumors or vascular tumors. When in deep locations, glomus tumors may be mistaken for an array of epithelial or mesenchymal tumors. Solitary fibrous tumors may be mistaken for smooth muscle, neural, or even monophasic synovial sarcoma. Future studies will help determine the specificity and clinical utility of pericyte markers in the diagnosis of perivascular soft tissue neoplasms.
Current interests in pericytes and perivascular stem cells predominantly owe to the recognition that pericytes are in fact mesenchymal stem cell (MSC) progenitor cells.8,23,33-38 In fact, the identity of pericytes as the native in vivo progenitors of MSCs has been well established. For example, pericytes have been shown to express typical markers of MSC, both in situ and after purification and culture (such as CD90, CD105, CD73, and CD44). In addition, purified pericytes give rise to multiple mesodermal tissues after in vivo transplantation. Moreover, purified pericytes demonstrate clonal multipotentiality, including differentiation toward osteogenic, myogenic, adipogenic, and chondrogenic cell fates—identical to that of traditionally derived MSCs.23,39 Other perivascular stromal cells have also been shown have to MSC characteristics, and the term perivascular stem cell (PSC) collectively refers to these cells (see Mravic et al 40 for a review). While enthusiasm among stem cell biologists remains high regarding the MSC identity of pericytes, it is unclear what, if any, relationship this MSC identity has with perivascular soft tissue tumors. To our knowledge, MSC markers have not yet been examined in situ among perivascular tumors. Thus, the extent to which perivascular soft tissue tumor cells demonstrate MSC characteristics remains a theoretical and unanswered question.
Solitary fibrous tumor, previously termed hemangiopericytoma, had been previously posited to have pericytic differentiation, based on cytomorphology, ultrastructural findings,41,42 and a nonspecific immunohistochemical profile, including factor-XIII and vimentin.43 Among the first to call pericytic differentiation within SFT into question was Porter et al, who found no muscle-specific actin (HHF35) expression in SFT specimens, in comparison to MSA immunoreactivity in the majority of glomus tumors.6 In fact, to date there is no direct evidence that SFT cells display pericytic differentiation (see Mravic et al 40 for a review). Despite these facts, references to possible pericytic differentiation within SFT still persist in the literature. So as to formally negate this hypothesis, our study found no evidence to suggest pericytic differentiation within SFT, including no immunoreactivity for αSMA or CD146 across all samples. Moreover, intralesional blood vessels were seen to have a pericytic cell covering, morphologically distinct from SFT tumor cells. As others have suggested, these features collectively argue against pericytic differentiation within SFT. We did, however, find patchy PDGFRβ immunoreactivity in a subset of SFT (7/10 samples). These findings are consistent with the literature, which suggests that patchy PDGFRβ immunoreactivity is present in a broad subset of SFTs. In one of the largest series of cases, Yamada et al identified PDGFRβ immunoreactivity in 55/66 SFT samples (83.3%).44 Likewise, Stacchiotti et al demonstrated PDGFRβ immunoreactivity in all SFT cases examined in 2 large series.45,46 Thus, isolated PDGFRβ expression in SFT is likely unrelated to a pericytic differentiation, but may hold future interest as a therapeutic target for receptor tyrosine kinase inhibitors.
In summary, these findings clearly support pericytic differentiation in glomus tumors, myopericytoma, and angioleiomyoma, and not in solitary fibrous tumor. The combination of αSMA, CD146, and PDGFRβ immunohistochemical stainings may be of clinical utility for the evaluation of pericytic differentiation in soft tissue tumors.
References
- 1.Weiss SW, Goldblum JJ. Enzinger and Weiss's Soft Tissue Tumors. Philadelphia, PA: Mosby Elsevier; 2008. [Google Scholar]
- 2.Mosquera JM, Sboner A, Zhang L, et al. Novel MIR143- NOTCH fusions in benign and malignant glomus tumors. Genes Chromosomes Cancer. 2013;52:1075–1087. doi: 10.1002/gcc.22102. [DOI] [PMC free article] [PubMed] [Google Scholar]
- 3.Mentzel T, Dei Tos AP, Sapi Z, Kutzner H. Myopericytoma of skin and soft tissues: clinicopathologic and immunohistochemical study of 54 cases. Am J Surg Pathol. 2006;30:104–113. doi: 10.1097/01.pas.0000178091.54147.b1. [DOI] [PubMed] [Google Scholar]
- 4.Granter SR, Badizadegan K, Fletcher CD. Myofibromatosis in adults, glomangiopericytoma, and myopericytoma: a spectrum of tumors showing perivascular myoid differentiation. Am J Surg Pathol. 1998;22:513–525. doi: 10.1097/00000478-199805000-00001. [DOI] [PubMed] [Google Scholar]
- 5.Faggioli GL, Bertoni F, Stella A, Bacchini P, Mirelli M, Gessaroli M. Multifocal diffuse glomus tumor. A case report of glomangiomyoma and review of the literature. Int Angiol. 1988;7:281–286. [PubMed] [Google Scholar]
- 6.Porter PL, Bigler SA, McNutt M, Gown AM. The immunophenotype of hemangiopericytomas and glomus tumors, with special reference to muscle protein expression: an immunohistochemical study and review of the literature. Mod Pathol. 1991;4:46–52. [PubMed] [Google Scholar]
- 7.Matsuyama A, Hisaoka M, Hashimoto H. Angioleiomyoma: a clinicopathologic and immunohistochemical reappraisal with special reference to the correlation with myopericytoma. Hum Pathol. 2007;38:645–651. doi: 10.1016/j.humpath.2006.10.012. [DOI] [PubMed] [Google Scholar]
- 8.Corselli M, Chen CW, Sun B, Yap S, Rubin JP, Peault B. The tunica adventitia of human arteries and veins as a source of mesenchymal stem cells. Stem Cells Dev. 2012;21:1299–1308. doi: 10.1089/scd.2011.0200. [DOI] [PMC free article] [PubMed] [Google Scholar]
- 9.Murray IR, West CC, Hardy WR, et al. Natural history of mesenchymal stem cells, from vessel walls to culture vessels. Cell Mol Life Sci. 2014;71:1353–1374. doi: 10.1007/s00018-013-1462-6. [DOI] [PMC free article] [PubMed] [Google Scholar]
- 10.Watanabe K, Kusakabe T, Hoshi N, Saito A, Suzuki T. h-Caldesmon in leiomyosarcoma and tumors with smooth muscle cell-like differentiation: its specific expression in the smooth muscle cell tumor. Hum Pathol. 1999;30:392–396. doi: 10.1016/s0046-8177(99)90113-2. [DOI] [PubMed] [Google Scholar]
- 11.Köhler CN. Histochemical localization of caldesmon in the CNS and ganglia of the mouse. J Histochem Cytochem. 2011;59:504–517. doi: 10.1369/0022155411400875. [DOI] [PMC free article] [PubMed] [Google Scholar]
- 12.Miettinen M, Lehto VP, Virtanen I. Glomus tumor cells: evaluation of smooth muscle and endothelial cell properties. Virchows Arch B Cell Pathol Incl Mol Pathol. 1983;43:139–149. doi: 10.1007/BF02932951. [DOI] [PubMed] [Google Scholar]
- 13.Schurch W, Skalli O, Lagace R, Seemayer TA, Gabbiani G. Intermediate filament proteins and actin isoforms as markers for soft-tissue tumor differentiation and origin. III. Hemangiopericytomas and glomus tumors. Am J Pathol. 1990;136:771–786. [PMC free article] [PubMed] [Google Scholar]
- 14.Gombos Z, Zhang PJ. Glomus tumor. Arch Pathol Lab Med. 2008;132:1448–1452. doi: 10.5858/2008-132-1448-GT. [DOI] [PubMed] [Google Scholar]
- 15.Harris M. Ultrastructure of a glomus tumour. J Clin Pathol. 1971;24:520–523. doi: 10.1136/jcp.24.6.520. [DOI] [PMC free article] [PubMed] [Google Scholar]
- 16.Murad TM, von Haam E, Murthy MS. Ultrastructure of a hemangiopericytoma and a glomus tumor. Cancer. 1968;22:1239–1249. doi: 10.1002/1097-0142(196811)22:6<1239::aid-cncr2820220622>3.0.co;2-2. [DOI] [PubMed] [Google Scholar]
- 17.Tsuneyoshi M, Enjoji M. Glomus tumor: a clinicopathologic and electron microscopic study. Cancer. 1982;50:1601–1607. doi: 10.1002/1097-0142(19821015)50:8<1601::aid-cncr2820500823>3.0.co;2-5. [DOI] [PubMed] [Google Scholar]
- 18.Diaz-Flores L, Gutierrez R, Garcia MP, Alvarez-Arguelles H, Diaz-Flores L, Jr, Madrid JF. Myopericytoma and arterial intimal thickening: the relationship between myopericytes and myointimal cells. J Cutan Pathol. 2011;38:857–864. doi: 10.1111/j.1600-0560.2011.01778.x. [DOI] [PubMed] [Google Scholar]
- 19.Seifert HW. Ultrastructural investigation on cutaneous angioleiomyoma. Arch Dermatol Res. 1981;271:91–99. doi: 10.1007/BF00417392. [DOI] [PubMed] [Google Scholar]
- 20.Goldblum JR, Folpe AL, Weiss SW, Enzinger FM, Weiss SW. Enzinger and Weiss's Soft Tissue Tumors. 6th. Philadelphia, PA: Saunders/Elsevier; 2014. [Google Scholar]
- 21.Folpe AL, Fanburg-Smith JC, Miettinen M, Weiss SW. Atypical and malignant glomus tumors: analysis of 52 cases, with a proposal for the reclassification of glomus tumors. Am J Surg Pathol. 2001;25:1–12. doi: 10.1097/00000478-200101000-00001. [DOI] [PubMed] [Google Scholar]
- 22.Trere D, Montanaro L, Ceccarelli C, et al. Prognostic relevance of a novel semiquantitative classification of Bcl2 immunohistochemical expression in human infiltrating ductal carcinomas of the breast. Ann Oncol. 2007;18:1004–1014. doi: 10.1093/annonc/mdm074. [DOI] [PubMed] [Google Scholar]
- 23.Crisan M, Yap S, Casteilla L, et al. A perivascular origin for mesenchymal stem cells in multiple human organs. Cell Stem Cell. 2008;3:301–313. doi: 10.1016/j.stem.2008.07.003. [DOI] [PubMed] [Google Scholar]
- 24.Shih IM, Nesbit M, Herlyn M, Kurman RJ. A new Mel- CAM (CD146)-specific monoclonal antibody, MN-4, on paraffinembedded tissue. Mod Pathol. 1998;11:1098–1106. [PubMed] [Google Scholar]
- 25.Palman C, Bowen-Pope DF, Brooks JJ. Platelet-derived growth factor receptor (beta-subunit) immunoreactivity in soft tissue tumors. Lab Invest. 1992;66:108–115. [PubMed] [Google Scholar]
- 26.Ozerdem U. Targeting of pericytes diminishes neovascularization and lymphangiogenesis in prostate cancer. Prostate. 2006;66:294–304. doi: 10.1002/pros.20346. [DOI] [PubMed] [Google Scholar]
- 27.Ozerdem U. Targeting neovascular pericytes in neurofibromatosis type 1. Angiogenesis. 2004;7:307–311. doi: 10.1007/s10456-004-6643-3. [DOI] [PMC free article] [PubMed] [Google Scholar]
- 28.Bondjers C, Kalen M, Hellstrom M, et al. Transcription profiling of platelet-derived growth factor-B-deficient mouse embryos identifies RGS5 as a novel marker for pericytes and vascular smooth muscle cells. Am J Pathol. 2003;162:721–729. doi: 10.1016/S0002-9440(10)63868-0. [DOI] [PMC free article] [PubMed] [Google Scholar]
- 29.Cho H, Kozasa T, Bondjers C, Betsholtz C, Kehrl JH. Pericyte-specific expression of Rgs5: implications for PDGF and EDG receptor signaling during vascular maturation. FASEB J. 2003;17:440–442. doi: 10.1096/fj.02-0340fje. [DOI] [PubMed] [Google Scholar]
- 30.Wakui S, Yokoo K, Muto T, et al. Localization of Ang-1, -2, Tie-2, and VEGF expression at endothelial-pericyte interdigitation in rat angiogenesis. Lab Invest. 2006;86:1172–1184. doi: 10.1038/labinvest.3700476. [DOI] [PubMed] [Google Scholar]
- 31.Alliot F, Rutin J, Leenen PJ, Pessac B. Pericytes and periendothelial cells of brain parenchyma vessels co-express aminopeptidase N, aminopeptidase A, and nestin. J Neurosci Res. 1999;58:367–378. [PubMed] [Google Scholar]
- 32.Klein D, Meissner N, Kleff V, et al. Nestin (+) tissue-resident multipotent stem cells contribute to tumor progression by differentiating into pericytes and smooth muscle cells resulting in blood vessel remodeling. Front Oncol. 2014;4:169. doi: 10.3389/fonc.2014.00169. [DOI] [PMC free article] [PubMed] [Google Scholar]
- 33.Chen CW, Montelatici E, Crisan M, et al. Perivascular multi-lineage progenitor cells in human organs: regenerative units, cytokine sources or both? Cytokine Growth Factor Rev. 2009;20:429–434. doi: 10.1016/j.cytogfr.2009.10.014. [DOI] [PubMed] [Google Scholar]
- 34.Chen CW, Okada M, Proto JD, et al. Human pericytes for ischemic heart repair. Stem Cells. 2013;31:305–316. doi: 10.1002/stem.1285. [DOI] [PMC free article] [PubMed] [Google Scholar]
- 35.Corselli M, Chen CW, Crisan M, Lazzari L, Peault B. Perivascular ancestors of adult multipotent stem cells. Arterioscler Thromb Vasc Biol. 2010;30:1104–1109. doi: 10.1161/ATVBAHA.109.191643. [DOI] [PubMed] [Google Scholar]
- 36.Crisan M, Chen CW, Corselli M, Andriolo G, Lazzari L, Peault B. Perivascular multipotent progenitor cells in human organs. Ann N Y Acad Sci. 2009;1176:118–123. doi: 10.1111/j.1749-6632.2009.04967.x. [DOI] [PubMed] [Google Scholar]
- 37.Crisan M, Deasy B, Gavina M, et al. Purification and long-term culture of multipotent progenitor cells affiliated with the walls of human blood vessels: myoendothelial cells and pericytes. Methods Cell Biol. 2008;86:295–309. doi: 10.1016/S0091-679X(08)00013-7. [DOI] [PubMed] [Google Scholar]
- 38.Crisan M, Huard J, Zheng B, et al. Purification and culture of human blood vessel-associated progenitor cells. Curr Protoc Stem Cell Biol. 2008;Chapter 2 doi: 10.1002/9780470151808.sc02b02s4.. Unit 2B 2 1-2B 2 13. [DOI] [PubMed] [Google Scholar]
- 39.Tang W, Zeve D, Suh JM, et al. White fat progenitor cells reside in the adipose vasculature. Science. 2008;322:583–586. doi: 10.1126/science.1156232. [DOI] [PMC free article] [PubMed] [Google Scholar]
- 40.Mravic M, Asatrian G, Soo C, et al. From pericytes to perivascular tumours: correlation between pathology, stem cell biology, and tissue engineering. Int Orthop. 2014;38:1819–1824. doi: 10.1007/s00264-014-2295-0. [DOI] [PubMed] [Google Scholar]
- 41.Erlandson R. Diagnostic Transmission Electron Microscopy of Tumors. New York, NY: Raven Press; 1994. [Google Scholar]
- 42.Ghadially FN. Diagnostic Electron Microscopy of Tumours. London, England: Butterworth; 1980. [Google Scholar]
- 43.Nemes Z. Differentiation markers in hemangiopericytoma. Cancer. 1992;69:133–140. doi: 10.1002/1097-0142(19920101)69:1<133::aid-cncr2820690124>3.0.co;2-#. [DOI] [PubMed] [Google Scholar]
- 44.Yamada Y, Kohashi K, Fushimi F, et al. Activation of the Akt-mTOR pathway and receptor tyrosine kinase in patients with solitary fibrous tumors. Cancer. 2014;120:864–876. doi: 10.1002/cncr.28506. [DOI] [PubMed] [Google Scholar]
- 45.Stacchiotti S, Negri T, Libertini M, et al. Sunitinib malate in solitary fibrous tumor (SFT) Ann Oncol. 2012;23:3171–3179. doi: 10.1093/annonc/mds143. [DOI] [PubMed] [Google Scholar]
- 46.Stacchiotti S, Negri T, Palassini E, et al. Sunitinib malate and figitumumab in solitary fibrous tumor: patterns and molecular bases of tumor response. Mol Cancer Ther. 2010;9:1286–1297. doi: 10.1158/1535-7163.MCT-09-1205. [DOI] [PubMed] [Google Scholar]