

Abstract
Objective:
To determine the availability, accessibility, and affordability of EEG, EMG, CSF analysis, head CT, and brain MRI for neurologic disorders across countries.
Methods:
An online, 60-question survey was distributed to neurology practitioners in 2014 to assess the presence, wait time, and cost of each test in private and public health sectors. Data were stratified by World Bank country income group. Affordability was calculated with reference to the World Health Organization's definition of catastrophic health expenditure as health-related out-of-pocket expenditure of >40% of disposable household income, and assessment of providers' perceptions of affordability to the patient.
Results:
Availability of EEG and EMG is correlated with higher World Bank income group (correlation coefficient 0.38, test for trend p = 0.046; 0.376, p = 0.043); CSF, CT, and MRI did not show statistically significant associations with income groups. Patients in public systems wait longer for neurodiagnostic tests, especially MRI, EEG, and urgent CT (p < 0.0001). The mean cost per test, across all tests, was lower in the public vs private sector (US $55.25 vs $214.62, p < 0.001). Each drop in World Bank income group is associated with a 29% decrease in the estimated share of the population who can afford a given test (95% confidence interval −33.4, 25.2; p < 0.001). In most low-income countries surveyed, only the top 10% or 20% of the population was able to afford tests below catastrophic levels. In surveyed lower-middle-income countries, >40% of the population, on average, could not afford neurodiagnostic tests.
Conclusions:
Neurodiagnostic tests are least affordable in the lowest income settings. Closing this “diagnostic gap” for countries with the lowest incomes is essential.
It has been argued that diagnostic tests for neurologic disorders are difficult to access in many countries, especially in countries of lower income status; however, few actual data are present to support this concern. Particularly, little information is available for low- and middle-income countries (LMICs) where neurologists are generally rare, if not completely absent.1,2 Even where human resources and technology are available, it is not clear what proportion of the population has access to neurodiagnostic testing given the generally uneven distribution of health resources in LMICs.3
One study4 including 44 African countries in 2001 focused on neurosurgical resources and found that 18 countries had no CT scanners, 13 countries had only one CT scanner each, and only 13 countries had more than 2 CT scanners each. Similar data on EEG, EMG, MRI, and CSF studies are not available. Given the lack of collected knowledge on neurologic testing, particularly in LMICs, we conducted a survey of physician respondents engaged in the practice of neurology worldwide. The objective of the present study was to assess the availability, accessibility, and affordability of neurodiagnostic tests across low-, middle-, and high-income countries.
METHODS
Human subjects.
This study was exempted from formal review by the Partners Healthcare Institutional Review Board under protocol 2014P000180.
Survey instrument.
A survey instrument was designed based on 5 common clinical case scenarios: EEG to assess focal seizures, EMG with nerve conduction studies for suspected acute inflammatory demyelinating polyneuropathy, head CT and brain MRI to identify stroke, and CSF studies for suspected meningitis (survey instrument, appendix e-1 on the Neurology® Web site at Neurology.org). The survey was written for a medically trained respondent with knowledge of neurologic disorders. Each case aimed to depict a typical patient who would benefit from the test of interest.
Survey implementation.
The survey was written and distributed in English, using Qualtrics software, an online survey platform. The survey instrument had 60 multiple-choice and fill-in-the-blank questions. Respondents were also invited to include comments and report the unavailable tests of highest need in their practice settings. The currency of reporting was at the discretion of the respondent; when local currency was quoted, conversion to US dollars was performed using www.xe.com in December 2014.
Respondent selection.
Invitations were sent to the (1) Global Health Section of the American Academy of Neurology via its monthly e-newsletter, (2) published country-level contacts of the World Federation of Neurology's member societies, (3) Grand Challenges Canada Mental Health grant recipient community, and (4) professional contacts of the authors. Respondents were invited up to 3 times via e-mail with additional reminders sent after ≥4 weeks (June–December, 2014).
The response goal was one respondent per country, with a focus on gathering information from LMICs. LMICS are defined by the World Bank as countries with a gross national income per capita <$12,746; we used 2013 as a reference period. All countries that could be reached through the above groups, including those without a practicing neurologist, were contacted. In the case of multiple respondents from a country, the highest-quality response was chosen with the following preference hierarchy: complete vs incomplete survey response, neurologist vs non-neurologist, and first vs subsequent respondent.
Definitions and calculations.
We defined and computed 4 measures of access to neurodiagnostic tests. Availability was defined as the current, routine existence of the testing procedure that could be used by patients at the respondent's health care facility. Access time was defined as the amount of time a patient would typically wait for a given test. For affordability, we analyzed 2 variables: (1) the physician's perception of affordability of the test by his or her patients, and (2) income-based affordability. For the latter, given that household-level income data are largely absent in LMICs, we followed the approach outlined in Harttgen and Vollmer5 and computed estimated household income based on average household income and the overall distribution of income as measured by the Gini index of income inequality. Data on national income per capita and the most recent Gini index values were obtained from the World Bank Databank6 (complete economic analyses, appendix e-2). The international subsistence level was defined as an individual living on US $1.25 per day by World Bank standards, equivalent to US $456.25 per year.7 This is assumed to be the bare minimum that a household needs to have its subsistence needs met; until household income surpasses this level, there is no disposable income.
To establish affordability, the cost of each test was computed relative to the disposable household income. The World Health Organization defines catastrophic health expenditure as health-related out-of-pocket expenditure in excess of 40% of disposable household income.8 Based on this definition, we classified a test as “affordable” for a household if the resulting expenditure did not exceed 40% of annual household disposable income. A p value of <0.05 was considered statistically significant.
RESULTS
Respondents.
There were 52 responses from 37 countries. One response per country was used from 8 (22%) low-income countries (Bangladesh, Burkina Faso, Ethiopia, Haiti, Myanmar, Somalia, Uganda, Zimbabwe), 7 (19%) lower-middle-income countries (Bhutan, Ghana, India, Lao People's Democratic Republic, Nigeria, Pakistan, Zambia), 13 (35%) upper-middle-income countries (Albania, Botswana, Brazil, Cuba, Iran, Jamaica, Jordan, Macedonia, Mexico, Namibia, Panama, Peru, South Africa), and 9 (24%) high-income countries (Canada, Czech Republic, Iceland, Israel, Japan, Kuwait, the Netherlands, United States). A total of 165 e-mails were sent (final response rate by participant 32%, by country 37/119, 31%). Respondents worked in academic hospitals (n = 27, 73%), government-operated hospitals (n = 13, 35%), and private practices (n = 6, 16%); 8 (22%) reported working in multiple settings. Most respondents were urban residents (>100,000 inhabitants) (n = 34, 91%), with fewer living in smaller urban areas (≤100,000 inhabitants) (n = 3, 8%).
Availability.
Overall, the least to most available tests were MRI (76% of surveyed countries), EEG (83%), EMG (86%), CT (95%), and lumbar puncture (LP) (97%) (table 1). Availability of EEG and EMG were correlated with per capita income (correlation coefficient 0.38, test for trend p = 0.046; 0.376, p = 0.043).
Table 1.
Availability of neurodiagnostic tests at respondents' institutions, by World Bank country income group
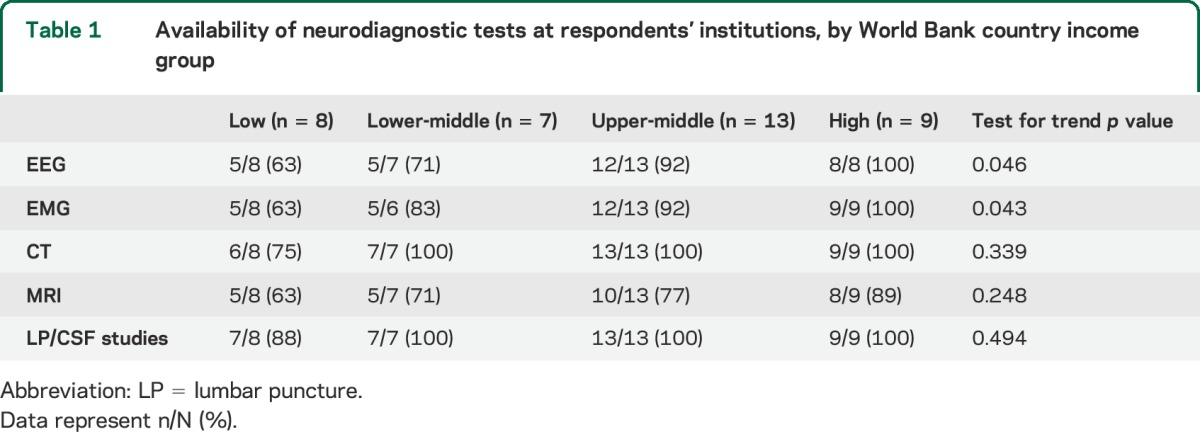
There was also a positive trend for the availability of LP, CT, and MRI by income group, but these trends were not statistically significant given the widespread availability of LP and CT.
The most common reason for a test being unavailable was that the test was available in a few cities/hospitals in the respondent's country but not where the respondent worked. In low-income countries, this was true for the following tests: EEG in 25% of countries (2/8) (Uganda, Myanmar); EMG in 13% (1/8) (Uganda); CT in 25% (2/8) (Uganda, Myanmar); and MRI in 38% (3/8) (Uganda, Myanmar, Zimbabwe). In lower-middle-income countries, this was true for EMG in 17% of countries (1/6) (Nigeria) and MRI in 14% (1/7) (Pakistan). In upper-middle-income countries, this occurred only twice, with MRI in 15% of countries (2/13) (Cuba, Namibia). This situation was never stated in high-income countries. Very few respondents reported complete unavailability of the test in the country with the exceptions of EEG in Bhutan, EMG in Botswana, Haiti, and Myanmar, and MRI in Laos. Other reasons for unavailability included absence of skilled workers to conduct the test or to interpret test results as well as damaged equipment.
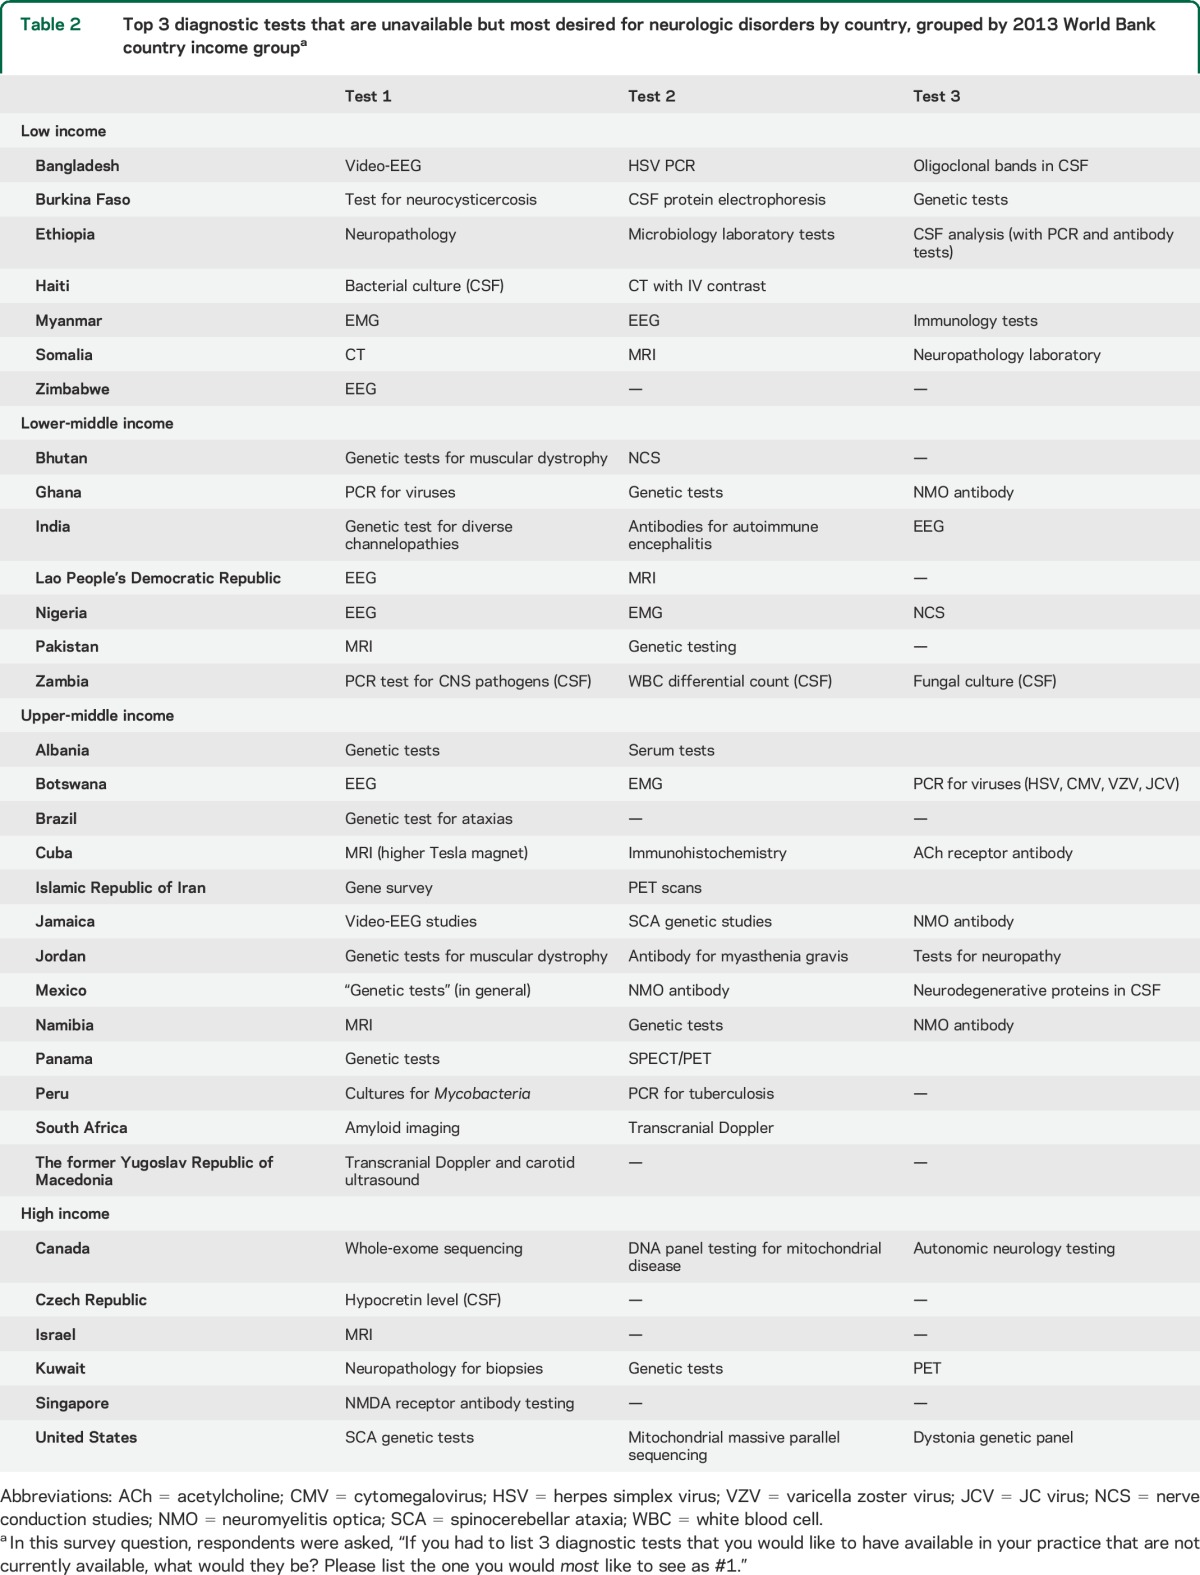
Of the 36 responding countries able to perform CSF analyses, all reported the ability to test for white cells, protein, and glucose. However, many reported difficulty obtaining all desired CSF tests: 6% (2/36) were unable to obtain staining for bacteria (Bangladesh, Ethiopia), 17% (6/36) were unable to send tests for Mycobacterium tuberculosis (Burkina Faso, Bangladesh, Ethiopia, Jordan, Peru, Albania), 33% (12/36) were unable to obtain an opening pressure, 36% (13/36) were unable to obtain herpes simplex virus PCR, and 53% (19/36) were unable to obtain oligoclonal bands. Several currently unavailable diagnostic tests were desired in countries of all income levels (table 2).
Table 2.
Top 3 diagnostic tests that are unavailable but most desired for neurologic disorders by country, grouped by 2013 World Bank country income groupa
Access time of neurodiagnostic tests.
Patients in lower-income countries appear to wait longer for neurodiagnostic tests, although these observed trends were not statistically significant (table 3). The wait time for public vs private health sectors, however, is significantly longer for all tests for which data were collected (EEG, CT, MRI, CSF, p < 0.0001 for each).
Table 3.
Wait times for neurodiagnostic testing in private and public health sectors, stratified by World Bank country income group, as perceived by providers
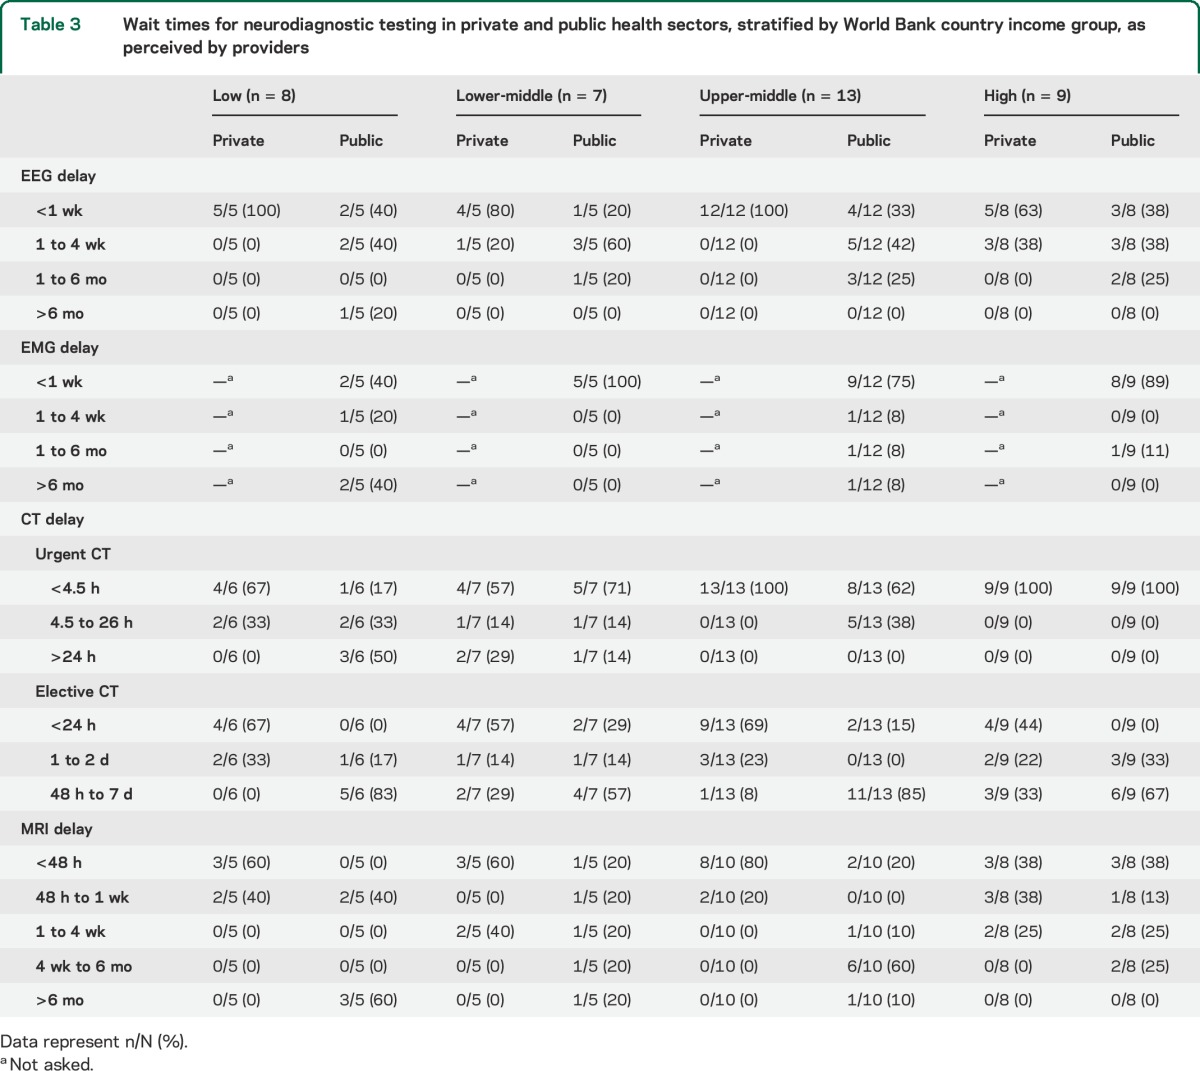
In public health care systems in low-income countries, on average it is not possible for a patient to obtain an MRI in less than 48 hours (0/5), whereas 20% (1/5), 20% (2/10), and 38% (3/8) of lower-middle-, upper-middle-, and high-income countries, respectively, can obtain these tests in that timeframe. In low-income countries, 60% of countries (3/5) wait >6 months for MRI (Somalia, Ethiopia, Haiti) whereas in the other income groups combined, only 9% (2/23) had to wait this long (India, Brazil). Of the countries that reported a typical wait time of >6 months for MRI in the public health care system, 100% (5/5) reported less than a week's wait time for privately paying patients.
There were no observed linear associations with country income level and EEG access time. Health sector did not show distinctions. In the private setting, 100% of countries (30/30) can obtain an EEG within 4 weeks, whereas only 76% (23/30) in the public setting can obtain EEG within that timeframe. In the public health sector, the ability to obtain EEG within 1 week is 40% (2/5), 20% (1/5), 33% (4/12), and 38% (3/8), whereas in private settings, the ability is 100% (5/5), 80% (4/5), 100% (12/12), and 63% (5/8) in low-, lower-middle-, upper-middle-, and high-income countries, respectively. Somalia was the only country that reported an average wait time of >6 months.
In countries where EMG is available in the public setting, only 40% of low-income countries (2/5) reported an ability to obtain EMG within 1 week (Zimbabwe, Bangladesh). Countries in other income groups reported that a majority of patients could obtain EMG within 1 week: 100% (5/5), 75% (4/6), 89% (9/12) in low-middle-, upper-middle-, and high-income countries, respectively. Forty percent of low-income countries (2/5) had to wait an average of >6 months for EMG (Somalia, Ethiopia), whereas only 4% (1/26) of all other income classes combined needed to wait that long (Brazil).
In urgent situations, head CT is most difficult to obtain within 4.5 hours in low-income countries and in public health care systems: 15% (1/6) low-income, 71% (5/7) lower-middle-income, 62% (8/13) upper-middle-income, and 100% (9/9) of high-income countries, respectively, can obtain head CT within that timeframe. In private health care systems, 67% (4/6), 57% (4/7), 100% (13/13), and 100% (9/9) can obtain head CT within 4.5 hours. Of note, all patients in high-income countries, regardless of public or private sector, wait <4.5 hours for head CT. Nonurgent head CT did not show clear trends regarding access time.
Cost and affordability.
Costs are generally lower for all neurologic tests in the public vs private systems (table 4, scatterplot figure e-1). The mean cost per test in the public sector is $55.25 vs $214.62 in the private sector (p < 0.001). Tests in the public sector were on average $159.36 lower than in the private sector (SD $25.37, 95% confidence interval −$209.32, −$109.40). The reported costs by test and country income group are given in figure e-2. Bangladesh, Burkina Faso, Somalia, Ethiopia, Myanmar, and Zimbabwe have the poorest access and affordability with only approximately the top 10% or 20% of the population being able to afford any neurodiagnostic test at below catastrophic health care expenditure levels. Countries such as Ghana, Nigeria, Zambia, South Africa, and Namibia, while having higher affordability than the first group of countries, still only meet accessibility standards for <60% of their populations, on average.
Table 4.
Cost and affordability of neurodiagnostic testing in private and public health sectors, stratified by World Bank country group, as perceived by providers

Organization for Economic Cooperation and Development countries, including the Netherlands, Iceland, Japan, Czech Republic, and Canada as well as countries such as Brazil, Israel, Iran, and Kuwait, all have extremely high out-of-pocket affordability with between 80% and 100% of their total populations being able to afford neurologic tests with <10% household expenditure of disposable income.
When examining affordability by World Bank income group, affordability decreases sharply with income level (figure 1). Each drop in income group (e.g., high to upper-middle) is associated with a 29.3% decrease in the estimated share of the population who can afford a given test (95% confidence interval −33.4, 25.2; p < 0.001). Between 80% and 100% of high-income countries' populations are able to afford all of the neurodiagnostic tests at <10% of their annual household disposable income, while in low-income countries, only 0% to 20% of the total population can afford any of the tests at <10% of their annual household disposable income.
Figure 1. Average percent of total population that can afford a given test at below 10% annual household disposable income by World Bank country income group.

LP = lumbar puncture.
Most tests are affordable for >70% of the total populations in the Americas, Europe, and Western Pacific World Health Organization regions. The lowest affordability for all tests is in Africa and Southeast Asia, where the majority of tests are affordable by <50% of the total population at <10% of annual household disposable income.
When providers were asked about perceived affordability of these tests, similar trends emerged. When providers in low-income countries were asked whether their patients were able to pay for a given test when indicated, none (0/5) believed that the majority of their patients in the public health care setting could afford to pay for the required out-of-pocket payments associated with EEG, EMG, or MRI. LP did not show clear trends by income group and was >70% affordable across public and private sectors and income class.
DISCUSSION
Beyond the absolute barrier of unavailability of neurodiagnostic tests, many people in LMICs face long wait times and low affordability. We identified disparities within countries (public vs private sectors when existent) as well as between countries based on World Bank income grouping. The present situation almost certainly contributes to the morbidity or mortality of neurologic disorders in lower-income settings.
Our findings quantify and substantiate the high need for viable and affordable neurologic tests in several locations, particularly in Africa, home to more than 1 billion people. In one recent study of 349 people aged 70 years and older in Tanzania in 2009–2010, 65% of people with neurologic disorders sought treatment, but only 15% were diagnosed correctly and only 10% received appropriate treatment. Men were significantly more likely to receive an appropriate diagnosis and treatment.9 It is likely that LMICs worldwide experience similar difficulties but do not have the human resources to assess and report these metrics.
Catastrophic health expenditures for a neurologic diagnosis lead to loss of assets and wealth for people who are already experiencing neurologic disorders. This almost certainly leads to worsening access to treatment and rehabilitation if personal assets are expended fully on testing. In 2004, the World Health Organization reported on 84 countries' expenditures for neurologic care1: out-of-pocket expenditures were the primary methods of payment in 84% of low-income countries but only 4% of high-income countries. In a separate study of antiepileptic drugs in 46 countries,10 the highest prices for many drugs occurred in the lowest-income countries. Our survey results demonstrate that health expenditure for the diagnosis of neurologic disease is likely to be classified as “catastrophic” for the large majority of patients in LMICs. While most of the populations in the surveyed high-income countries can afford neurodiagnostic tests under both public and private insurance schemes, most of the populations in the surveyed low-income countries cannot afford neurologic tests in either sector.
Our results are subject to limitations. Despite efforts to reach potential respondents in 120 countries, we obtained responses from 37 countries. It is possible that response rates may be positively or negatively correlated with the local availability of tests. Yet, we were able to obtain responses from a range of country income levels and locations, including countries without neurologists or professional neurologic societies. Non-neurologist practitioners who responded in our study may have been less familiar with the prices and access to neurodiagnostic tests, depending on the country. We chose to use one response per country in order to include the perceived best respondent. A respondent may have inaccurate or nonrepresentative information. Since most respondents were from cities, test availability may be overestimated. We attempted to address this issue by asking the respondent about the local practice setting and the country as a whole. Future studies could capture patients' perceptions; notably, in our study, providers' perspectives of affordability and actual affordability were in fact well-aligned (appendix e-2).
In the assessment of affordability, all results are estimated from income distributions based on per capita gross domestic product. Income can provide an inaccurate measure of household wealth in LMICs, where people may not have employment within the formal economy. However, given a lack of reliable and comparable data on household wealth for all countries surveyed, gross domestic product per capita can be considered a reasonable estimate of household income. The global poverty line may not apply similarly to all countries. While the subsistence poverty line is likely applicable to most countries, when applied to high-income countries, the global poverty line may be too low (appendix e-2).
Neurodiagnostic tests are not of equal clinical value or urgency and depend on the clinical context (e.g., CT for acute stroke vs EEG for focal seizure). Anecdotally, patients may choose not to seek care in the absence of both human resources and infrastructure for health. This makes quantification of the missed opportunities for diagnosis difficult. Previous reports on HIV/AIDS, schizophrenia, dementia, and epilepsy have coined the term “treatment gap” and used this concept to implement actionable change.11–14 Our data suggest a similar gap in the capacity to diagnose neurologic disease. This “diagnostic gap” is relevant to clinical care but also may limit the ability to assess the epidemiology of neurologic disorders. Lack of accurate tests additionally leads to less efficient use of already-scarce resources, such as medications and health care personnel, and unnecessary use of treatments that have adverse side effects. For example, in Central Africa, the need for laboratory testing was recently emphasized given that “clinical features of most neurological infections are not specific, brain imaging is seldom feasible, and treatment regimens are often prolonged and toxic.”15
Analysis of availability, accessibility, and affordability may provide a framework for needs, perhaps as an index score, which could allow specific metrics and locations to be more strategically targeted. Overall, closing the “neurodiagnostic gap” requires investment in several domains: diagnostic infrastructure; hiring and training of staff in the utilization and maintenance of equipment and interpretation of diagnostic studies; increasing access to limited technologic resources via new methods such as mobile clinics and more cost-effective tests; and overall increased spending on the diagnosis of brain disorders. In this way, neurologic diagnoses can be more universally and expediently provided to the most vulnerable populations.
Supplementary Material
GLOSSARY
- LMICs
low- and middle-income countries
- LP
lumbar puncture
Footnotes
Supplemental data at Neurology.org
AUTHOR CONTRIBUTIONS
H.C.M. was involved with the study design, data analysis, data interpretation, writing, and editing of the manuscript. A.L.B. was involved with the data collection, data interpretation, writing, and editing of the manuscript. B.N.P. was involved with the data interpretation, statistical analysis, writing, and editing of the manuscript. E.D.M. was involved with the study design, data collection, data interpretation, and editing of the manuscript. E.W. was involved with the data collection, data interpretation, and editing of the manuscript. S.W. was involved with the study design, data collection, and editing of the manuscript. G.F. was involved with study design, data analysis, data interpretation, and editing of the manuscript. F.J.M. was involved with the study design, data collection, data analysis, data interpretation, writing, editing, obtaining funding, and supervision of the manuscript.
STUDY FUNDING
Supported by Grand Challenges Canada (338-04). Grand Challenges Canada is funded by the Government of Canada as part of a consortium with the Canadian Institute of Health Research and the International Development Research Council.
DISCLOSURE
The authors report no disclosures relevant to the manuscript. Go to Neurology.org for full disclosures.
REFERENCES
- 1.Atlas: country resources for neurological disorders [online]. Available at http://www.who.int/mental_health/neurology/neurogy_atlas_lr.pdf. Accessed September 25, 2015.
- 2.Bower JH, Zenebe G. Neurologic services in the nations of Africa. Neurology 2005;64:412–415. [DOI] [PubMed] [Google Scholar]
- 3.Hart JT. The inverse care law. Lancet 1971;1:405–412. [DOI] [PubMed] [Google Scholar]
- 4.El Khamlichi A. African neurosurgery: current situation, priorities, and needs. Neurosurgery 2001;48:1344–1347. [DOI] [PubMed] [Google Scholar]
- 5.Harttgen K, Vollmer S. Inequality Decomposition Without Income or Expenditure Data: Using an Asset Index to Simulate Household Income. Human Development Research Papers (2009 to Present) HDRP-2011-13, Human Development Report Office (HDRO), United Nations Development Programme (UNDP) [online]. Available at: http://hdr.undp.org/en/reports/global/hdr2011/papers/HDRP_2011_13.pdf. Accessed January 22, 2015. [Google Scholar]
- 6.The World Bank. World DataBank [online]. Available at: http://databank.worldbank.org/data/home.aspx. Accessed January 22, 2015. [Google Scholar]
- 7.Ravallion M, Chen S, Sangraula P. Dollar a Day Revisited (Report). Washington, DC: The World Bank [online] Available at: http://core.ac.uk/download/pdf/6645038.pdf. Accessed June 10, 2015. [Google Scholar]
- 8.Xu K, Evans DB, Kawabata K, Zeramdini R, Klavus J, Murray CJ. Household catastrophic health expenditure: a multicountry analysis. Lancet 2003;362:111–117. [DOI] [PubMed] [Google Scholar]
- 9.Dewhurst F, Dewhurst MJ, Gray WK, et al. The prevalence of disability in older people in Hai, Tanzania. Age Ageing 2012;41:517–523. [DOI] [PubMed] [Google Scholar]
- 10.Cameron A, Bansal A, Dua T, et al. Mapping the availability, price, and affordability of antiepileptic drugs in 46 countries. Epilepsia 2012;53:962–969. [DOI] [PubMed] [Google Scholar]
- 11.World Health Organization. The World Health Report 2004: Changing History. Geneva: World Health Organization; 2004. [Google Scholar]
- 12.Dias A, Patel V. Closing the treatment gap for dementia in India. Ind J Psychiatry 2009;51(suppl 1):S93–S97. [PMC free article] [PubMed] [Google Scholar]
- 13.Lora A, Kohn R, Levav I, McBain R, Morris J, Saxena S. Service availability and utilization and treatment gap for schizophrenic disorders: a survey in 50 low- and middle-income countries. Bull World Health Organ 2012;90:47–54. [DOI] [PMC free article] [PubMed] [Google Scholar]
- 14.Sebera F, Munyandamutsa N, Teuwen DE. Addressing the treatment gap and societal impact of epilepsy in Rwanda: results of a survey conducted in 2005 and subsequent actions. Epilepsy Behav 2015;46:126–132. [DOI] [PMC free article] [PubMed] [Google Scholar]
- 15.Yansouni CP, Bottieau E, Lutumba P, et al. Rapid diagnostic tests for neurological infections in central Africa. Lancet Infect Dis 2013;13:546–558. [DOI] [PubMed] [Google Scholar]
Associated Data
This section collects any data citations, data availability statements, or supplementary materials included in this article.