

Abstract
Calcium is a key regulator of axon degeneration caused by trauma and disease, but its specific spatial and temporal dynamics in injured axons remain unclear. To clarify the function of calcium in axon degeneration, we observed calcium dynamics in single injured neurons in live zebrafish larvae and tested the temporal requirement for calcium in zebrafish neurons and cultured mouse DRG neurons. Using laser axotomy to induce Wallerian degeneration (WD) in zebrafish peripheral sensory axons, we monitored calcium dynamics from injury to fragmentation, revealing two stereotyped phases of axonal calcium influx. First, axotomy triggered a transient local calcium wave originating at the injury site. This initial calcium wave only disrupted mitochondria near the injury site and was not altered by expression of the protective WD slow (WldS) protein. Inducing multiple waves with additional axotomies did not change the kinetics of degeneration. In contrast, a second phase of calcium influx occurring minutes before fragmentation spread as a wave throughout the axon, entered mitochondria, and was abolished by WldS expression. In live zebrafish, chelating calcium after the first wave, but before the second wave, delayed the progress of fragmentation. In cultured DRG neurons, chelating calcium early in the process of WD did not alter degeneration, but chelating calcium late in WD delayed fragmentation. We propose that a terminal calcium wave is a key instructive component of the axon degeneration program.
SIGNIFICANCE STATEMENT Axon degeneration resulting from trauma or neurodegenerative disease can cause devastating deficits in neural function. Understanding the molecular and cellular events that execute axon degeneration is essential for developing treatments to address these conditions. Calcium is known to contribute to axon degeneration, but its temporal requirements in this process have been unclear. Live calcium imaging in severed zebrafish neurons and temporally controlled pharmacological treatments in both zebrafish and cultured mouse sensory neurons revealed that axonal calcium influx late in the degeneration process regulates axon fragmentation. These findings suggest that temporal considerations will be crucial for developing treatments for diseases associated with axon degeneration.
Keywords: axon, calcium, mitochondria, Wallerian degeneration, WldS, zebrafish
Introduction
Calcium dysregulation contributes to axon and dendrite degeneration during developmental pruning (Kanamori et al., 2013; Yang et al., 2013), as a result of injury (Schlaepfer and Bunge, 1973; Ziv and Spira, 1993; Ouardouz et al., 2003; Avery et al., 2012; Mishra et al., 2013; Villegas et al., 2014), and in neurodegenerative diseases (Mattson, 2007; Berridge, 2011). Wallerian degeneration (WD) occurs in axon fragments that have been separated from their cell body by injury (Waller, 1850) and is a tractable model for dissecting the functions of calcium in axon degeneration (Wang and Barres, 2012). During the initial stages of WD, calcium plays a positive role in sealing axonal membranes (Yawo and Kuno, 1985; Eddleman et al., 1997; Godell et al., 1997). However, calcium's predominant role in WD is in promoting axon fragmentation. For example, chelating extracellular calcium (Schlaepfer and Bunge, 1973; Mishra et al., 2013), blocking voltage-gated calcium channels (George et al., 1995; Knöferle et al., 2010), or inhibiting calcium release from intracellular stores (Ouardouz et al., 2003; Villegas et al., 2014) all delay axon fragmentation. Conversely, increasing calcium promotes axon degeneration (Schlaepfer, 1977; Glass et al., 1994; George et al., 1995; Knöferle et al., 2010; Mishra et al., 2013). Despite the key role that calcium plays in WD, when and where it functions to promote fragmentation is unclear.
WD proceeds through a stereotyped, molecularly regulated sequence of cellular events (Coleman and Freeman, 2010). First, immediately after damage, a region of axon near the injury site fragments through a process termed acute axonal degeneration (Kerschensteiner et al., 2005). Second, a lag phase of variable duration occurs, during which the detached axon remains intact. Third, a fragmentation process rapidly degrades the axon into small pieces that will be cleared by phagocytic cells. The WD slow (WldS) protein potently delays fragmentation, thus lengthening the lag phase of WD (Lunn et al., 1989; Coleman et al., 1998; Conforti et al., 2000; Mack et al., 2001; Adalbert et al., 2005; Hoopfer et al., 2006; Martin et al., 2010; Kitay et al., 2013). WldS is a chimeric protein that contains the NAD-producing enzyme NMNAT1 (Mack et al., 2001). Axon protection by WldS requires NMNAT1's enzymatic domain, but the specific cellular processes that it impinges upon are unclear (Araki et al., 2004; Avery et al., 2009; Conforti et al., 2009). It has been proposed that WldS dampens axonal calcium and production of reactive oxygen species (ROS) to protect axons (Avery et al., 2012; Calixto et al., 2012; O'Donnell et al., 2013). These two processes intersect in mitochondria because mitochondrial calcium overload can lead to reduced ATP production and the opening of the mitochondrial transition pore, which induces ROS to damage axons (Barrientos et al., 2011; Villegas et al., 2014). Calcium also promotes axon degeneration by activating the protease calpain, which breaks down neurofilaments (Schlaepfer and Zimmerman, 1985; Glass et al., 1994; Yang et al., 2013).
A complete understanding of calcium's role in WD will require determining its temporal and spatial distribution in injured axons. In this study, we address this issue by imaging calcium dynamics in single axons in live zebrafish from injury to fragmentation. This analysis revealed two distinct phases of calcium influx during axon degeneration: a local initial wave just after axotomy and a global terminal wave just before fragmentation. Chelating calcium late in the degeneration process in fish embryos and in cultured mouse DRG neurons delayed or disrupted axon fragmentation. Our findings suggest that the terminal calcium wave plays a key role in executing axon fragmentation.
Materials and Methods
Animal care.
For all experiments, fish were raised on a 14 h/10 h light/dark cycle at 28.5°C. Zebrafish embryos were maintained in a 28.5°C incubator. All fish experiments were performed at larval stages, when male and females cannot be distinguished. All zebrafish experiments were approved by the Chancellor's Animal Research Care Committee at the University of California, Los Angeles. All mouse experiments were approved by the Rockefeller University Institutional Animal Care and Use Committee and were conducted in compliance with the National Institutes of Health's Guide for the Care and Use of Laboratory Animals. The sex of mouse embryos was not determined.
Plasmid injections.
To achieve transient, mosaic gene expression in zebrafish sensory neurons, ∼10 pg of each transgene was injected at the one-cell stage into wild-type AB or nacre (Lister et al., 1999) embryos or embryos of the transgenic lines described below. Embryos were screened for fluorescent transgene expression in trigeminal or Rohon–Beard (RB) neurons at 24–48 h postfertilization (hpf) using a Zeiss Discovery.V12 SteREO fluorescence dissecting microscope.
Zebrafish imaging and axotomy.
Zebrafish embryos were mounted in 1.2% low-melt agarose in a sealed chamber, as described previously (O'Brien et al., 2009). Both trigeminal and RB neurons were used for analyses. Axotomy was performed with a femtosecond laser on a Zeiss LSM 510(meta) two-photon microscope, also as described previously (O'Brien et al., 2009; O'Donnell et al., 2013). Time-lapse imaging was performed using a mechanized stage with a 20× air objective on a Zeiss LSM 510 confocal microscope using MultiTime software. Depending on the experiment, imaging intervals varied between 2 s and 20 min, as indicated in graphs and figure legends.
Plasmid transgenes.
All plasmid transgenes were constructed using the MultiSite Gateway tol2kit system (Kwan et al., 2007). As described below, p5E, pME, and p3E entry vectors were recombined together into the pDestTol2pA Destination vector.
Crest3:Gal4;14xUAS:WLDs-t2a-Dsred was made by recombining together p5E-Crest3 (Uemura et al., 2005), pME-Gal4VP16;14xUAS, and p3E-WLDs-t2a-Dsred (Hoopfer et al., 2006; Provost et al., 2007; Martin et al., 2010).
Crest3:LexA:4xLexAop:Parvalbumin and Crest3:LexA;4xLexAop:Parvalbumin(E61V) were made be recombining together p5E-Crest3, pME-LexAVP16;4xLexAop (Lai and Lee, 2006), and p3E-Parvalbumin or P3E-Parvalbumin(E61V) (Pusl et al., 2002). The parvalbumin cDNA was obtained from Addgene (plasmid #17287). The E61V mutation was introduced with site-directed mutagenesis.
Crest3:LexA;4xLexAop:GCAMP-HS was made by recombining together p5E-Crest3, pME-LexAVP16;4xLexAop, and p3E-GCaMP-HS (Muto et al., 2011).
10xUAS:mitoRGECO was made by recombining together p5E-10xUAS (Kwan et al., 2007), pME-mitoRGECO (Zhao et al., 2011; Esterberg et al., 2014), and p3E-polyA (Kwan et al., 2007).
10xUAS:Mito-GCAMP-HS was made by recombining together p5E-10xUAS (Kwan et al., 2007), pME-GCAMP-HS (Muto et al., 2011), and p3E-polyA (Kwan et al., 2007).
BAPTA-AM application.
A BAPTA-AM treatment protocol was optimized empirically to maintain the health of the animal and integrity of the skin. Single neurons expressing DsRed and GCAMP-HS were generated as described in the Results. Embryos were mounted in agarose for imaging and laser axotomy, freed from the agarose, placed back in Ringer's medium for 10–30 min, and then immersed for 20 min in 200 μm BAPTA-AM diluted in calcium-free Ringer's medium with 10 mm EDTA and 0.05% Pluronic F127. Embryos were then washed in calcium-free Ringer's medium three times and remounted in calcium-free agarose for imaging.
DRG neuronal cultures.
DRGs were dissected from E12.5 mouse embryos. DRG explants were plated on poly-d-lysine/laminin-coated 24-well plates in neurobasal medium supplemented with 2% B27, 0.45% glucose, 100 U/ml penicillin, 100 U/ml streptomycin, and 50 ng/ml mouse NGF. At 1 d in vitro (DIV1), a final concentration of 10 μm 5-fluoro-2′-deoxyuridine and 10 μm uridine was added to the cultures. Axons were cut with a microscalpel on DIV3. To chelate extracellular calcium, 5 mm EGTA was added to the medium, as indicated.
Data analysis and presentation.
Zebrafish confocal image stacks were projected into 2D images using Zeiss Zen software. The Zeiss Zen profile tool was used to measure axonal length and average GCaMP-HS intensity over a 50 μm axonal segment at each time point. All changes in GCaMP-HS intensity were normalized to GCaMP-HS intensity in images obtained from the same axonal segment 2–20 min before axotomy. GCaMP-HS intensity data were analyzed with Excel and SigmaPlot. To plot changes in GCAMP-HS intensity over time, normalized average intensity values were binned into 5 s or 1 min bins. Graphs of averaged data show second order polynomial fit and individual average data points. Error bars show SEM for each time point unless otherwise indicated. Axonal fragmentation in zebrafish was assessed as described previously (Martin et al., 2010).
For quantification of axon degeneration in DRG cultures, distal axons in randomly chosen fields were examined. Any sign of fragmentation was scored as degenerated. Degeneration was quantified as the percentage of all axons scored as degenerated in each culture.
Statistical analysis.
GraphPad Prism software was used to analyze data. Student's t test or Mann–Whitney test were used to analyze GCaMP-HS levels and two-way ANOVA followed by Bonferroni's post test was used for analysis of axon fragmentation in zebrafish.
Results
In vivo imaging of cytoplasmic calcium after laser axotomy in zebrafish sensory neurons reveals two phases of calcium influx
To monitor calcium dynamics in single axons in living animals, we expressed the calcium sensor GCaMP-HS (Muto et al., 2011) in larval zebrafish somatosensory neurons. Experiments were performed in stable transgenic lines for widespread expression and with transient transgenesis for sparse expression. To achieve broad expression, we crossed a somatosensory neuron specific driver line (Isl[ss]:Gal4, UAS:DsRed) to a GCaMP-HS effector line (UAS:GCaMP-HS) (Muto et al., 2011; Rieger and Sagasti, 2011). To express the calcium sensor in single, isolated neurons, we transiently injected a Gal4 driver transgene (Crest3:Gal4, UAS:DsRed) at the one-cell stage into UAS:GCaMP-HS fish. Both methods achieved coexpression of cytoplasmic DsRed and the calcium sensor in the two larval populations of zebrafish somatosensory neurons, trigeminal neurons innervating the head and RB neurons innervating the body. WD was induced by severing single peripheral axons with a laser and monitoring GCaMP-HS fluorescence with confocal time-lapse microscopy (O'Brien et al., 2009). This method allowed us to observe relative changes in axonal calcium levels from injury to fragmentation.
In invertebrate models and cultured neurons, a wave of calcium influx follows axon injury (Ziv and Spira, 1993; Ghosh-Roy et al., 2010; Adalbert et al., 2012; Avery et al., 2012; Cho et al., 2013; Mishra et al., 2013). To determine whether a similar calcium increase occurs in vivo in vertebrate axons, we imaged GCaMP-HS immediately after laser axotomy of peripheral sensory axons. GCaMP-HS fluorescence increased within 2 s of axotomy (Fig. 1A,B, Movie 1). This calcium wave traveled away from the injury site with similar dynamics both proximally (toward the cell body) and distally (toward the axon tip) (Fig. 1B), but dampened with time and distance (Fig. 1C). More than 100 μm away from the injury site, fluorescence changes were minimal. In the majority of axons, fluorescence returned to baseline in <5 min (2.36 ± 1.55 min SD, n = 15). These results demonstrate that, like in other systems, axotomy induces a local and transient calcium wave near the axotomy site.
Figure 1.
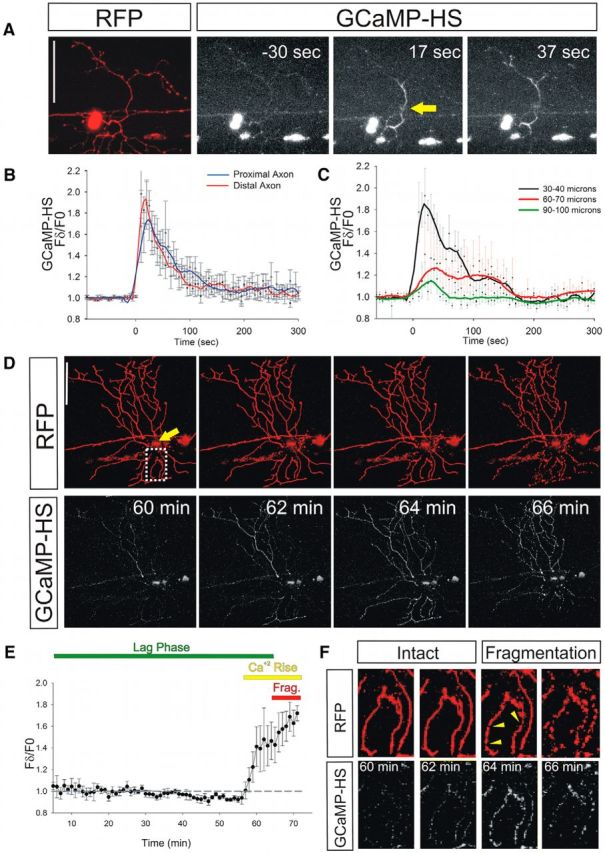
Cytoplasmic calcium rises immediately after axotomy and immediately before axon fragmentation. A, RB neuron in a 2 dpf zebrafish larva expressing DsRed (left) and GCaMP-HS (3 right) before (−30 s) and after (17 and 37 s) laser axotomy. GCaMP-HS fluorescence traveled as a wave away from the axotomy site toward both the cell body and into the axon fragment. Arrow points to the axotomy site. Scale bar, 100 μm. B, Plot of relative GCaMP-HS fluorescence intensity changes in regions 50 μm distal and proximal to the axotomy site (n = 12). The GCaMP-HS fluorescence waves were similar in distal and proximal directions. C, Plot of relative GCaMP-HS fluorescence intensity changes at several distances from the axotomy site in the distal axon fragment (n = 12). The GCaMP-HS fluorescence waves diminished in magnitude with distance from the axotomy site. The average velocity of GCaMP-HS fluorescence waves was 2.66 μm/s, measured as time to fluorescence peak. D, RB neuron in a 2 dpf zebrafish larva expressing DsRed and GCaMP-HS. Times after axotomy are indicated in minutes. GCaMP-HS fluorescence rose minutes (62–64 min) before fragmentation (64–66 min). Arrow points to the axotomy site. Scale bar, 100 μm. E, Plot of GCaMP-HS fluorescence intensity changes throughout the lag phase, starting 5 min after axotomy, measured in 1 min intervals (n = 4 neurons in 4 fish). GCaMP-HS fluorescence rose minutes before fragmentation. Frag, Fragmentation. F, Magnification of a separated branch of the axon shown in D; magnified area corresponds to the dotted box. Note that calcium increased between 60 and 62 min after axotomy, but signs of fragmentation (arrowheads) were not apparent until 64 min after axotomy.
Calcium wave induced by axotomy travels away from the injury site. Shown is a time-lapse movie of a sensory neuron expressing DsRed and GCAMP-HS. Minutes after axotomy are indicated.
Imaging calcium dynamics throughout the entire process of axon degeneration has been challenging because it occurs over several days in many WD models and dynamics in single axons can be obscured when imaging entire nerves. Recently, calcium imaging in cultured neurons revealed that calcium also increases toward the end of the lag phase (Adalbert et al., 2012). Because WD in zebrafish sensory axons occurs in <3 h, we were able to image calcium dynamics with high temporal resolution in the entire detached fragment throughout the complete process of axon degeneration. After the initial injury-induced wave, calcium levels remained at baseline for the majority of the lag phase of WD. However, a few minutes (5.8 ± 2.43 min SD, n = 16) before fragmentation, GCaMP-HS fluorescence rose again in the distal axon fragment (Fig. 1D,E, Movie 2), but not in the proximal axon, which does not degenerate. This calcium increase occurred before overt signs of fragmentation (Fig. 1F). Calcium influx during this phase progressed through the entire distal fragment as a wave and remained high throughout the fragmentation process. Unlike the initial wave, this terminal wave did not always initiate at the injury site, but could begin at any axon branch tip or apparently from within the fragment (waves starting at injury site = 29%, waves starting at a distal tip = 59%, n = 17). Notably, when multiple branches were separated by axotomy, each branch fragmented at slightly different times (Fig. 1D, Movie 2). Without exception, the timing of calcium elevation and fragmentation were always correlated: branches that experienced calcium elevation first underwent fragmentation first. The fact that the terminal wave of calcium influx invariably preceded simultaneous fragmentation of the entire distal branch suggests that calcium influx is likely functionally coupled to axon fragmentation.
Terminal calcium wave precedes fragmentation. Shown is a time-lapse movie of a sensory neuron expressing DsRed and GCAMP-HS. Minutes after axotomy are indicated.
Calcium dynamics in the matrix of axonal mitochondria echo cytoplasmic calcium dynamics
Calcium overload can trigger mitochondrial damage, which is thought to play an instructive role in axon degeneration (Barrientos et al., 2011; Avery et al., 2012; Fang et al., 2012; O'Donnell et al., 2013; Breckwoldt et al., 2014; Villegas et al., 2014). Previously, we found that axotomy of zebrafish peripheral axons disrupted mitochondrial transport, morphology, and oxidation state locally just after axotomy and then throughout the axon immediately before fragmentation (O'Donnell et al., 2013). The similarity between the spatial and temporal dynamics of calcium influx and mitochondrial damage prompted us to hypothesize that cytoplasmic calcium enters mitochondria to damage them. To visualize calcium changes in mitochondria of degenerating axons, we localized GCaMP-HS to the mitochondrial matrix with a Cox8-targeting sequence (Mito-GCaMP-HS). In uninjured axons of neurons expressing Mito-GCaMP-HS, the percentage of mobile axonal mitochondria was 27.1% (n = 7 axons), consistent with our previous observations (O'Donnell et al., 2013). Mitochondrial density was similar in neurons expressing Mito-GCaMP-HS and MitoDsRed (O'Donnell et al., 2013) (Mito-GCaMP-HS density = 2.7 ± 0.49 per 20 μm, MitoDsRed density = 2.3 ± 0.45 per 20 μm), indicating that Mito-GCaMP-HS does not alter mitochondrial distribution.
As with cytoplasmic calcium, axotomy caused calcium increases in mitochondria progressively from the injury site out (Fig. 2A–C). The kinetics of mitochondrial calcium influx near the injury site were similar to those of cytoplasmic calcium, but mitochondrial calcium increases appeared to be relatively delayed (Fig. 2B) and calcium levels in mitochondria took substantially longer to return to baseline than in the cytoplasm (Fig. 2B,E). To determine definitively whether mitochondrial calcium increases followed cytoplasmic calcium increases, we simultaneously expressed GCaMP-HS in the cytoplasm and the red fluorescent calcium sensor RGECO in mitochondria (Zhao et al., 2011; Esterberg et al., 2013). MitoRGECO fluorescence consistently increased only after GCaMP-HS increased in the surrounding cytoplasm (Fig. 2C). This result suggests that injury-induced cytoplasmic calcium enters mitochondria and correlates with the spatial distribution of mitochondrial dysfunction (O'Donnell et al., 2013).
Figure 2.
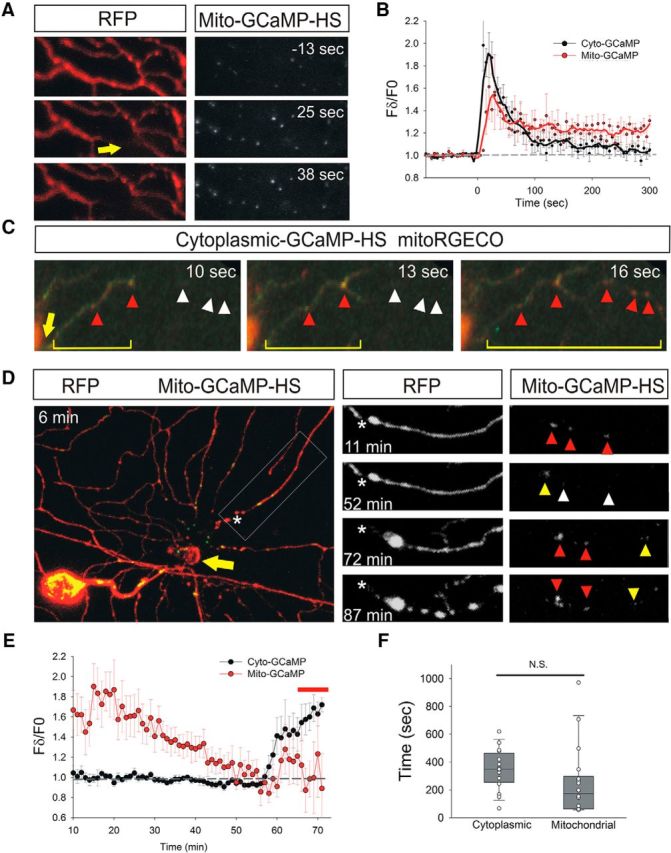
Mitochondrial calcium increases after cytoplasmic calcium influx induced by axotomy and just before fragmentation. A, Peripheral axon arbor of an RB neuron in a 2 dpf zebrafish larva expressing DsRed and Mito-GCaMP-HS before (−13 s) and after (25 and 38 s) laser axotomy. Mito-GCaMP-HS fluorescence intensity rose in mitochondria near axotomy site (arrow). B, Plot comparing relative fluorescence intensity changes in GCaMP-HS and Mito-GCaMP-HS in regions 50 μm distal to the axotomy site (n = 9 neurons for GCaMP-HS and 12 neurons for Mito-GCaMP-HS). The Mito-GCaMP-HS fluorescence rose with similar kinetics in the cytoplasm and mitochondria, but remained elevated for longer in axonal mitochondria. C, Spatial comparison of calcium rises in cytoplasm (GCaMP-HS, green) and mitochondria (mitoRGECO, red) after axotomy (indicated in seconds). Arrow points to site of axotomy, bracket indicates extent of cytoplasmic calcium wave, red arrowheads indicate mitochondria with elevated calcium, and white arrowheads indicate locations of mitochondria with baseline calcium. Note that mitochondrial calcium increases followed cytoplasmic calcium increases. D, RB neuron in a 2 dpf zebrafish larva expressing RFP and Mito-GCaMP-HS after axotomy. Times after axotomy indicated in minutes. Arrow indicates axotomy site. Area boxed in left panel is magnified in the right panels. Asterisk indicates proximal end of the severed axon branch. Arrowheads point to mitochondria in the magnified panels: red arrowheads indicate mitochondria with high GCaMP fluorescence, yellow indicates intermediate fluorescence, and white indicates low fluorescence. Note that calcium diminished between 11 and 52 min after axotomy, just before fragmentation. Fragmentation has just begun at the 72 h time-point in this axon. E, Plot comparing relative fluorescence intensity changes in GCaMP-HS and Mito-GCaMP-HS in regions 50 μm distal to the axotomy site, starting 10 min after axotomy, measured in 1 min intervals (n = 8 cytoplasmic measurements and 16 mitochondrial measurements). Note that Mito-GCaMP-HS fluorescence intensity diminished gradually through the lag phase, but increased minutes before fragmentation. Bar above graph indicates approximate time of fragmentation. F, Box plot showing duration of terminal calcium rise in cytoplasm and mitochondria starting when a calcium increase was first detected and ending when fragmentation was first detected (n = 16–18). Imaging intervals were 22–62 s for mitochondria and 29–135 s for cytoplasmic measurements. N.S., Not significant.
Because cytoplasmic calcium rises at the end of the WD lag phase (Fig. 1D,E), we also monitored mitochondrial calcium during this phase. Before the end of the lag phase, mitochondrial calcium near the injury site had returned to baseline (Fig. 2D,E). However, a few minutes before fragmentation, mitochondrial calcium rose globally throughout the detached fragment (Fig. 2D,E). We were not able to resolve the sequence of mitochondrial and cytoplasmic calcium increase definitively during this terminal phase, but in the averaged data, the spike in calcium occurred slightly later in mitochondria than in the cytoplasm (Fig. 2E, Movie 3). Although the average time from calcium elevation to fragmentation was somewhat shorter, this difference was not statistically significant, indicating that, as in the initial wave, calcium increases in these two compartments were tightly coupled (Fig. 2F). This observation is consistent with the possibility that an increase in cytoplasmic calcium led to mitochondrial calcium overload, which damaged mitochondria just before fragmentation.
Mitochondrial calcium increases at the end of the WD lag phase. Shown is a time-lapse movie of a sensory neuron expressing DsRed (left) and Mito-GCaMP-HS (right). Seconds after axotomy are indicated.
WldS does not affect the initial injury-induced calcium influx after axotomy but suppresses the later calcium wave
WldS potently delays axon degeneration in many neurons, including zebrafish somatosensory neurons (Coleman and Freeman, 2010; Feng et al., 2010; Martin et al., 2010; Rosenberg et al., 2012; O'Donnell et al., 2013). WldS has been proposed to function at least in part by suppressing calcium increases immediately after axotomy (Avery et al., 2012). To test this model, we expressed WldS and GCAMP-HS in the same neurons. Surprisingly, even though WldS expression delayed fragmentation (Fig. 3A), neither the magnitude nor duration of the initial calcium wave was altered (Fig. 3B, Movie 4).
Figure 3.
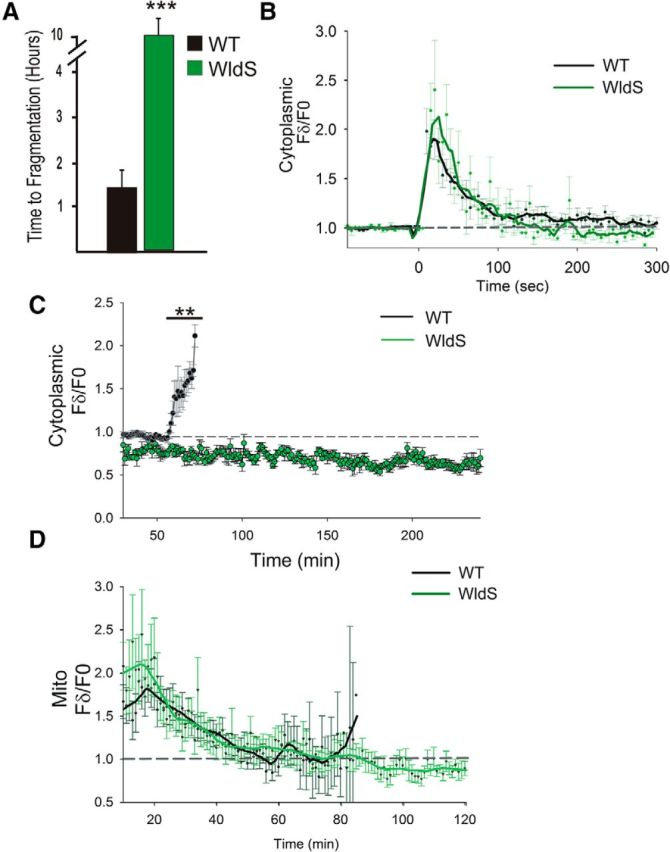
WldS suppresses the terminal, but not the initial, phase of cytoplasmic and mitochondrial calcium influx. A, Graph showing time to fragmentation of severed axons in wild-type (WT) and WldS-expressing neurons. No WldS-expressing axons fragmented within 10 h after axotomy (n = 10 WT and 24 WldS-expressing neurons). Experiments for both WT and WldS-expressing neurons were performed in stable transgenic lines expressing the fluorescent protein KikGR, as described previously (Martin et al., 2010). ***p < 0.005. B, Plot of relative GCaMP-HS fluorescence intensity changes in regions 50 μm distal to the axotomy site in WT and WldS-expressing neurons (n = 12 WT and 17 WldS neurons). GCaMP-HS fluorescence waves were similar in the two conditions. C, Plot showing GCaMP-HS fluorescence intensity changes in WT and WldS-expressing neurons over a 4 h period, starting at 30 min, imaged in 1 min intervals (n = 4 WT and 4 WldS neurons). Note that none of the axons in WLdS-expressing cells fragmented nor exhibited a calcium increase during the imaging period. **p < 0.01. D, Plot comparing relative fluorescence intensity changes in Mito-GCaMP-HS in regions 50 μm distal to the axotomy site of WT and WldS-expressing neurons, starting 10 min after axotomy, measured in 1 min intervals (n = 17 WT and 10 WldS-expressing neurons). There was no statistical difference in the peaks of fluorescence intensity between the two conditions. Note that Mito-GCaMP-HS fluorescence intensity diminished gradually through the lag phase in both conditions, but increased in WT just before fragmentation. Upon returning to baseline (∼60 min after axotomy) Mito-GCaMP-HS fluorescence remained close to baseline in WldS-expressing neurons.
WldS does not alter the initial calcium wave induced by axotomy. Shown is a time-lapse movie of a sensory neuron expressing DsRed, GCaMP-HS, and WldS. Seconds after axotomy are indicated.
Because a phase of calcium influx always preceded fragmentation in wild-type axons, we investigated whether this calcium increase occurred at a particular time after axotomy or if it was exclusively coupled to axon fragmentation. Because injured WldS-expressing axons do not fragment for at least 12 h after axotomy, we imaged calcium in WldS-expressing axon fragments for several hours after axotomy. After the initial axotomy-induced calcium increase, there were no additional phases of calcium increase for at least 4 h (Fig. 3C), suggesting that the coincidence of the late phase of calcium influx and fragmentation seen in control neurons may be functionally significant. Because WldS can alter mitochondrial function and calcium buffering (Barrientos et al., 2011; Avery et al., 2012), we also imaged calcium in mitochondria of WldS-expressing sensory neurons after axotomy. Neither the kinetics nor the spatial distribution of mitochondrial calcium dynamics was altered by WldS, relative to controls (Fig. 3D).
Additional axotomies do not change the timing of fragmentation
The fact that the first wave of calcium influx occurs in WldS-expressing axons indicated that it was not sufficient to induce axon degeneration. This finding suggests either that the first wave of calcium influx does not regulate the timing of fragmentation or that WldS acts on processes downstream of this phase of calcium influx. To further examine the function of the initial wave, we performed multiple axotomies on the same axon fragment, reasoning that, if this phase of calcium influx is instructive, then axon fragmentation may be accelerated by repeated damage (Fig. 4A,B).
Figure 4.

Multiple axotomies induce additional calcium influx, but do not affect the timing of axon fragmentation. A, Diagram illustrating double axotomy experiment. B, Representative RB neuron in a 2 dpf animal expressing DsRed, shown before (0 min) and after (10 and 86 min) axotomy. Yellow arrow indicates site of first axotomy, red arrow indicates site of second axotomy. Axotomy sites were 50 μm apart. Often, the region between the two axotomy sites immediately degenerated, as in this example, but it is not clear whether this was due to tissue damage or acute axonal degeneration. Note that fragmentation of distal regions cut twice occurred with similar kinetics to regions cut once. Scale bar, 100 μm. C, Plot comparing relative GCaMP-HS fluorescence intensity changes in regions 50 μm distal to the axotomy site in axons cut once (black) or twice within 90 s (red) (n = 12 for single cut, 4 for double cut). Arrowhead indicates start of fluorescence intensity changes after the first cut in a double-cut axon; arrow indicates fluorescence intensity changes after the second cut in a double-cut axon. Bracket indicates interval when imaging was interrupted to perform the second axotomy. Note that the second cut caused calcium levels to stay high for longer than in single-cut axons. D, Plot comparing relative GCaMP-HS fluorescence intensity changes in regions 50 μm distal to the axotomy site in axons cut once (black, same as in C) or after the second cut of an axon cut twice ∼1 h apart (red) (n = 12 for single cut, 4 for double cut). E, Graph showing time to fragmentation of axons severed once or twice (n = 15 for single cut, 10 for 0.5–5 min second cuts, and 6 for 60–65 min second cuts). Note that additional axotomies did not alter the time to fragmentation.
Additional axotomies induced additional transient local waves of calcium influx. When an axon was axotomized twice within 2 min, the peak of the initial calcium wave was substantially prolonged, but the length of the lag phase did not change (Fig. 4B,C,E). Similarly, when a second axotomy was inflicted 60–65 min after axotomy, the magnitude of each new wave was similar to the first, but the duration of the lag phase was unaltered (Fig. 4D,E). The lag-phase duration was also not altered by axotomizing an axon fragment 3 times (data not shown, n = 2). These results collectively suggest that neither the duration nor frequency of the initial axotomy-induced calcium wave determines the timing of axon fragmentation.
Cell-autonomous chelation of calcium delays degeneration of zebrafish sensory axons
To determine whether the calcium increases that we observed after axotomy regulate degeneration, we expressed the calcium-binding protein parvalbumin in somatosensory neurons. Paravalbumin expression blunted the initial injury-induced calcium wave, indicating that it was an effective chelator (Fig. 5A). Both the terminal phase of calcium influx and the onset of fragmentation were delayed in axons of parvalbumin-expressing cells relative to controls (Fig. 5B,C). As in wild-type axons, a terminal phase of calcium influx always preceded fragmentation by a few minutes (Fig. 5B). Mutating the calcium-binding domain of parvalbumin (Pusl et al., 2002) suppressed its ability to delay fragmentation (Fig. 5C). These results suggest a cell-autonomous role for calcium in determining the timing of axon degeneration, but do not distinguish whether its primary effect on WD is reducing the initial calcium wave or delaying the terminal wave.
Figure 5.
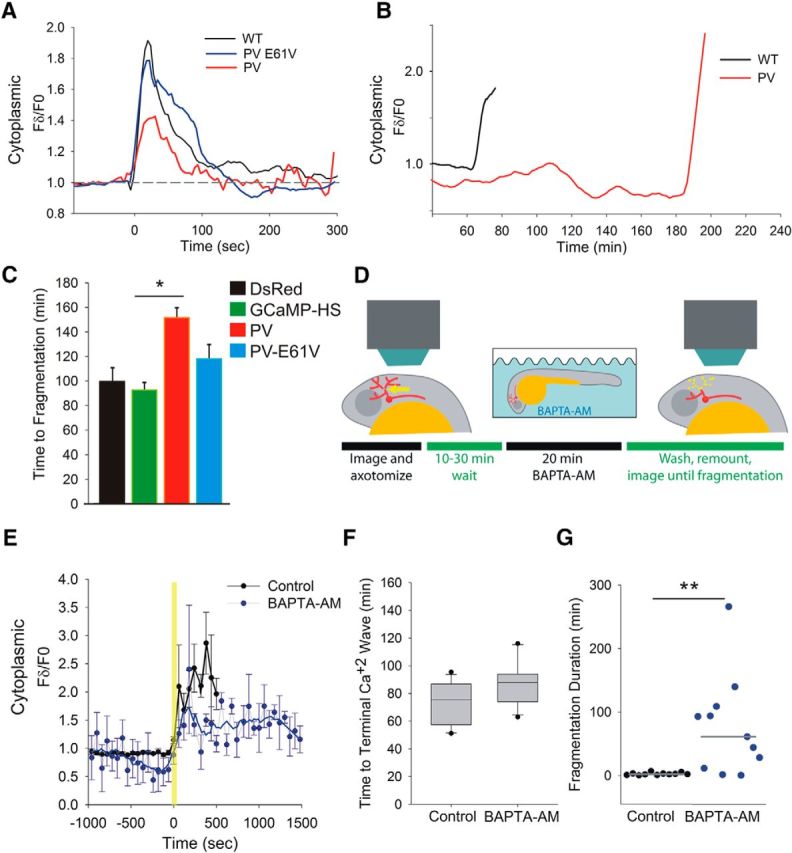
In vivo calcium buffering specifically in neurons or after the first wave of calcium influx alters degeneration kinetics. A, Representative plots of GCaMP-HS fluorescence intensity changes in regions 50 μm distal to the axotomy site in WT, parvalbumin (PV)-expressing neurons and PV(E61V)-expressing neurons. Note that PV reduced the initial calcium wave, but PV(E61V) did not. B, Representative plots of GCaMP-HS fluorescence intensity changes in regions 50 μm distal to the axotomy site in WT and PV-expressing neurons, starting at 37 min, imaged at 1 min intervals. Traces end when the axons fragmented. Note that PV prolonged the lag phase. Similar results were observed in four PV-expressing axons. C, Graph showing time to fragmentation of severed axons in control (DsRed- and GCaMP-HS-expressing neurons), PV-expressing neurons, and PV(E61V)-expressing neurons [n = 12 DsRed-expressing neurons, 7 GCaMP-HS-expressing neurons, 23 PV-expressing neurons, and 16 PV(E61V)-expressing neurons]. *p < 0.05. D, Diagram illustrating the protocol for BAPTA-AM experiments. E, Plot of GCaMP-HS fluorescence intensity changes during the terminal calcium wave in control and BAPTA-AM-treated zebrafish, aligned to the time that a calcium rise was first detected. Traces end when axons fragmented. In BAPTA-AM-treated animals, the calcium rise was blunted and the duration of the fragmentation process was prolonged (n = 16 control and 9 BAPTA-AM-treated animals). Also note that calcium levels in BAPTA-AM-treated animals dipped just before they increased. By a Mann–Whitney U test, one time point (−4 min) was significantly different between BAPTA-AM-treated and control traces (p = 0.0321), but differences were not significant at the other time points. F, Plot of time to terminal fragmentation in control and BAPTA-AM-treated animals. BAPTA-AM did not significantly alter the time to calcium increase (n = 16 control and 11 BAPTA-AM-treated animals). G, Plot of time to completion of fragmentation in control and BAPTA-AM-treated animals (n = 11 control and 11 BAPTA-AM-treated animals). **p < 0.01.
Chelating calcium after the initial phase of calcium influx slows zebrafish sensory axon fragmentation
The observation that parvalbumin expression delayed axon fragmentation indicates that calcium plays an instructive role in axon degeneration. However, increasing the length or frequency of the initial calcium influx phase did not alter the kinetics of degeneration (Fig. 4), raising the possibility that calcium's most direct role in WD is during the terminal wave. To reduce calcium in a temporally controlled manner in live zebrafish, we bathed larvae in the cell-permeable chelater BAPTA-AM. Because chelating calcium in a live animal is detrimental to its health, we tested multiple concentrations and methods of BAPTA-AM introduction and chose the regime that caused the least general toxicity to the animals (Fig. 5D). Calcium imaging demonstrated that this manipulation reduced baseline calcium in axons both before and after axotomy (data not shown and Fig. 5E).
Fifteen to 30 min after axotomy, larvae were incubated in BAPTA-AM for 20 min (Fig. 5D). This treatment did not significantly alter the timing of fragmentation onset (Fig. 5F), but dramatically slowed the process of fragmentation (Fig. 5G, Movie 5). In some cases, fragmentation of the detached axon lasted >100 times longer than in controls (Fig. 5G). Fragmentation was also no longer synchronous, usually beginning at an axon tip and slowly progressing through the fragment. Strikingly, the spatial progress of fragmentation always proceeded in the same direction as the preceding terminal calcium wave (Movie 5). These results suggest that the terminal phase of calcium influx plays an instructive role in the execution of axon fragmentation.
BAPTA-AM exposure slows the process of fragmentation. Shown is a time-lapse movie of a sensory neuron expressing DsRed (left) and GCAMP-HS (right). Minutes after axotomy are indicated.
Chelating calcium late, but not early, during WD of cultured mouse sensory neurons delays axon fragmentation
To complement our findings in zebrafish, we evaluated the temporal requirements for calcium during WD in cultured mouse sensory neurons. Many features of WD in cultured neurons are similar to WD in vivo (Vargas and Barres, 2007; Coleman and Freeman, 2010) and cultured neurons provide a clearer setting for pharmacological experiments. DRGs were dissected from E12.5 mouse embryos and grown in culture. At DIV3, axons were severed with a microscalpel and degeneration was scored at 1 h intervals starting at 4 h after axotomy (Fig. 6). In control neurons, most axons had degenerated by 9 h after axotomy, but in neurons treated with 5 mm EGTA, most axons were intact at 9 h after axotomy. When EGTA was added to the culture just before axotomy and removed 2 h later, the timing of axon fragmentation was similar to controls. However, when EGTA was introduced 2 h after axotomy, axons were mostly intact at 9 h after axotomy, similar to when EGTA was present throughout the experiment. These results suggest that extracellular calcium influx relatively late during the lag phase of WD is required for the timely onset of axon fragmentation.
Figure 6.

Chelating calcium late in WD delays axon fragmentation in cultured mouse DRG neurons. A, Experimental design. Shaded areas indicate the period of treatment with 5 mm EGTA. B, Quantification of axon degeneration at the indicated time points after axotomy (see A for legend). Error bars indicate SD (n = 3). C, Representative phase contrast images of uncut and cut DRG axons at 9 h after axotomy. Each condition is labeled as in A.
Discussion
Two waves of cytoplasmic calcium entry during axon degeneration
Understanding how axon physiology changes during WD could provide insight into mechanisms of axon degeneration during pruning, trauma, and disease. In this study, we used live calcium imaging of damaged axons to identify two distinct phases of calcium influx during WD. During the first phase, calcium influx is transient and local to the axotomy site; during the second phase, calcium sweeps throughout the detached axon fragment.
Identifying the specific sources of calcium during each phase of calcium influx could allow independent manipulation of each wave to better understand their specific functions. Calcium can enter the cytoplasm through openings in the plasma membrane created by damage (Ziv and Spira, 1993), through cation channels in the plasma membrane (George et al., 1995; Ghosh-Roy et al., 2010; Knöferle et al., 2010), or from intracellular stores (Ouardouz et al., 2003; Ghosh-Roy et al., 2010; Villegas et al., 2014), all of which have been implicated in WD. During the first phase of calcium influx, passive diffusion through membrane openings is likely the initial source of calcium (Ziv and Spira, 1993) and propagation may occur through plasma membrane calcium channels (Ghosh-Roy et al., 2010). The trigger for the terminal calcium influx phase is unknown, but because EGTA delayed axon fragmentation in cultured mouse DRG neurons undergoing WD (Fig. 6), extracellular calcium is likely essential during the latter part of the lag phase. Inhibitors of voltage-gated calcium channels and ER channels can both delay degeneration (George et al., 1995; Ouardouz et al., 2003; Villegas et al., 2014), suggesting that both calcium sources are likely involved in propagation.
What is the function of the initial phase of calcium entry during axon degeneration?
The initial wave of injury-induced calcium influx traveled into the distal axon fragment, which eventually degenerated, and the proximal axon stump, which did not. Multiple axotomies, which resulted in multiple calcium waves, did not alter the length of the WD lag phase in the distal fragment. Chelating calcium during the first 2 h of the degeneration process in cultured mouse DRG neurons did not affect the timing of axon fragmentation. Together, these observations imply that the initial calcium wave is not sufficient or required to cause degeneration. It has been proposed that WldS protection acts in part by blunting the initial calcium wave (Avery et al., 2012), but we did not detect differences in the magnitude or duration of this initial wave in WldS-protected axons. A study of calcium dynamics in cultured rodent neurons also concluded that WldS did not alter initial calcium entry (Adalbert et al., 2012). The reason for this discrepancy is unclear, but may be due to differences in the experimental systems (live zebrafish and cultured rodent sensory neurons vs exposed Drosophila motor nerves). We propose that WldS acts either independently or downstream of the initial wave of calcium influx.
Our data are consistent with the possibility that, rather than promoting degeneration, the initial calcium wave is benign. This wave may even play a protective role in promoting membrane resealing after axotomy (Yawo and Kuno, 1985; Eddleman et al., 1997; Godell et al., 1997). The local nature of the first phase of calcium influx may explain why it does not immediately destroy the entire detached axon fragment. Large calcium increases during this phase were mostly confined to within 100 μm of the injury site, correlating with the region where mitochondria are damaged (O'Donnell et al., 2013). Mitochondria or other axonal factors beyond this region may move into the injury-proximal area to preserve it throughout the lag phase. In support of this idea, when we cut an axon a second time <100 μm from the original axotomy site, the entire intervening segment often immediately degenerated (Fig. 4B). In principle, it is possible that the initial calcium wave activates a cascade of events, or “timer,” that ultimately causes axon fragmentation. If this were true, then this calcium timer was not affected by exposing cultured neurons to EGTA. Moreover, because additional axotomies in zebrafish neurons neither accelerated nor delayed fragmentation, this timer could only be set once.
What is the function of the terminal phase of calcium entry in axon degeneration?
In contrast to the initial calcium wave, the terminal phase of calcium influx swept through the cytoplasm and mitochondria of the entire axon and always preceded fragmentation by a few minutes. In axons of WldS-expressing neurons, which never fragmented during our experiments, we never detected a later calcium wave, consistent with the hypothesis that the terminal calcium wave causes fragmentation. The global permeation of calcium into the entire axon fragment during this phase could cause fragmentation in at least two ways: activating the protease calpain (Glass et al., 1994; Yang et al., 2013) or overloading mitochondria to trigger opening of the MPTP (Barrientos et al., 2011; Avery et al., 2012; Villegas et al., 2014), leading to energy deficiency and ROS release. However, the quick progression from the initial rise in calcium to axon fragmentation suggests that additional calcium-dependent processes may contribute to fragmentation.
Chelating calcium with three different approaches—expressing parvalbumin in zebrafish sensory neurons, exposing animals to BAPTA-AM after the initial wave, or treating cultured neurons with EGTA late in the lag phase—disrupted WD in different ways, hinting that calcium plays distinct roles at particular times and/or places to regulate fragmentation onset and duration. In zebrafish, parvalbumin expression delayed the onset of fragmentation, whereas BAPTA-AM exposure dramatically slowed the process of fragmentation itself. Chelation with these two methods differed temporally (before vs after axotomy), spatially (in the cytoplasm of just the injured neuron vs throughout the animal), and likely in the degree to which they depleted calcium. The delay in the process of fragmentation caused by BAPTA-AM exposure was variable but dramatic. Strikingly, axon fragmentation always progressed in the same direction as the calcium wave, further strengthening the connection between calcium increases and axonal fragmentation.
Chelating calcium with EGTA in DRG neuron cultures allowed us to test the requirement for cacium early and late during the WD lag phase directly. Chelating calcium starting 30 min before axotomy through the first 2 h of the WD lag phase did not affect the timing of axon degeneration, supporting the notion that the initial calcium wave is benign. In contrast, chelating calcium with EGTA later in the lag phase in DRG cultures and by exposing fish to BAPTA-AM both disrupted fragmentation: EGTA delayed the onset of fragmentation in cultured neurons and BAPTA-AM slowed the process of fragmentation itself in fish. EGTA specifically removes extracellular calcium and, in these experiments, only affected neurons, whereas BAPTA-AM, a membrane-permeable chelator, could have entered subcellular compartments and affected neighboring cells. These differences may have contributed to the slightly distinct outcomes of these experiments, but it is also likely that calcium chelation was less effective in the zebrafish experiments (because fish were not viable in higher concentrations of BAPTA-AM) and thus may not have been sufficient to prevent initial calcium influx events that trigger the terminal calcium wave. Nonetheless, despite their differences, both experiments point to a key role for later calcium influx in axon degeneration.
How the terminal calcium wave in WD is initiated remains a mystery. Determining whether endogenous factors known to regulate WD, such as NMANT2 (Gilley and Coleman, 2010), DLK/JNK (Miller et al., 2009; Xiong and Collins, 2012; Yang et al., 2015), and SARM1 (Osterloh et al., 2012; Gerdts et al., 2013; Yang et al., 2015), affect this calcium wave may provide insight into the molecular events controlling axon destruction.
Footnotes
This work was supported by the National Institutes of Health (Grant 1R01NS083813 to M.T.-L. and Grant R01AR064582 to A.S.). M.E.V. was supported by the EyeSTAR program from the UCLA Jules Stein Eye Institute. Y.Y. was supported by the Japan Society for the Promotion of Science and is currently supported by the International Human Frontier Science Program Organization. We thank Sean Wolfson for help with subcloning; Alaa Koleilat for technical assistance; Luisa Iruela-Arispe for 2-photon microscope access; and Hirohito Shimizu, Robert Esterberg, David Raible, and Koichi Kawakami for plasmids and fish lines.
The authors declare no competing financial interests.
References
- Adalbert R, Gillingwater TH, Haley JE, Bridge K, Beirowski B, Berek L, Wagner D, Grumme D, Thomson D, Celik A, Addicks K, Ribchester RR, Coleman MP. A rat model of slow Wallerian degeneration (WldS) with improved preservation of neuromuscular synapses. Eur J Neurosci. 2005;21:271–277. doi: 10.1111/j.1460-9568.2004.03833.x. [DOI] [PubMed] [Google Scholar]
- Adalbert R, Morreale G, Paizs M, Conforti L, Walker SA, Roderick HL, Bootman MD, Siklós L, Coleman MP. Intra-axonal calcium changes after axotomy in wild-type and slow Wallerian degeneration axons. Neuroscience. 2012;225:44–54. doi: 10.1016/j.neuroscience.2012.08.056. [DOI] [PubMed] [Google Scholar]
- Araki T, Sasaki Y, Milbrandt J. Increased nuclear NAD biosynthesis and SIRT1 activation prevent axonal degeneration. Science. 2004;305:1010–1013. doi: 10.1126/science.1098014. [DOI] [PubMed] [Google Scholar]
- Avery MA, Sheehan AE, Kerr KS, Wang J, Freeman MR. Wld S requires Nmnat1 enzymatic activity and N16-VCP interactions to suppress Wallerian degeneration. J Cell Biol. 2009;184:501–513. doi: 10.1083/jcb.200808042. [DOI] [PMC free article] [PubMed] [Google Scholar]
- Avery MA, Rooney TM, Pandya JD, Wishart TM, Gillingwater TH, Geddes JW, Sullivan PG, Freeman MR. WldS prevents axon degeneration through increased mitochondrial flux and enhanced mitochondrial Ca2+ buffering. Curr Biol. 2012;22:596–600. doi: 10.1016/j.cub.2012.02.043. [DOI] [PMC free article] [PubMed] [Google Scholar]
- Barrientos SA, Martinez NW, Yoo S, Jara JS, Zamorano S, Hetz C, Twiss JL, Alvarez J, Court FA. Axonal degeneration is mediated by the mitochondrial permeability transition pore. J Neurosci. 2011;31:966–978. doi: 10.1523/JNEUROSCI.4065-10.2011. [DOI] [PMC free article] [PubMed] [Google Scholar]
- Berridge MJ. Calcium signalling and Alzheimer's disease. Neurochem Res. 2011;36:1149–1156. doi: 10.1007/s11064-010-0371-4. [DOI] [PubMed] [Google Scholar]
- Breckwoldt MO, Pfister FM, Bradley PM, Marinković P, Williams PR, Brill MS, Plomer B, Schmalz A, St Clair DK, Naumann R, Griesbeck O, **Schwarzländer M, Godinho L, Bareyre FM, Dick TP, Kerschensteiner M, Misgeld T. Multiparametric optical analysis of mitochondrial redox signals during neuronal physiology and pathology in vivo. Nat Med. 2014;20:555–560. doi: 10.1038/nm.3520. [DOI] [PubMed] [Google Scholar]
- Calixto A, Jara JS, Court FA. Diapause formation and downregulation of insulin-like signaling via DAF-16/FOXO delays axonal degeneration and neuronal loss. PLoS Genet. 2012;8:e1003141. doi: 10.1371/journal.pgen.1003141. [DOI] [PMC free article] [PubMed] [Google Scholar]
- Cho Y, Sloutsky R, Naegle KM, Cavalli V. Injury-induced HDAC5 nuclear export is essential for axon regeneration. Cell. 2013;155:894–908. doi: 10.1016/j.cell.2013.10.004. [DOI] [PMC free article] [PubMed] [Google Scholar]
- Coleman MP, Freeman MR. Wallerian degeneration, wld(s), and nmnat. Annu Rev Neurosci. 2010;33:245–267. doi: 10.1146/annurev-neuro-060909-153248. [DOI] [PMC free article] [PubMed] [Google Scholar]
- Coleman MP, Conforti L, Buckmaster EA, Tarlton A, Ewing RM, Brown MC, Lyon MF, Perry VH. An 85-kb tandem triplication in the slow Wallerian degeneration (Wlds) mouse. Proc Natl Acad Sci U S A. 1998;95:9985–9990. doi: 10.1073/pnas.95.17.9985. [DOI] [PMC free article] [PubMed] [Google Scholar]
- Conforti L, Tarlton A, Mack TG, Mi W, Buckmaster EA, Wagner D, Perry VH, Coleman MP. A Ufd2/D4Cole1e chimeric protein and overexpression of Rbp7 in the slow Wallerian degeneration (WldS) mouse. Proc Natl Acad Sci U S A. 2000;97:11377–11382. doi: 10.1073/pnas.97.21.11377. [DOI] [PMC free article] [PubMed] [Google Scholar]
- Conforti L, Wilbrey A, Morreale G, Janeckova L, Beirowski B, Adalbert R, Mazzola F, Di Stefano M, Hartley R, Babetto E, Smith T, Gilley J, Billington RA, Genazzani AA, Ribchester RR, Magni G, Coleman M. Wld S protein requires Nmnat activity and a short N-terminal sequence to protect axons in mice. J Cell Biol. 2009;184:491–500. doi: 10.1083/jcb.200807175. [DOI] [PMC free article] [PubMed] [Google Scholar]
- Eddleman CS, Ballinger ML, Smyers ME, Godell CM, Fishman HM, Bittner GD. Repair of plasmalemmal lesions by vesicles. Proc Natl Acad Sci U S A. 1997;94:4745–4750. doi: 10.1073/pnas.94.9.4745. [DOI] [PMC free article] [PubMed] [Google Scholar]
- Esterberg R, Hailey DW, Coffin AB, Raible DW, Rubel EW. Disruption of intracellular calcium regulation is integral to aminoglycoside-induced hair cell death. J Neurosci. 2013;33:7513–7525. doi: 10.1523/JNEUROSCI.4559-12.2013. [DOI] [PMC free article] [PubMed] [Google Scholar]
- Esterberg R, Hailey DW, Rubel EW, Raible DW. ER-mitochondrial calcium flow underlies vulnerability of mechanosensory hair cells to damage. J Neurosci. 2014;34:9703–9719. doi: 10.1523/JNEUROSCI.0281-14.2014. [DOI] [PMC free article] [PubMed] [Google Scholar]
- Fang Y, Soares L, Teng X, Geary M, Bonini NM. A novel Drosophila model of nerve injury reveals an essential role of Nmnat in maintaining axonal integrity. Curr Biol. 2012;22:590–595. doi: 10.1016/j.cub.2012.01.065. [DOI] [PMC free article] [PubMed] [Google Scholar]
- Feng Y, Yan T, Zheng J, Ge X, Mu Y, Zhang Y, Wu D, Du JL, Zhai Q. Overexpression of Wld(S) or Nmnat2 in mauthner cells by single-cell electroporation delays axon degeneration in live zebrafish. J Neurosci Res. 2010;88:3319–3327. doi: 10.1002/jnr.22498. [DOI] [PubMed] [Google Scholar]
- George EB, Glass JD, Griffin JW. Axotomy-induced axonal degeneration is mediated by calcium influx through ion-specific channels. J Neurosci. 1995;15:6445–6452. doi: 10.1523/JNEUROSCI.15-10-06445.1995. [DOI] [PMC free article] [PubMed] [Google Scholar]
- Gerdts J, Summers DW, Sasaki Y, DiAntonio A, Milbrandt J. Sarm1-mediated axon degeneration requires both SAM and TIR interactions. J Neurosci. 2013;33:13569–13580. doi: 10.1523/JNEUROSCI.1197-13.2013. [DOI] [PMC free article] [PubMed] [Google Scholar]
- Ghosh-Roy A, Wu Z, Goncharov A, Jin Y, Chisholm AD. Calcium and cyclic AMP promote axonal regeneration in Caenorhabditis elegans and require DLK-1 kinase. J Neurosci. 2010;30:3175–3183. doi: 10.1523/JNEUROSCI.5464-09.2010. [DOI] [PMC free article] [PubMed] [Google Scholar]
- Gilley J, Coleman MP. Endogenous Nmnat2 is an essential survival factor for maintenance of healthy axons. PLoS Biol. 2010;8:e1000300. doi: 10.1371/journal.pbio.1000300. [DOI] [PMC free article] [PubMed] [Google Scholar]
- Glass JD, Schryer BL, Griffin JW. Calcium-mediated degeneration of the axonal cytoskeleton in the Ola mouse. J Neurochem. 1994;62:2472–2475. doi: 10.1046/j.1471-4159.1994.62062472.x. [DOI] [PubMed] [Google Scholar]
- Godell CM, Smyers ME, Eddleman CS, Ballinger ML, Fishman HM, Bittner GD. Calpain activity promotes the sealing of severed giant axons. Proc Natl Acad Sci U S A. 1997;94:4751–4756. doi: 10.1073/pnas.94.9.4751. [DOI] [PMC free article] [PubMed] [Google Scholar]
- Hoopfer ED, McLaughlin T, Watts RJ, Schuldiner O, O'Leary DD, Luo L. Wlds protection distinguishes axon degeneration following injury from naturally occurring developmental pruning. Neuron. 2006;50:883–895. doi: 10.1016/j.neuron.2006.05.013. [DOI] [PubMed] [Google Scholar]
- Kanamori T, Kanai MI, Dairyo Y, Yasunaga K, Morikawa RK, Emoto K. Compartmentalized calcium transients trigger dendrite pruning in Drosophila sensory neurons. Science. 2013;340:1475–1478. doi: 10.1126/science.1234879. [DOI] [PubMed] [Google Scholar]
- Kerschensteiner M, Schwab ME, Lichtman JW, Misgeld T. In vivo imaging of axonal degeneration and regeneration in the injured spinal cord. Nat Med. 2005;11:572–577. doi: 10.1038/nm1229. [DOI] [PubMed] [Google Scholar]
- Kitay BM, McCormack R, Wang Y, Tsoulfas P, Zhai RG. Mislocalization of neuronal mitochondria reveals regulation of Wallerian degeneration and NMNAT/WLD(S)-mediated axon protection independent of axonal mitochondria. Hum Mol Genet. 2013;22:1601–1614. doi: 10.1093/hmg/ddt009. [DOI] [PMC free article] [PubMed] [Google Scholar]
- Knöferle J, Koch JC, Ostendorf T, Michel U, Planchamp V, Vutova P, Tönges L, Stadelmann C, Brück W, Bähr M, Lingor P. Mechanisms of acute axonal degeneration in the optic nerve in vivo. Proc Natl Acad Sci U S A. 2010;107:6064–6069. doi: 10.1073/pnas.0909794107. [DOI] [PMC free article] [PubMed] [Google Scholar]
- Kwan KM, Fujimoto E, Grabher C, Mangum BD, Hardy ME, Campbell DS, Parant JM, Yost HJ, Kanki JP, Chien CB. The Tol2kit: a multisite gateway-based construction kit for Tol2 transposon transgenesis constructs. Dev Dyn. 2007;236:3088–3099. doi: 10.1002/dvdy.21343. [DOI] [PubMed] [Google Scholar]
- Lai SL, Lee T. Genetic mosaic with dual binary transcriptional systems in Drosophila. Nat Neurosci. 2006;9:703–709. doi: 10.1038/nn1681. [DOI] [PubMed] [Google Scholar]
- Lister JA, Robertson CP, Lepage T, Johnson SL, Raible DW. nacre encodes a zebrafish microphthalmia-related protein that regulates neural-crest-derived pigment cell fate. Development. 1999;126:3757–3767. doi: 10.1242/dev.126.17.3757. [DOI] [PubMed] [Google Scholar]
- Lunn ER, Perry VH, Brown MC, Rosen H, Gordon S. Absence of Wallerian Degeneration does not hinder regeneration in peripheral nerve. Eur J Neurosci. 1989;1:27–33. doi: 10.1111/j.1460-9568.1989.tb00771.x. [DOI] [PubMed] [Google Scholar]
- Mack TG, Reiner M, Beirowski B, Mi W, Emanuelli M, Wagner D, Thomson D, Gillingwater T, Court F, Conforti L, Fernando FS, Tarlton A, Andressen C, Addicks K, Magni G, Ribchester RR, Perry VH, Coleman MP. Wallerian degeneration of injured axons and synapses is delayed by a Ube4b/Nmnat chimeric gene. Nat Neurosci. 2001;4:1199–1206. doi: 10.1038/nn770. [DOI] [PubMed] [Google Scholar]
- Martin SM, O'Brien GS, Portera-Cailliau C, Sagasti A. Wallerian degeneration of zebrafish trigeminal axons in the skin is required for regeneration and developmental pruning. Development. 2010;137:3985–3994. doi: 10.1242/dev.053611. [DOI] [PMC free article] [PubMed] [Google Scholar]
- Mattson MP. Calcium and neurodegeneration. Aging Cell. 2007;6:337–350. doi: 10.1111/j.1474-9726.2007.00275.x. [DOI] [PubMed] [Google Scholar]
- Miller BR, Press C, Daniels RW, Sasaki Y, Milbrandt J, DiAntonio A. A dual leucine kinase-dependent axon self-destruction program promotes Wallerian degeneration. Nat Neurosci. 2009;12:387–389. doi: 10.1038/nn.2290. [DOI] [PMC free article] [PubMed] [Google Scholar]
- Mishra B, Carson R, Hume RI, Collins CA. Sodium and potassium currents influence Wallerian degeneration of injured Drosophila axons. J Neurosci. 2013;33:18728–18739. doi: 10.1523/JNEUROSCI.1007-13.2013. [DOI] [PMC free article] [PubMed] [Google Scholar]
- Muto A, Ohkura M, Kotani T, Higashijima S, Nakai J, Kawakami K. Genetic visualization with an improved GCaMP calcium indicator reveals spatiotemporal activation of the spinal motor neurons in zebrafish. Proc Natl Acad Sci U S A. 2011;108:5425–5430. doi: 10.1073/pnas.1000887108. [DOI] [PMC free article] [PubMed] [Google Scholar]
- O'Brien GS, Rieger S, Martin SM, Cavanaugh AM, Portera-Cailliau C, Sagasti A. Two-photon axotomy and time-lapse confocal imaging in live zebrafish embryos. J Vis Exp. 2009;pii:1129. doi: 10.3791/1129. [DOI] [PMC free article] [PubMed] [Google Scholar]
- O'Donnell KC, Vargas ME, Sagasti A. WldS and PGC-1alpha regulate mitochondrial transport and oxidation state after axonal injury. J Neurosci. 2013;33:14778–14790. doi: 10.1523/JNEUROSCI.1331-13.2013. [DOI] [PMC free article] [PubMed] [Google Scholar]
- Osterloh JM, Yang J, Rooney TM, Fox AN, Adalbert R, Powell EH, Sheehan AE, Avery MA, Hackett R, Logan MA, MacDonald JM, Ziegenfuss JS, Milde S, Hou YJ, Nathan C, Ding A, Brown RH, Jr, Conforti L, Coleman M, Tessier-Lavigne M, Züchner S, Freeman MR. dSarm/Sarm1 is required for activation of an injury-induced axon death pathway. Science. 2012;337:481–484. doi: 10.1126/science.1223899. [DOI] [PMC free article] [PubMed] [Google Scholar]
- Ouardouz M, Nikolaeva MA, Coderre E, Zamponi GW, McRory JE, Trapp BD, Yin X, Wang W, Woulfe J, Stys PK. Depolarization-induced Ca2+ release in ischemic spinal cord white matter involves L-type Ca2+ channel activation of ryanodine receptors. Neuron. 2003;40:53–63. doi: 10.1016/j.neuron.2003.08.016. [DOI] [PubMed] [Google Scholar]
- Provost E, Rhee J, Leach SD. Viral 2A peptides allow expression of multiple proteins from a single ORF in transgenic zebrafish embryos. Genesis. 2007;45:625–629. doi: 10.1002/dvg.20338. [DOI] [PubMed] [Google Scholar]
- Pusl T, Wu JJ, Zimmerman TL, Zhang L, Ehrlich BE, Berchtold MW, Hoek JB, Karpen SJ, Nathanson MH, Bennett AM. Epidermal growth factor-mediated activation of the ETS domain transcription factor Elk-1 requires nuclear calcium. J Biol Chem. 2002;277:27517–27527. doi: 10.1074/jbc.M203002200. [DOI] [PubMed] [Google Scholar]
- Rieger S, Sagasti A. Hydrogen peroxide promotes injury-induced peripheral sensory axon regeneration in the zebrafish skin. PLoS Biol. 2011;9:e1000621. doi: 10.1371/journal.pbio.1000621. [DOI] [PMC free article] [PubMed] [Google Scholar]
- Rosenberg AF, Wolman MA, Franzini-Armstrong C, Granato M. In vivo nerve-macrophage interactions following peripheral nerve injury. J Neurosci. 2012;32:3898–3909. doi: 10.1523/JNEUROSCI.5225-11.2012. [DOI] [PMC free article] [PubMed] [Google Scholar]
- Schlaepfer WW. Structural alterations of peripheral nerve induced by the calcium ionophore A23187. Brain Res. 1977;136:1–9. doi: 10.1016/0006-8993(77)90126-3. [DOI] [PubMed] [Google Scholar]
- Schlaepfer WW, Bunge RP. Effects of calcium ion concentration on the degeneration of amputated axons in tissue culture. J Cell Biol. 1973;59:456–470. doi: 10.1083/jcb.59.2.456. [DOI] [PMC free article] [PubMed] [Google Scholar]
- Schlaepfer WW, Zimmerman UJ. Mechanisms underlying the neuronal response to ischemic injury: calcium-activated proteolysis of neurofilaments. Prog Brain Res. 1985;63:185–196. doi: 10.1016/S0079-6123(08)61983-4. [DOI] [PubMed] [Google Scholar]
- Uemura O, Okada Y, Ando H, Guedj M, Higashijima S, Shimazaki T, Chino N, Okano H, Okamoto H. Comparative functional genomics revealed conservation and diversification of three enhancers of the isl1 gene for motor and sensory neuron-specific expression. Dev Biol. 2005;278:587–606. doi: 10.1016/j.ydbio.2004.11.031. [DOI] [PubMed] [Google Scholar]
- Vargas ME, Barres BA. Why is Wallerian degeneration in the CNS so slow? Annu Rev Neurosci. 2007;30:153–179. doi: 10.1146/annurev.neuro.30.051606.094354. [DOI] [PubMed] [Google Scholar]
- Villegas R, Martinez NW, Lillo J, Pihan P, Hernandez D, Twiss JL, Court FA. Calcium release from intra-axonal endoplasmic reticulum leads to axon degeneration through mitochondrial dysfunction. J Neurosci. 2014;34:7179–7189. doi: 10.1523/JNEUROSCI.4784-13.2014. [DOI] [PMC free article] [PubMed] [Google Scholar]
- Waller A. Experiments on the section of the glossopharyngeal and hypoglossal nerves of the frog, and observations of the alterations produced thereby in the structure of their primitive fibres. Philos Trans R Soc Lond. 1850;140:423–478. [Google Scholar]
- Wang JT, Barres BA. Axon degeneration: where the Wlds things are. Curr Biol. 2012;22:R221–R223. doi: 10.1016/j.cub.2012.02.056. [DOI] [PMC free article] [PubMed] [Google Scholar]
- Xiong X, Collins CA. A conditioning lesion protects axons from degeneration via the Wallenda/DLK MAP kinase signaling cascade. J Neurosci. 2012;32:610–615. doi: 10.1523/JNEUROSCI.3586-11.2012. [DOI] [PMC free article] [PubMed] [Google Scholar]
- Yang J, Weimer RM, Kallop D, Olsen O, Wu Z, Renier N, Uryu K, Tessier-Lavigne M. Regulation of axon degeneration after injury and in development by the endogenous calpain inhibitor calpastatin. Neuron. 2013;80:1175–1189. doi: 10.1016/j.neuron.2013.08.034. [DOI] [PubMed] [Google Scholar]
- Yang J, Wu Z, Renier N, Simon DJ, Uryu K, Park DS, Greer PA, Tournier C, Davis RJ, Tessier-Lavigne M. Pathological axonal death through a MAPK cascade that triggers a local energy deficit. Cell. 2015;160:161–176. doi: 10.1016/j.cell.2014.11.053. [DOI] [PMC free article] [PubMed] [Google Scholar]
- Yawo H, Kuno M. Calcium dependence of membrane sealing at the cut end of the cockroach giant axon. J Neurosci. 1985;5:1626–1632. doi: 10.1523/JNEUROSCI.05-06-01626.1985. [DOI] [PMC free article] [PubMed] [Google Scholar]
- Zhao Y, Araki S, Wu J, Teramoto T, Chang YF, Nakano M, Abdelfattah AS, Fujiwara M, Ishihara T, Nagai T, Campbell RE. An expanded palette of genetically encoded Ca(2)(+) indicators. Science. 2011;333:1888–1891. doi: 10.1126/science.1208592. [DOI] [PMC free article] [PubMed] [Google Scholar]
- Ziv NE, Spira ME. Spatiotemporal distribution of Ca2+ following axotomy and throughout the recovery process of cultured Aplysia neurons. Eur J Neurosci. 1993;5:657–668. doi: 10.1111/j.1460-9568.1993.tb00531.x. [DOI] [PubMed] [Google Scholar]
Associated Data
This section collects any data citations, data availability statements, or supplementary materials included in this article.
Supplementary Materials
Calcium wave induced by axotomy travels away from the injury site. Shown is a time-lapse movie of a sensory neuron expressing DsRed and GCAMP-HS. Minutes after axotomy are indicated.
Terminal calcium wave precedes fragmentation. Shown is a time-lapse movie of a sensory neuron expressing DsRed and GCAMP-HS. Minutes after axotomy are indicated.
Mitochondrial calcium increases at the end of the WD lag phase. Shown is a time-lapse movie of a sensory neuron expressing DsRed (left) and Mito-GCaMP-HS (right). Seconds after axotomy are indicated.
WldS does not alter the initial calcium wave induced by axotomy. Shown is a time-lapse movie of a sensory neuron expressing DsRed, GCaMP-HS, and WldS. Seconds after axotomy are indicated.
BAPTA-AM exposure slows the process of fragmentation. Shown is a time-lapse movie of a sensory neuron expressing DsRed (left) and GCAMP-HS (right). Minutes after axotomy are indicated.