

Abstract

Quantification of proteomes by mass spectrometry has proven to be useful to study human pathology recapitulated in cellular or animal models of disease. Enriching and quantifying newly synthesized proteins (NSPs) at set time points by mass spectrometry has the potential to identify important early regulatory or expression changes associated with disease states or perturbations. NSP can be enriched from proteomes by employing pulsed introduction of the noncanonical amino acid, azidohomoalanine (AHA). We demonstrate that pulsed introduction of AHA in the feed of mice can label and identify NSP from multiple tissues. Furthermore, we quantitate differences in new protein expression resulting from CRE-LOX initiated knockout of LKB1 in mouse livers. Overall, the PALM strategy allows for the first time in vivo labeling of mouse tissues to differentiate protein synthesis rates at discrete time points.
Keywords: azidohomoalanine, newly synthesized proteins, proteomics, mass spectrometry, BONCAT, LKB1, quantitation
Introduction
Animal models of disease are important tools for biomedical researchers to understand human pathology, identify relevant drug targets, and develop new drug therapies. These models, generated through genetic or pharmacological manipulation, are employed in a wide range of fields including cancer biology, vascular biology, neuroscience, inflammatory disease, infectious disease, and metabolic disorders. To gain novel insight into pathogenesis in a complex organism, large-scale mass spectrometry (MS)-based proteomic strategies are widely used.1−4 For example, quantitative proteomics was used to identify up-regulation of beta calcium/calmodulin-dependent protein kinase type II expression in the lateral habenula of an animal model of depression, and upregulation of CAMKII was demonstrated to be necessary for the depressive phenotype.5 Special diets have been developed to completely label the rodent proteome with heavy nitrogen (15N) or heavy lysine that has identified aberrant protein abundances to quantify proteomic differences between the disease model and control.6−8
Proteomic data sets used for large-scale studies consist of thousands of quantified proteins, with potentially a small subset altered in the disease model. In the midst of such a large number of proteins it is often difficult to pinpoint the subtle changes related to the root molecular mechanism in these animal models at time points prior to gross pathological changes when protein quantification becomes complicated by responses to end-stage disease. At early time points alterations in protein expression may be less complicated but they are small and difficult to identify, obscured by the overwhelming static proteome. Methods to use stable isotope-labeled amino acids have been developed to measure new protein expression and protein turnover, but these methods can be confounded by low-level new changes occurring in the background of highly abundant proteins. Because changes in translation can occur before observable changes in phenotype, this may increase the sensitivity of large-scale proteomics to detect subtle, aberrant changes in protein expression.
To enrich and measure the expression of new proteins, Dieterich et al. synthesized Azidohomoalanine (AHA), a noncanonical amino acid that is accepted by the endogenous methionine tRNA and inserted into proteins in vivo.9 AHA can be enriched using “click chemistry” by reacting the azide of AHA to a biotin-alkyne. Thus, AHA-containing proteins or peptides can be enriched and efficiently separated from the whole proteome. By replacing methionine with AHA in culture media, AHA can be readily incorporated into proteins of cells in culture, but it has also been successfully incorporated into zebrafish, C. elegans, tadpoles, brain slices, and rodent retina proteins.9−14 This paper describes an approach, PALM (Pulse AHA Labeling in Mammals), to incorporate AHA into the entire rodent proteome for quantitative tissue proteomic analysis of NSP in animal models of disease at discrete time points.
Results and Discussion
A diet was developed to replace methionine with AHA. A standard rodent diet has a methionine concentration of 8.2 g/kg. For the PALM diet, methionine was replaced with AHA at 2 g/kg. For the control diet, methionine was added at 2 g/kg. Other amino acid concentrations were altered from the standard diet to compensate for the reduced methionine (Table S-1). The goal of the first set of experiments was to determine the safety of the PALM diet and the labeling time needed to detect AHA proteins in tissue. Unlike other rodent labeling methods that seek complete proteome labeling with 15N or heavy lysine, this experiment sought to determine a minimal labeling time to identify the NSP proteome. Mice were placed on the PALM (N = 3) or control diet (N = 3), and a mouse from each group was sacrificed at 2, 4, or 6 days. This experiment was performed in triplicate for a total of 18 mice. No obvious differences in gross behavior or physical appearance were observed between the mice on the two diets (data not shown). There also were no statistical differences between weights of the mice on the two diets (Figure 1A). Previously published reports have demonstrated that a reduction of methionine in the diet increases a rodent’s lifespan.15,16 There were no reports that could be found on the complete removal of methionine from the diet. Mice given a diet with the complete removal of methionine and choline have been reported to develop symptoms of nonalcoholic steatohepatitis in the liver after 4 weeks, but these symptoms are not present at 2 weeks.17−19
Figure 1.

(A) There were no statistical differences in weight observed between mice on the control and PALM diets. Three mice were given the control (blue) or PALM (orange) diet for 2, 4, or 6 days. A Student’s t test was performed between the control and PALM mice at each time point. N = 3 for each time point. (B) Robust detection on AHA proteins by immunoblot analysis after 4 days on the PALM diet. After click reactions, immunoblot analysis was performed on the brain, liver, heart, and lung of nine mice (i.e., N = 3 per time point) on the PALM diet. The biotin-alkyne modification was detected with streptavidin-HRP. The y axis represents normalized pixel intensity (NPI), pixel intensity of streptavidin immunoreactivity divided by the pixel intensity of actin immunoreactivity, the loading control. (C) Representative immunoblot from the graph in C of brain tissue. (D) No AHA proteins were detected in mice on the control diet. Liver homogenates from three mice on the control diet and three mice on the PALM diet for 6 days were probed with streptavidin-HRP after click reactions (left panel). The right panel shows a Coomassie stain of the same samples. (E) AHA proteins were detected in multiple subcellular fractions. Brain tissue from a mouse on the PALM diet for 4 days was fractionated on a sucrose gradient. Nuclear (Nuc), synaptosomal (Syn), and mitochondrial (Mito) fractions were processed in an identical manner as the whole tissue homogenates.
Brain, heart, liver, and lung tissues were dissected from all of the mice. After homogenization, a click reaction was performed on each tissue to covalently react biotin-alkyne to any AHA molecule that was inserted into a protein. Specifically, the Cu(I)-catalyzed stepwise version of Huisgen’s azide–alkyne cycloaddition was employed.20 Next, the tissue homogenates were separated by gel electrophoresis, and streptavidin tagged to horseradish peroxidase was used to detect the biotin-alkynes. Biotin-alkynes were detected at 2 days in all tissues, but there was a much larger increase at 4 and 6 days (Figure 1B,C). Biotin-alkyne was not detected in mice on the control diet (Figure 1D). Fractionation of brain tissue from mice on the PALM diet for 4 days revealed biotin-alkyne in the mitochondrial, nuclear, and synaptosomal fractions (Figure 1E). Overall, this analysis showed that less than a week of the PALM diet is sufficient to incorporate AHA safely into the proteome of multiple tissues and subcellular organelles.
Next, the proteins tagged by AHA pulse labeling at 2, 4, and 6 days were identified using 2-D liquid chromatography-tandem mass spectrometry (2DLC–MS/MS) and protein database searching. The DiDBiT (direct identification of biotin tags) method was employed for direct detection of the AHA-biotin-alkyne modification10 (Figure 2). After the click reaction the proteins were digested with trypsin and the AHA-biotin-alkyne peptides were enriched with neutravidin beads. The modified peptides were then eluted off the beads for MS analysis and the acquired spectra were searched for the AHA-biotin-alkyne mass shift. Detection of the AHA-biotin-alkyne tag on a peptide confirmed the peptide was from a newly synthesized protein. 2DLC–MS/MS analysis of brain tissue from a mouse on the PALM diet for 2 days resulted in the identification of 642 AHA peptides corresponding to 425 proteins (Figure 3A). There were 842 unmodified peptides, which corresponded to 397 proteins in the same analysis. With brain tissue from a mouse on the PALM diet for 4 days, there were 8642 AHA peptides identified from 2951 proteins and 875 unmodified peptides from 441 proteins. With brain tissue from a mouse on the PALM diet for 6 days, there were 6810 AHA peptides identified from 2811 proteins and 1037 unmodified peptides from 482 proteins. Ninety-five percent of the AHA proteins identified at 2 days were identified at the 4 and 6 day time points (Figure 3B). For a control experiment, brain tissue from a mouse on the PALM diet for 6 days was analyzed identically as described except without neutravidin enrichment. This MS analysis identified 44 AHA peptides from 30 proteins and 22801 unmodified peptides from 4028 proteins. Therefore, neutravidin enrichment is necessary prior to MS analysis due to the low abundance of the AHA proteins in the whole proteome. Furthermore, 38% of the proteins identified in the brain PALM proteome were not identified in the control (Figure 3C). Analysis of spectral count data, which loosely correlates with protein abundance, was performed on the proteins that were identified in both PALM and control experiments, and this analysis shows an enrichment of proteins in the PALM strategy (Figure 3D). This demonstrates that PALM analysis identifies proteins not observed in a standard whole proteome strategy. Finally, the AHA protein identifications from liver and brain tissues were compared from the same mice. In contrast with the overlap in Figure 3B, only 51% of the AHA proteins in the brain were also identified in the liver (Figure 3E). This is consistent with previous mass spectrometry analyses demonstrating differences between tissue proteomes using whole proteome or phosphorylation analyses.21,22 Overall, these data suggest that 4 to 6 days on the PALM diet is sufficient for a robust MS analysis of newly synthesized proteins from mouse tissues.
Figure 2.
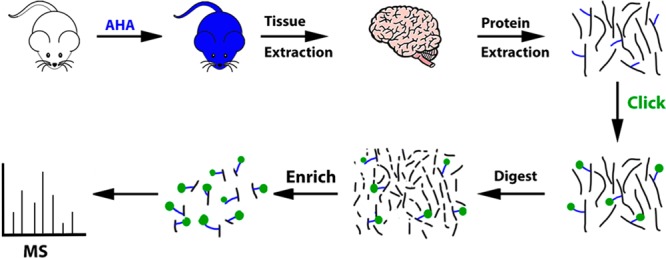
Schematic of the PALM for MS analysis. After feeding mice the PALM diet for 4 days, the mice were sacrificed and the tissues are extracted. The tissue was homogenized and the proteins (black lines) were solubilized. The blue lines represent the AHA molecule. Click reaction was performed on the proteins to covalently add a biotin-alkyne (green circle) to the AHA molecule incorporated in the proteins. Tryptic digestion was performed. Peptides with the AHA-biotin-alkyne modification were enriched with neutravidin beads. The beads were washed to remove unmodified peptides. The modified peptides were eluted off the beads and the eluate was analyzed by MS to identify newly synthesized proteins.
Figure 3.

(A) AHA modified (black) and unmodified (gray) proteins identified by MS from brain tissue extracted from mice on the PALM diet for a different number of days. For control, 6(No Enrich), a brain from a mouse on the PALM diet for 6 days was analyzed without neutravidin enrichment. (B) Venn diagram of the AHA protein identifications after neutravidin enrichment from panel A. (C) Venn diagram of the AHA protein identifications in panel B and the unmodified proteins identified from the “6(no enrich)” control. (D) Spectral count analysis of the protein identifications shared between control and PALM brain analyses in panel C. For each analysis, the spectral count for each protein was normalized to the total spectral count identified. Each protein is plotted with by the ratio of AHA spectral count over the spectral count from the control analysis on the y axis. The ratio was transformed by the natural log. (E) Venn diagram of the AHA protein identifications in panel B and the AHA protein identifications from liver tissue of the same mice after 2, 4, and 6 days of the PALM diet.
The next goal was to quantify the MS analysis of the AHA pulsed labeled tissues. Although label-free quantification is possible for any sample, the use of heavy stable isotopes provides a more accurate quantitative measurement.23 An unlabeled or “light” biotin-alkyne (C16H24N4O3S) and identical but “heavy” biotin-alkyne with heavy stable isotopes (C13H24N3O3S–13C315N) were synthesized to use in the quantitation of two biological samples. To our knowledge, this is the first use of a heavy biotin-alkyne for quantitative MS analysis. An analysis was performed on liver tissue from mice with a CRE-LOX triggered deletion (KO) of LKB1 (liver kinase B1) and liver tissue (WT) from control mice to test the utility of this novel quantitation method24(Figure S-1). Light biotin-alkyne was reacted with the KO liver homogenate and heavy biotin-alkyne was reacted with the WT liver homogenate. After the click reactions, the KO and WT samples were mixed 1:1 (w/w) and then processed together. One potential problem is that the quantitation is performed after the samples have undergone numerous independent manipulations (i.e., homogenization, solubilization, click chemistry), which may produce systematic quantitative errors.25 One KO and one WT liver were processed three times independently to measure technical reproducibility. A similar number of AHA proteins were identified in the three replicates (Figure 4A). Unique AHA proteins were identified in each replicate analysis, confirming that for complex samples increased MS analysis results in more unique protein identifications.26 Next, the ion chromatograms for the light and heavy AHA peptide pairs were extracted and heavy/light ratios were calculated. The heavy/light AHA peptide ratios were highly correlated (r > 0.7) between replicates (Figure 4B and Figure S-2). Next, additional WT and KO livers were processed as previously described and the biological replicates were compared. A similar distribution of heavy/light AHA peptide ratios was observed between these biological experiments. (Figure 4C). When these peptide ratios were averaged for NSP ratios, the correlation coefficient between the proteins quantified in both biological replicates was 0.6 (Figure 4D). Deletion of LKB1 results in loss of AMPK (5′ adenosine monophosphate-activated protein kinase) activity, which is an essential signaling molecule that regulates the cellular response to low energy. As a result, the livers of LKB1 KO mice have increased levels of fatty acid synthesis and gluconeogenesis producing hyperglycemia and fatty liver resembling type 2 diabetes.24 Functional pathway analysis on the NSP that was altered between WT and KO livers in both biological replicates revealed a significant enrichment of proteins involved in gluconeogenesis (p value = 2.44 × 10⁻⁹) and fatty acid metabolism (p value = 4.31 × 10⁻¹³). All proteins assigned to the gluconeogenesis pathway were increased in the KO livers, with the largest change observed for the PEPCK (phosphoenolpyruvate carboxykinase) protein, which has previously been demonstrated to increase in LKB1 KO livers24 (Figure 4E). The proteins assigned to fatty acid metabolism were not uniformly changed upon LKB1 deletion, although some of these proteins may be involved in multiple pathways. For example, the mitochondrial proteins, such as CP1A2, possess other functions besides fatty acid metabolism, and the LKB1 KO has been reported to produce mitochondria dysfunction.27 Overall, these experiments demonstrate that quantification of the NSP tissue proteome with heavy biotin-alkynes is accurate and reproducible and changes reflecting biological perturbations can be identified and quantitated.
Figure 4.

(A) Similar number of NSPs is identified in replicate analyses. One KO liver and one WT liver were prepared three times independently. The KO samples were labeled with light biotin-alkyne and the WT were labeled with heavy biotin-alkyne using click chemistry. The three heavy/light peptide samples were then enriched for the biotin-alkyne and analyzed by MS. Proteins identified in all three replicates are in blue and proteins unique to each run are in orange. (B) High correlation between quantified peptides in technical replicates. The proteins in panel A were quantified and the correlation was calculated between the replicates (r = 0.77). The natural log of the heavy/light ratio is plotted for AHA-biotin-alkyne peptides shared between the replicates. Other replicate comparisons are in Supplementary Figure 2. (C) Similar peptide ratio distributions from NSP between two biological replicates of WT and KO mouse livers. The experiment in panels A and B was repeated with different WT and KO livers to access biological reproducibility. The calculated heavy/light AHA-biotin-alkyne peptide ratio distributions are plotted for biological #1 (NSP #1) and biological replicate #2 (NSP#2). X axis is the natural log of the heavy/light ratio and y axis is the percentage of heavy/light ratios for each bin on the x axis. (D) Heavy/light average NSP ratios quantitated in both NSP#1 and NSP#2 have a correlation (r) of 0.61. Axes are the natural log of the protein ratios. (E) Quantitated NSP annotated to gluconeogenesis (ALDOB, ENOA, F16P1, G6P1, MDHC, MDHM, PCKGC, PGAM1, and ACADL) and fatty acid metabolism (ACSL1, ACSL5, ADH1, AK1D1, AL3A2, CP1A2, CP2CT, CP2E1, CP2F2, CP3AB, ECH1, ECL1, SDHL, and THIKA) pathways. The y axis is the natural log of the average WT/KO NSP ratio of two biological replicates.
Conclusions
Quantitative proteomic analysis of animal models of disease has become an essential tool in biomedical research. Temporal resolution is essential in the study of pathology because the earliest proteomic alterations can be more indicative of the molecular determinants of disease and may harbor optimal candidates to prevent or correct the disease phenotype. The ability to remove pre-existing proteins and analyze only proteins synthesized in a short time period by exploiting the noncanonical amino acid AHA has been theorized to improve the sensitivity and temporal resolution of quantitative proteomics. While this strategy has been largely limited to cell culture, a short 3 h labeling in tadpole retina showed incorporation of AHA.10 In the tadpole experiment AHA was directly injected into the optic retina, whereas in this experiment mice were fed a diet containing AHA requiring systemic distribution to tissues prior to incorporation. Previous published MS proteomic strategies have labeled entire rodents with heavy stable isotopes and required several months to achieve labeling.6,28 This report demonstrates that incorporating AHA in a rodent diet can identify thousands of NSP after only 4 days of labeling. This short labeling time has the potential to analyze the NSP proteome at multiple time points during the manifestation of a disease phenotype. Similar to phosphorylated peptide enrichment strategies,22 these data suggest that enrichment of NSP allows for analysis of low abundant proteins that are not identified by whole proteome analysis. This report also presents the first use of biotin-alkynes synthesized with heavy stable isotopes for the quantification of MS data. This quantitation strategy was reproducible for both technical and biological replicates. As a proof-of-principle experiment, reproducible and quantitative protein expression changes were observed between WT and KO LKB1 livers, which were consistent with previous studies24,27 but also revealed new proteins involved the in vivo LBK1 signaling pathway. Although this paper focuses on MS discovery-based analyses, the PALM tissues can be employed in targeted non-MS quantitated studies with protein specific antibodies as previously reported.11 In summary, this study demonstrates a novel MS strategy to identify and quantify newly synthesized proteins from rodent tissues.
Material and Methods
Animals
Eighteen male 1-month-old C57BL/6 mice were analyzed in the first experiment (Figure 1). Animals were housed in plastic cages located inside a temperature- and humidity-controlled animal colony and were maintained on a reversed day/night cycle (lights on from 7:00 P.M. to 7:00 A.M.). Animal facilities were AAALAC-approved, and protocols were in accordance with the IACUC. Three separate experiments were performed. Each individual experiment consisted of six littermates housed with three mice per cage. Harlan laboratories prepared the PALM and control mouse pellets. Two grams of azidohomoalanine (Anaspec, Freemont, CA) was used to make 1 kg of mouse pellet. The complete ingredients of the PALM and control pellets are listed in Supplementary Table 1. Each cage of mice was given either the PALM diet or control diet ad libitum on Day 0. The mice were examined daily for gross changes in behavior or physical appearance. One mouse per cage was sacrificed by isoflurane inhalation on Days 2, 4, and 6. The whole tissues were quickly removed and snap-frozen in liquid nitrogen. This experiment was performed in triplicate.
The knockout LKB1 mice and the control mice were generated in a manner similar to that previously described.24 In brief, mice that were generated were either wild-type for LKB1 (Stk11)+/+ or were homozygous for a floxed allele of LKB1 (Stk11)lox/lox by breeding LKB1lox/+ males to LKB1lox/+ females. Resulting 8-week-old male mice of both LKB1+/+ (i.e., WT) and LKB1lox/lox (i.e., KO) genotypes were tail-vein injected with adenovirus expressing Cre recombinase from the cytomegalovirus (CMV) promoter. WT and KO mice both fed on the PALM diet for 5 days starting 7 days after the tail-vein injection. They were sacrificed and the livers were harvested 12 days after the tail-vein injection.
Tissue Preparation
All tissues were further dissected into small pieces and homogenized at 4C using the Precellys 24 homogenizer in PBS with protease and phosphatase inhibitors (Roche, Indianapolis, Indiana). The brain tissue that was fractionated (Figure 1E) was prepared differently. It was homogenized and fractionated using sucrose gradient fractionation method following a previously published protocol.29 After homogenization, protein concentration was determined with a Pierce BCA protein assay (Life Technologies, Grand Island, NY).
Click Chemistry
Ten milligrams of each tissue was removed for further processing. For the fractionated samples, 200 μg was used. Sodium dodecyl sulfate was added to a final concentration of 0.5%. The homogenate was then sonicated with a tip sonicator and was divided into 0.5 mg aliquots. A click reaction was performed on each aliquot. The click reaction protocol has been previously published.30 In brief, for each click reaction, the following reagents were added in this order: (1) 30 μL of 1.7 mM TBTA, (2) 8 μL of 50 mM copper sulfate, (3) 8 μL of 5 mM Biotin-Alkyne (C24H40N4O7S Life Technologies), and (4) 8 μL of 50 mM TCEP. PBS was then added to a final volume of 400 μL and incubated for 1 h at room temperature. Methanol/chloroform precipitation was performed and the precipitated protein was combined so there was only one pellet per each 10 mg starting material.
For the WT and KO livers, this protocol was followed with the following exceptions. Only 2 mg of homogenate was used in each analysis (i.e., 2 mg for KO and 2 mg for WT). The homogenate was first sonicated and the centrifuged at 13 000g for 10 min. The supernatant was divided into two tubes. The pellet was resuspend in 0.5% NP40 in PBS and incubated for 30 min. This solution was centrifuged at 1000g for 10 min. The supernatant was removed and transferred to an Eppendorf tube. The pellet was resuspended with 50 μL of 0.5% sodium dodecyl sulfate and boiled for 10 min. Thus, for each 2 mg starting material there were four click reactions. For the KO livers, a light biotin-alkyne (C16H24N4O3S, Seterah, Eugene, OR) was employed, while for the WT livers, a heavy biotin-alkyne(C13H24N3O3S–13C315N, Seterah, Eugene, OR) was employed. After the click reaction but prior to the precipitation, the light and heavy samples were mixed.
Immunoblot Analysis
After the click reaction, 25 μL was removed and 4× loading buffer and 20× reducing agent was added for a final volume of 38 μL. Ten μL was added to a 4–12% Bis-Tris gradient gel, and the protein was separated, transferred to PVDF blotting paper, and developed as previously described.31 The immunoblots were probed with streptavidin-HRP (JacksonImmuno, West Grove, PA) or beta-actin (Sigma, St. Louis, MO). Pixel intensity analysis was performed as previously described.31 The antibodies used for the verification of the deletion of LKB1 (Supplementary Figure 1) were purchased from Cell Signaling Technology (Beverly, MA).
Digestion and Biotin Peptide Enrichment
Precipitated pellets were resuspended with MS-compatible surfactant ProteaseMAX (Promega, Madison, WI) and urea, then reduced, alkylated, and digested with trypsin as previously described.10 The digested solution was centrifuged at 13 000g for 10 min. The supernatant was removed and the pellet was resuspended with PBS and centrifuged at 13 000g for 10 min. Supernatants were combined and 100 μL of neutravidin agarose resin (Thermo Fisher Scientific, Rockland, IL) was added. The resin was incubated with the peptides for 2 h at room temperature while rotating; then, the resin was washed five times with PBS. The peptides were eluted with 80% acetonitrile, 0.2% formic acid, and 0.1% TFA. Prior to MS analysis, the elutions were dried with a speed-vac.
MS Analysis
Dried peptides were resolubilized in Buffer A (5% ACN, 95% water, 0.1% formic acid) and then were pressure-loaded onto a 250-μm i.d. capillary with a kasil frit. The capillary contained 2 cm of 10 μm Jupiter C18-A material (Phenomenex, Ventura, CA), followed by 2 cm 5 μm Partisphere strong cation exchanger (Whatman, Clifton, NJ). This loading column was washed with buffer A. After washing, a 100 μm i.d. capillary with a 5 μm pulled tip packed with 15 cm 4 μm Jupiter C18 material (Phenomenex, Ventura, CA) was attached to the loading column with a union, and the entire split-column (loading column–union–analytical column) was placed inline with an Agilent 1100 quaternary HPLC (Palo Alto, CA). The sample was analyzed using MudPIT, which is a modified 12-step separation previously described.32 The buffer solutions used were buffer A, 80% acetonitrile/0.1% formic acid (buffer B), and 500 mM ammonium acetate/5% acetonitrile/0.1% formic acid (buffer C). Step 1 consisted of a 60 min gradient from 0 to 100% buffer B. Steps 2–11 had the following profile: 3 min of 100% buffer A, 5 min of X% buffer C, a 10 min gradient from 0 to 10% buffer B, and a 105 min gradient from 15 to 45% buffer B. The buffer C percentages (X) were 10, 15, 20, 30, 35, 40, 50, 60, and 100%, respectively, for the 12-step analysis. In the final two steps, the gradient contained: 5 min of 100% buffer A, 5 min of 90% buffer C plus 10% B, a 10 min gradient from 0 to 15% buffer B, and a 105 min gradient from 15 to 100% buffer B. As peptides eluted from the microcapillary column, they were electrosprayed directly into a Velos mass spectrometer (ThermoFisher, Palo Alto, CA) with the application of a distal 2.4 kV spray voltage. A cycle of one full-scan FT mass spectrum (300–1600 m/z) at 60 000 resolution followed by 20 data-dependent IT MS/MS spectra at a 35% normalized collision energy was repeated continuously throughout each step of the multidimensional separation. Application of mass spectrometer scan functions and HPLC solvent gradients was controlled by the Xcalibur data system.
Analysis of Mass Spectra
Each MudPIT analysis was analyzed separately except for the LKB1 KO liver quantitative analysis (Figure 4C–E). In this analysis, data from three technical MudPIT replicates were combined before database searching. Both MS1 and MS2 (tandem mass spectra) were extracted from the XCalibur data system format (.RAW) into MS1 and MS2 formats using in house software (RAW_Xtractor).33 MS/MS spectra remaining after filtering were searched with the Prolucid Software34 against the UniProt_mouse_07-29-2013 concatenated to a decoy database in which the sequence for each entry in the original database was reversed.35 All searches were parallelized and performed on a Beowulf computer cluster consisting of 100 1.2 GHz Athlon CPUs.36 No enzyme specificity was considered for any search. The following modifications were searched for a static modification of 57.02146 on cysteine for all analyses, a differential modification of 523.2749 on methionine for AHA using the Life Technologies biotin-alkyne, and a differential modification of 351.1774 (heavy) and 347.1702 (light) on methionine for AHA using the Seterah Biotech biotin-alkynes. Prolucid results were assembled and filtered using the DTASelect (version 2.0) program.37,38 DTASelect 2.0 uses a linear discriminant analysis to dynamically set XCorr and DeltaCN thresholds for the entire data set to achieve a user-specified false discovery rate (FDR). In addition, the modified peptides were required to be fully tryptic, <5 ppm deviation from peptide match, and an FDR at the spectra level of 0.01. The FDRs are estimated by the program from the number and quality of spectral matches to the decoy database. For all data sets, the protein FDR was <1% and the peptide FDR was <0.5%. The MS data were quantified(i.e., generate heavy/light ratios) using the software, pQuant,39 which uses the DTASelect and MS1 files as the input. pQuant assigns a confidence score to each heavy/light ratio from zero to one. Zero, the highest confidence, means there is no interference signal, and one means the peptide signals are almost inundated by interference signals (i.e., very noisy). For this analysis, only ratios with sigma less than or equal to 0.1 were used. NSPs that were observed to have an average 1.2-fold change between WT and KO livers were the input for functional pathway analysis (default settings of the “Core Analysis”) performed by the software Ingenuity.40 In Ingenuity, the p value measures how likely the observed association between a functional pathway and our dataset would be if it was only due to random chance. The two major factors in this calculation are the number of proteins annotated to the functional pathway from our dataset and the total number of proteins annotated to the functional pathway in the Ingenuity Knowledge Base. All of the MS results from this study are located at http://sealion.scripps.edu/pint/?project=f302f024b4d5aa1f on PINT (Proteomics INTegrator). PINT is an online tool that provides a long term storage for final proteomics results and allows the integration of data coming from multiple and different types of proteomics approaches, also integrating UniprotKB protein annotations. All data can be visualized and downloaded from the web interface, which also provides a way for querying the data.
Acknowledgments
Funding has been provided by National Institutes of Health grants P41 GM103533, R01 MH067880, 1 R01 MH100175, and HHSN268201000035C by the National Key Basic Research and Development Program of China (973) under Grant No. 2012CB910602 (C.L.) and National Institutes of Health grant R01DK080425 (R.J.S). In addition, K.H. was funded by a fellowship from the George E. Hewitt Foundation for Medical Research.
Supporting Information Available
The Supporting Information is available free of charge on the ACS Publications website at DOI: 10.1021/acs.jproteome.5b00653. All proteins identified and quantified are deposited at http://sealion.scripps.edu/pint/?project=f302f024b4d5aa1f, where the data can be queried (i.e., gene, UniProt number, all NSP identified in brain tissue, etc.) and is linked to additional protein information.
The authors declare no competing financial interest.
Supplementary Material
References
- Shirasaki D. I.; et al. Network organization of the huntingtin proteomic interactome in mammalian brain. Neuron 2012, 75, 41–57 10.1016/j.neuron.2012.05.024. [DOI] [PMC free article] [PubMed] [Google Scholar]
- Bennett E. J.; et al. Global changes to the ubiquitin system in Huntington’s disease. Nature 2007, 448, 704–708 10.1038/nature06022. [DOI] [PubMed] [Google Scholar]
- Kwong G. A.; et al. Mass-encoded synthetic biomarkers for multiplexed urinary monitoring of disease. Nat. Biotechnol. 2013, 31, 63–70 10.1038/nbt.2464. [DOI] [PMC free article] [PubMed] [Google Scholar]
- Mangerich A.; et al. Infection-induced colitis in mice causes dynamic and tissue-specific changes in stress response and DNA damage leading to colon cancer. Proc. Natl. Acad. Sci. U. S. A. 2012, 109, E1820–1829 10.1073/pnas.1207829109. [DOI] [PMC free article] [PubMed] [Google Scholar]
- Li K.; et al. betaCaMKII in lateral habenula mediates core symptoms of depression. Science 2013, 341, 1016–1020 10.1126/science.1240729. [DOI] [PMC free article] [PubMed] [Google Scholar]
- Kruger M.; et al. SILAC mouse for quantitative proteomics uncovers kindlin-3 as an essential factor for red blood cell function. Cell 2008, 134, 353–364 10.1016/j.cell.2008.05.033. [DOI] [PubMed] [Google Scholar]
- McClatchy D. B.; Dong M. Q.; Wu C. C.; Venable J. D.; Yates J. R. 3rd. 15N metabolic labeling of mammalian tissue with slow protein turnover. J. Proteome Res. 2007, 6, 2005–2010 10.1021/pr060599n. [DOI] [PMC free article] [PubMed] [Google Scholar]
- Wu C. C.; MacCoss M. J.; Howell K. E.; Matthews D. E.; Yates J. R. 3rd. Metabolic labeling of mammalian organisms with stable isotopes for quantitative proteomic analysis. Anal. Chem. 2004, 76, 4951–4959 10.1021/ac049208j. [DOI] [PubMed] [Google Scholar]
- Dieterich D. C.; Link A. J.; Graumann J.; Tirrell D. A.; Schuman E. M. Selective identification of newly synthesized proteins in mammalian cells using bioorthogonal noncanonical amino acid tagging (BONCAT). Proc. Natl. Acad. Sci. U. S. A. 2006, 103, 9482–9487 10.1073/pnas.0601637103. [DOI] [PMC free article] [PubMed] [Google Scholar]
- Schiapparelli L. M.; et al. Direct detection of biotinylated proteins by mass spectrometry. J. Proteome Res. 2014, 13, 3966–3978 10.1021/pr5002862. [DOI] [PMC free article] [PubMed] [Google Scholar]
- Shen W.; et al. Acute synthesis of CPEB is required for plasticity of visual avoidance behavior in Xenopus. Cell Rep. 2014, 6, 737–747 10.1016/j.celrep.2014.01.024. [DOI] [PMC free article] [PubMed] [Google Scholar]
- Hinz F. I.; Dieterich D. C.; Tirrell D. A.; Schuman E. M. Non-canonical amino acid labeling in vivo to visualize and affinity purify newly synthesized proteins in larval zebrafish. ACS Chem. Neurosci. 2012, 3, 40–49 10.1021/cn2000876. [DOI] [PMC free article] [PubMed] [Google Scholar]
- Hodas J. J.; et al. Dopaminergic modulation of the hippocampal neuropil proteome identified by bioorthogonal noncanonical amino acid tagging (BONCAT). Proteomics 2012, 12, 2464–2476 10.1002/pmic.201200112. [DOI] [PMC free article] [PubMed] [Google Scholar]
- Ullrich M.; et al. Bio-orthogonal labeling as a tool to visualize and identify newly synthesized proteins in Caenorhabditis elegans. Nat. Protoc. 2014, 9, 2237–2255 10.1038/nprot.2014.150. [DOI] [PubMed] [Google Scholar]
- Orentreich N.; Matias J. R.; DeFelice A.; Zimmerman J. A. Low methionine ingestion by rats extends life span. J. Nutr. 1993, 123, 269–274. [DOI] [PubMed] [Google Scholar]
- Miller R. A.; et al. Methionine-deficient diet extends mouse lifespan, slows immune and lens aging, alters glucose, T4, IGF-I and insulin levels, and increases hepatocyte MIF levels and stress resistance. Aging Cell 2005, 4, 119–125 10.1111/j.1474-9726.2005.00152.x. [DOI] [PMC free article] [PubMed] [Google Scholar]
- Sahai A.; et al. Obese and diabetic db/db mice develop marked liver fibrosis in a model of nonalcoholic steatohepatitis: role of short-form leptin receptors and osteopontin. Am. J. Physiol Gastrointest Liver Physiol 2004, 287, G1035–1043 10.1152/ajpgi.00199.2004. [DOI] [PubMed] [Google Scholar]
- Wortham M.; He L.; Gyamfi M.; Copple B. L.; Wan Y. J. The transition from fatty liver to NASH associates with SAMe depletion in db/db mice fed a methionine choline-deficient diet. Dig. Dis. Sci. 2008, 53, 2761–2774 10.1007/s10620-007-0193-7. [DOI] [PMC free article] [PubMed] [Google Scholar]
- Leclercq I. A.; et al. CYP2E1 and CYP4A as microsomal catalysts of lipid peroxides in murine nonalcoholic steatohepatitis. J. Clin. Invest. 2000, 105, 1067–1075 10.1172/JCI8814. [DOI] [PMC free article] [PubMed] [Google Scholar]
- Kolb H. C.; Sharpless K. B. The growing impact of click chemistry on drug discovery. Drug Discovery Today 2003, 8, 1128–1137 10.1016/S1359-6446(03)02933-7. [DOI] [PubMed] [Google Scholar]
- McClatchy D. B.; et al. Differential proteomic analysis of mammalian tissues using SILAM. PLoS One 2011, 6, e16039. 10.1371/journal.pone.0016039. [DOI] [PMC free article] [PubMed] [Google Scholar]
- Huttlin E. L.; et al. A tissue-specific atlas of mouse protein phosphorylation and expression. Cell 2010, 143, 1174–1189 10.1016/j.cell.2010.12.001. [DOI] [PMC free article] [PubMed] [Google Scholar]
- Li Z.; et al. Systematic comparison of label-free, metabolic labeling, and isobaric chemical labeling for quantitative proteomics on LTQ Orbitrap Velos. J. Proteome Res. 2012, 11, 1582–1590 10.1021/pr200748h. [DOI] [PubMed] [Google Scholar]
- Shaw R. J.; et al. The kinase LKB1 mediates glucose homeostasis in liver and therapeutic effects of metformin. Science 2005, 310, 1642–1646 10.1126/science.1120781. [DOI] [PMC free article] [PubMed] [Google Scholar]
- Liao L.; McClatchy D. B.; Yates J. R. Shotgun proteomics in neuroscience. Neuron 2009, 63, 12–26 10.1016/j.neuron.2009.06.011. [DOI] [PMC free article] [PubMed] [Google Scholar]
- Magdeldin S.; Moresco J. J.; Yamamoto T.; Yates J. R. 3rd. Off-Line Multidimensional Liquid Chromatography and Auto Sampling Result in Sample Loss in LC/LC-MS/MS. J. Proteome Res. 2014, 13, 3826. 10.1021/pr500530e. [DOI] [PMC free article] [PubMed] [Google Scholar]
- Shackelford D. B. Unravelling the connection between metabolism and tumorigenesis through studies of the liver kinase B1 tumour suppressor. J. Carcinog. 2013, 12, 16. 10.4103/1477-3163.116323. [DOI] [PMC free article] [PubMed] [Google Scholar]
- McClatchy D. B.; Yates J. R. 3rd. Stable isotope labeling in mammals (SILAM). Methods Mol. Biol. 2014, 1156, 133–146 10.1007/978-1-4939-0685-7_8. [DOI] [PubMed] [Google Scholar]
- McClatchy D. B.; Liao L.; Lee J. H.; Park S. K.; Yates J. R. 3rd. Dynamics of subcellular proteomes during brain development. J. Proteome Res. 2012, 11, 2467–2479 10.1021/pr201176v. [DOI] [PMC free article] [PubMed] [Google Scholar]
- Speers A. E.; Cravatt B. F. Activity-Based Protein Profiling (ABPP) and Click Chemistry (CC)-ABPP by MudPIT Mass Spectrometry. Current protocols in chemical biology 2009, 1, 29–41 10.1002/9780470559277.ch090138. [DOI] [PMC free article] [PubMed] [Google Scholar]
- McClatchy D. B.; Liao L.; Park S. K.; Venable J. D.; Yates J. R. Quantification of the synaptosomal proteome of the rat cerebellum during post-natal development. Genome Res. 2007, 17, 1378–1388 10.1101/gr.6375007. [DOI] [PMC free article] [PubMed] [Google Scholar]
- Washburn M. P.; Wolters D.; Yates J. R. 3rd. Large-scale analysis of the yeast proteome by multidimensional protein identification technology. Nat. Biotechnol. 2001, 19, 242–247 10.1038/85686. [DOI] [PubMed] [Google Scholar]
- McDonald W. H.; et al. MS1, MS2, and SQT-three unified, compact, and easily parsed file formats for the storage of shotgun proteomic spectra and identifications. Rapid Commun. Mass Spectrom. 2004, 18, 2162–2168 10.1002/rcm.1603. [DOI] [PubMed] [Google Scholar]
- Xu T.; et al. ProLuCID, a fast and sensitive tandem mass spectra-based protein identification program. Mol. Cell. Proteomics 2006, 5, S174. [Google Scholar]
- Peng J.; Elias J. E.; Thoreen C. C.; Licklider L. J.; Gygi S. P. Evaluation of multidimensional chromatography coupled with tandem mass spectrometry (LC/LC-MS/MS) for large-scale protein analysis: the yeast proteome. J. Proteome Res. 2003, 2, 43–50 10.1021/pr025556v. [DOI] [PubMed] [Google Scholar]
- Sadygov R. G.; et al. Code developments to improve the efficiency of automated MS/MS spectra interpretation. J. Proteome Res. 2002, 1, 211–215 10.1021/pr015514r. [DOI] [PubMed] [Google Scholar]
- Cociorva D. L.; Tabb D.; Yates J. R. Validation of tandem mass spectrometry database search results using DTASelect. Curr. Protoc. Bioinf. 2007, 16:13.4:13.4.1–13.4.14 10.1002/0471250953.bi1304s16. [DOI] [PubMed] [Google Scholar]
- Tabb D. L.; McDonald W. H.; Yates J. R. 3rd. DTASelect and Contrast: tools for assembling and comparing protein identifications from shotgun proteomics. J. Proteome Res. 2002, 1, 21–26 10.1021/pr015504q. [DOI] [PMC free article] [PubMed] [Google Scholar]
- Liu C.; et al. pQuant improves quantitation by keeping out interfering signals and evaluating the accuracy of calculated ratios. Anal. Chem. 2014, 86, 5286–5294 10.1021/ac404246w. [DOI] [PubMed] [Google Scholar]
- Calvano S. E.; et al. A network-based analysis of systemic inflammation in humans. Nature 2005, 437, 1032–1037 10.1038/nature03985. [DOI] [PubMed] [Google Scholar]
Associated Data
This section collects any data citations, data availability statements, or supplementary materials included in this article.