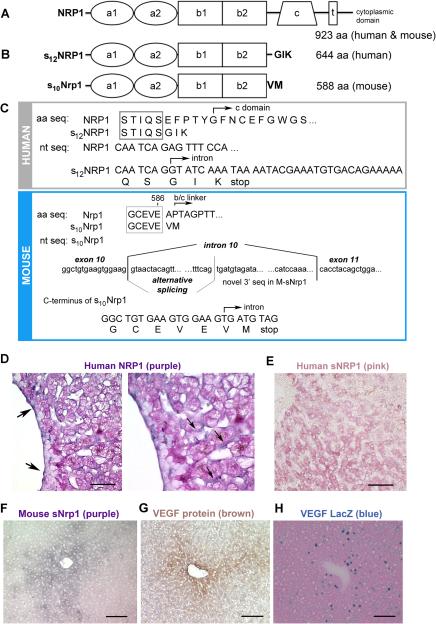
Figure 1. Comparison of human and mouse Neuropilin 1 isoforms.
(A) Diagram of human and mouse NRP1 structure. (B) Upper panel: diagram of human s12NRP1. Lower panel: diagram of mouse s10Nrp1. (C) Upper panel: Human sNRP1 ends in 3 novel aa (GIK). Lower panel: The novel mouse sNrp1 reads through into intron 10, has an alternatively spliced region, and 300 unique nt encoding 2 novel aa (VM) and a stop codon. (D) ISH demonstrates human NRP1 (purple color) in EC (arrows) of sinusoids and veins. Eosin counterstain (pink color). Scale bar = 30 μm. Right panel is magnification of left panel. (E) ISH demonstrates human sNRP1 (pink color) in hepatocytes. Scale bar = 50 μm. (F) ISH demonstrates mouse sNrp1 (purple color) in hepatocytes surrounding central veins. (G) IHC for VEGF protein (brown color) in hepatocytes surrounding central veins. Hematoxylin counterstain (blue nuclei). (H) X-gal staining demonstrates LacZ signal (blue color) in hepatocytes. Eosin counterstain (pink color). Scale bars F-H = 0.1 mm.

