

Abstract
Polymerase chain reaction (PCR) is a laboratory procedure to amplify and simultaneously quantify targeted DNA molecules, and then detect the product of the reaction at the end of all the amplification cycles. A more modern technique, real-time PCR, also known as quantitative PCR (qPCR), detects the product after each cycle of the progressing reaction by applying a specific fluorescence technique. The quantitative methods currently used to analyze qPCR data result in varying levels of estimation quality. This study compares the accuracy and precision of the estimation achieved by eight different models when applied to the same qPCR dataset. Also, the study evaluates a newly introduced data preprocessing approach, the taking-the-difference approach, and compares it to the currently used approach of subtracting the background fluorescence. The taking-the-difference method subtracts the fluorescence in the former cycle from that in the latter cycle to avoid estimating the background fluorescence. The results obtained from the eight models show that taking-the-difference is a better way to preprocess qPCR data compared to the original approach because of a reduction in the background estimation error. The results also show that weighted models are better than non-weighted models, and that the precision of the estimation achieved by the mixed models is slightly better than that achieved by the linear regression models.
Key words: : efficiency, linear regression, mixed model, PCR, taking-the-difference
1. Introduction
Polymerase chain reaction (PCR) is a laboratory procedure to amplify and simultaneously quantify targeted DNA molecules, and then detect the product of the reaction at the end of all the amplification cycles. A more modern technique, real-time PCR, also known as quantitative PCR (qPCR), detects the product after each cycle of the progressing reaction by applying a specific fluorescence technique.
qPCR offers some immediate and significant improvements over the previous conventional PCR methods for the quantification of microorganisms. The technique can be used to efficiently and representatively amplify an enormous range of template concentrations without affecting assay efficiency, making it easier and more precise than standard PCR methods (Ryncarz et al., 1999; Abe et al., 1999). The method of qPCR is widely used to detect and quantify nucleic acids from diverse targets such as food, viral and nonviral vectors used in gene therapy protocols, and genetically modified organisms, and to study human and veterinary microbes and oncology and immunology (Kruse et al., 1997; Böhm et al., 1999; Härtel et al., 1999; Nogva et al., 2000; Fraaije et al., 2001; Mhlanga and Malmberg, 2001; Barzon et al., 2003; Klein, 2002).
qPCR is widely used for assessing the initial number of DNA, RNA, or mRNA target molecules in a nucleic acid extract. This is used to investigate the effect of various drug treatments on cellular death, or the effect of antiviral treatments on virus copy number (Clementi et al., 1996) through the quantification of the target microbial load. Quantification of an infectious microorganism assists the medical practitioner in determining when antimicrobial therapy should be used and the level of efficacy being achieved by an ongoing antimicrobial therapy (Mackay et al., 2007). Patients undergoing organ transplantation who are subject to extensive immunosuppression also benefit from ongoing quantification of their microbial load. Such patients can then be quickly treated in response to changes in the status of low-level, latent, or persistent infections (Clementi, 2000; Limaye et al., 2001). The microbial load can also frequently be related to disease progression in immunocompromised patients by detecting an increase in pathogen numbers that precedes clinical symptoms (Mackay et al., 2007).
A commonly used approach for the analysis of qPCR data has been based on the “fit points” method, which is a parametric method that selects some points (or cycles) for the regression of a linear or curvilinear relationship. Linear regression-based methods provide an easy estimation of the initial gene amount and the PCR efficiency for each sample. Linear regression assumes that the PCR amplification efficiency of a target gene is constant in the selected data points. Based on this assumption, linear regression of the log fluorescence per cycle number is used to calculate the starting DNA and PCR efficiency. Generally, only points in the exponential amplification phase are selected to analyze the initial concentration of the template and the efficiency because in the post-exponential phase, which includes a linear phase and a plateau phase, the amplification function is unknown. Even within the exponential phase, it is not appropriate to use the points in the baseline level, and only the points above a threshold value (Ct) are used. The major issues for analyzing qPCR data then become how to determine the appropriate threshold value, how to select the cycles, and what model to use in the analysis.
2. Materials and Methods
To choose the best method for analyzing qPCR data, we compared the results among four different regression methods (simple linear regression, weighted linear regression, the linear mixed model, and the weighted linear mixed model). We used two different data preprocessing approaches (data obtained through either the original approach or the taking-the-difference approach). The original approach uses the mean value of cycles 1–3 as background noise; whereas the taking-the-difference approach (Rao et al., 2012) subtracts the fluorescence in the former cycle from that of the latter cycle. Correction of the background estimation error that affects the estimation of the initial DNA amount is not necessary when using the taking-the-difference approach, as shown in Figure 1.
FIG. 1.

Deduction for data from the original preprocessing approach and data from the taking-the-difference approach.
The underlying qPCR regression model is given as
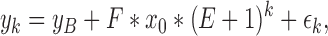 |
where εk∼N(0,σ2) and σ2 is an unknown but fixed constant.
yk : The fluorescence intensity in the k-th cycle, k=1,2,…,50
yB : The background fluorescence
F : Conversion factor between the number of target molecules and observed fluorescence intensity
x0 : Initial DNA molecular numbers
E : Amplification efficiency
The PCR dataset used in the study was published by Guescini et al. (2008). The standard DNA consisted of a pGEM-T (Promega) plasmid containing a 104 bp fragment of the mitochondrial gene NADH dehydrogenase 1 (MT-ND1) as an insert. Then, real-time PCR amplifications were conducted in the presence of a wide range of input DNA molecules (3.14×101∼3.14×10⁷), with different amplification mix quantities ranging from 60% to 100%. Each reaction combination, namely the starting DNA and amplification mix percentage, was conducted in triplicate and repeated in four separate amplification runs. The data structure is described in Figure 2. PCR experiments were conducted using LightCycler 480 SYBR Green I Master (Roche) according to the manufacturer's instructions.
FIG. 2.

Example of raw data structure.
In this study, five consecutive cycles with fluorescence values above 0.2 for each run were selected for the application of the different models. The reference groups used to calculate the starting DNA amount were the corresponding triplets with combinations of 3.14×10⁴ input DNA numbers and 100% amplification mix. For example, for all the second triplets in amplification mix of 80%, the reference group is the mean value of the three runs in the second triplet under the combination of an initial DNA amount of 3.14×10⁴ with an amplification mix of 100%. To the dataset, under the two respective data preprocessing approaches, we applied four different regression models: simple linear regression, weighted linear regression, a linear mixed model, and a weighted linear mixed model. As we can see in Figure 2, after taking the log of the background corrected data, there is a linear relationship between the fluorescence intensity and the cycle number k, where the efficiency can be calculated by  .
.
In linear regression, for each run we build a regression as
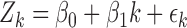 |
Based on that, the weighted models add a weight factor to take into account the variation of the data. In this study, the reciprocal of the variance is used as the weight factor.
Using the Delta method,
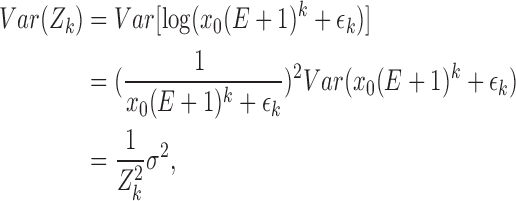 |
and considering the weight factor as the reciprocal of the variance, we obtain
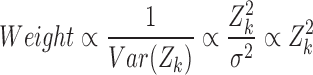 |
Thus, we use  as the weight factor in the weighted linear regression.
Considering that the experiments were clustered in triplets, we took a step further by using mixed models to address the repeated measurements. For each triplet, the mixed regression model we used was
 |
i : i-th experiment in each triplet, i=1,2,3
k : k-th cycle, k=1,2,…, 49
β0,β1 : parameters for fixed effect
γ : parameters for random effect
We also considered a weighted linear mixed model by using a weight factor of  for the regression on Zik.
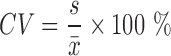
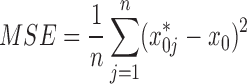
We used SAS 9.3 to perform the regression statistical analyses and data management, and used the procedures proc reg for the linear regression model and proc mixed for the mixed model. We calculated the initial DNA molecular numbers and efficiencies for each of the 140 separate experiments. The initial gene amount in a target PCR experiment was computed based on reference runs. We used the relative error (RE) to evaluate the accuracy of the different methods, comparing the estimated value of the input DNA molecules for each run with the true value of the input DNA. We used the coefficient of variation (CV) and mean squared error (MSE) to evaluate the precision of the methods.
 |
 |
 |
j : j-th run (linear regressions) or j-th triplet (mixed models)
n: number of regression models in each combination (n=12 for linear regressions, n=4 for mixed models)
 : Estimated initial DNA amount in the j-th experiment
x0 : True initial DNA amount
s : Standard deviation of
 in each combination
 : Mean of
  in each combination
3. Results
The purpose of this study was to determine the best regression method for the analysis of qPCR data. Our aim was to compare the accuracy (evaluated by the RE) and precision (evaluated by the CV) of estimating the initial input molecular number using different regression methods using the original data approach or the taking-the-difference data approach.
We fit the qPCR data with simple linear regression, weighted linear regression, linear mixed model, and weighted linear mixed model under each of the two data preprocessing approaches. The REs and CVs are obtained for each initial input DNA molecular number. The corresponding average values of the REs and CVs for these settings are given in Table 1.
Table 1.
Comparison of Performance Between the Original Approach and the Taking-the-Difference Approach and Different Regression Methods
| Original dataa | Taking differenceb | ||||||||
|---|---|---|---|---|---|---|---|---|---|
| RE | CV(%) | RE | CV(%) | ||||||
| Mix | Methods | Avg | Max | Avg | Max | Avg | Max | Avg | Max |
| 100% | SLR | 0.397 | 1.471 | 25.40 | 63.01 | 0.233 | 0.703 | 26.80 | 57.50 |
| WLR | 0.228 | 0.758 | 18.30 | 40.19 | 0.123 | 0.528 | 19.50 | 33.88 | |
| LMM | 0.383 | 1.45 | 20.10 | 58.66 | 0.216 | 0.642 | 20.40 | 46.29 | |
| WMM | 0.235 | 0.774 | 15.50 | 37.34 | 0.142 | 0.569 | 15.40 | 32.42 | |
| 90% | SLR | 0.380 | 2.141 | 27.27 | 50.64 | 0.02 | 0.378 | 28.18 | 43.38 |
| WLR | 0.114 | 0.763 | 20.62 | 32.76 | −0.069 | 0.335 | 26.49 | 41.57 | |
| LMM | 0.364 | 2.079 | 25.37 | 48.89 | 0.007 | 0.36 | 24.29 | 33.99 | |
| WMM | 0.116 | 0.737 | 17.20 | 32.33 | −0.054 | 0.368 | 20.97 | 29.51 | |
| 80% | SLR | −0.211 | −0.325 | 16.65 | 29.64 | −0.224 | −0.383 | 20.88 | 38.72 |
| WLR | −0.228 | −0.343 | 16.79 | 40.81 | −0.205 | −0.439 | 27.23 | 67.58 | |
| LMM | −0.214 | −0.326 | 13.43 | 29.32 | −0.229 | −0.385 | 18.82 | 39.01 | |
| WMM | −0.226 | −0.343 | 14.83 | 40.11 | −0.201 | −0.44 | 24.11 | 64.55 | |
| 70% | SLR | −0.211 | −0.325 | 16.65 | 29.64 | −0.224 | −0.383 | 20.88 | 38.72 |
| WLR | −0.228 | −0.343 | 16.79 | 40.81 | −0.205 | −0.439 | 27.23 | 67.58 | |
| LMM | −0.214 | −0.326 | 13.43 | 29.32 | −0.229 | −0.385 | 18.82 | 39.01 | |
| WMM | −0.226 | −0.343 | 14.83 | 40.11 | −0.201 | −0.44 | 24.11 | 64.55 | |
| 60% | SLR | −0.346 | −0.455 | 26.20 | 85.03 | −0.299 | −0.44 | 29.75 | 64.81 |
| WLR | −0.298 | −0.396 | 24.74 | 74.09 | −0.177 | −0.464 | 30.18 | 69.75 | |
| LMM | −0.357 | −0.458 | 20.41 | 67.07 | −0.318 | −0.444 | 20.29 | 38.29 | |
| WMM | −0.295 | −0.399 | 17.93 | 59.01 | −0.168 | −0.448 | 22.52 | 50.90 | |
Original data points subtracted by background fluorescence value (mean value of cycle 1 to 3).
Using the taking-the-difference method, data points are subtracted by the fluorescence value of the former cycle.
Average values of estimations for different initial amounts of DNA under the specified mix.
SLR, simple linear regression; WLR, weighted linear regression; LMM, linear mixed model; WMM, weighted mixed model.
We can see that under either data preprocessing approach, both accuracy and precision are substantially better when using weighted linear regression compared to simple linear regression, and when using the weighted linear mixed model compared to the linear mixed model. This shows us that using a weight factor results in a better estimation. Also, in most cases, the accuracy and precision of the estimations are slightly better when using the mixed model than linear regression. Horizontally comparing the different data preprocessing approaches, we find that using the taking-the-difference approach results in a substantially improved estimation accuracy and similar precision compared to using the original data preprocessing approach most of the time. Of these eight regression models, weighted linear regression combined with the taking-the-difference approach has the best accuracy, and the weighted linear mixed model combined with the taking-the-difference approach has the best precision.
Another important parameter of PCR is the amplification efficiency. Under ideal conditions, the amplification efficiency is 100%, meaning that the DNA sequence is doubled after every cycle. However, in real lab operations, due to different primer pairs and competitive reactions, the amplification efficiency rarely reaches 100%, even in the exponential phase. In Figure 3, we see that all the methods give reasonable efficiency estimations between 75% and 95%. Theoretically, there should be a monotonically increasing trend in PCR efficiency for the amplification mix percentage ranging from 60% to 100%. Such an increasing trend is more clearly observed in models that use the taking-the-difference data preprocessing approach compared to models that use the original data. This on the other aspect indicates that the taking-the-difference approach gives better estimates for the PCR amplification efficiency.
FIG. 3.

PCR amplification efficiencies computed by four models (from top to bottom, respectively): simple linear regression, weighted linear regression, linear mixed model, and weighted mixed model, using the original data (left panels) or the taking-the-difference data (right panels).
4. Discussion
Comparing the accuracy and precision of four regression methods combined with two different data preprocessing approaches, we found that the taking-the-difference approach improved the estimation of the initial DNA amount with comparable precision (similar CVs), yet better accuracy (smaller REs). Using either the data preprocessing approach, taking-the-difference, or the original data approach, the accuracy and precision obtained by the weighted models were better than those obtained by the nonweighted models. Also, the precision obtained by the mixed models was better than that obtained by the fixed models; however, there was little difference in the accuracy of the estimations between these two methods.
While assessing the various models and data preprocessing approaches, we explored different combinations of the number of points to be included in the regression and different threshold values. The threshold value is set above the baseline value and within the exponential part of the PCR amplification (Biosystems, 2002; Zhao and Fernald, 2005). It is used as an indicator of successful target amplification as it mirrors the progression of the amplification reaction above the background noise level (Wilhelm et al., 2000). To ensure the linearity of the regression, all points included should be within the exponential amplification phase.
If the threshold value is set too small, then the points in the background noise level may be included in the regression; if the threshold value is too large, it may affect the number of points that can be used for the regression. After observing the trend in the data and trying several values between 0.1 and 0.5, we set the threshold value at 0.2, which corresponded to cycle 17∼20 for most of the experiments in the dataset. According to Wilhelm et al. (2003), the baseline is usually between 3∼15 cycles, where any amplification signal tends to lie within the background noise of the system. Our threshold value was slightly above the baseline value, which ensured that the regression start points were in the exponential amplification phase.
Another exploration of the number of points included suggested that 5 points was reasonable. With too few points, the regression model may be unstable and have large variation; whereas too many points may result in some of the cycles outside the exponential phase and entering the linear phase, where the linear relationship between the cycle number and the fluorescence on the natural logarithm scale does not hold. Our finding roughly agrees with the suggestions of point selection in previous studies: three to five data points (Bar et al., 2003), four to six data points (Ramakers et al., 2003), or four to ten data points (Zhao and Fernald, 2005).
Quantitative PCR is becoming widely used in applications related to clinical treatments, such as to investigate the effect of antiviral treatment on virus copy number (Clementi et al., 1996). Quantification of an infectious microorganism assists the medical practitioner in determining when antimicrobial therapy should be used and the level of efficacy being achieved by an ongoing antimicrobial therapy (Mackay et al., 2007). However, common methods such as using reference genes or serial dilutions may not be sufficiently accurate for most clinical purposes due to the use of external standard reference curves, or limiting dilutions of samples (Mehmet et al., 2001). Minor differences in estimation, especially estimations of the initial DNA amount, may affect the therapeutic plan based on objective data. Accurate estimation methods are vital when analyzing qPCR data. Thus, choosing an appropriate and better method of analysis is of great significance to clinical practice.
Acknowledgments
This research was supported by the U.S. National Institutes of Health through grants U54 CA096300, U01 CA152958, and 5P50 CA100632.
Author Disclosure Statement
No competing financial interests exist.
References
- Abe A., Inoue K., Tanaka T., et al. 1999. Quantitation of hepatitis B virus genomic DNA by real-time detection PCR. J. Clin. Microbiol. 37, 2899–2903 [DOI] [PMC free article] [PubMed] [Google Scholar]
- Applied Biosystems. 2002. Data analysis on the ABI PRISM 7700 sequence detection system
- Bar T., Ståhlberg A., Muszta A., and Kubista M. 2003. Kinetic outlier detection (KOD) in real-time PCR. Nucleic Acids Res. 31, e105. [DOI] [PMC free article] [PubMed] [Google Scholar]
- Barzon L., Bonaguro R., Castagliuolo I., et al. 2003. Gene therapy of thyroid cancer via retrovirally-driven combined expression of human interleukin-2 and herpes simplex virus thymidine kinase. Eur. J. Endocrinol. 148, 73–80 [DOI] [PubMed] [Google Scholar]
- Böhm J., Hahn A., Schubert R., et al. 1999. Real-time quantitative pcr: DNA determination in isolated spores of the mycorrhizal fungus glomus mosseae and monitoring of phytophthora infestans and phytophthora citricola in their respective host plants. J. Phytopathol. 147, 409–416 [Google Scholar]
- Clementi M. 2000. Quantitative molecular analysis of virus expression and replication. J. Clin. Microbiol. 38, 2030–2036 [DOI] [PMC free article] [PubMed] [Google Scholar]
- Clementi M., Menzo S., Bagnarelli P., et al. 1996. Clinical use of quantitative molecular methods in studying human immunodeficiency virus type 1 infection. Clin. Microbiol. Rev. 9, 135. [DOI] [PMC free article] [PubMed] [Google Scholar]
- Fraaije B., Lovell D., Coelho J., et al. 2001. PCR-based assays to assess wheat varietal resistance to blotch (septoria tritici and stagonospora nodorum) and rust (puccinia striiformis and puccinia recondita) diseases. Eur. J. Plant Pathol. 107, 905–917 [Google Scholar]
- Guescini M., Sisti D., Rocchi M.B., et al. 2008. A new real-time PCR method to overcome significant quantitative inaccuracy due to slight amplification inhibition. BMC Bioinform. 9, 326. [DOI] [PMC free article] [PubMed] [Google Scholar]
- Härtel C., Bein G., Kirchner H., and Klüter H. 1999. A human whole-blood assay for analysis of T-cell function by quantification of cytokine mRNA. Scand. J. Immunol. 49, 649–654 [DOI] [PubMed] [Google Scholar]
- Klein D. 2002. Quantification using real-time PCR technology: applications and limitations. Trends Mol. Med. 8, 257–260 [DOI] [PubMed] [Google Scholar]
- Kruse N., Pette M., Toyka K., and Rieckmann P. 1997. Quantification of cytokine mRNA expression by RT PCR in samples of previously frozen blood. J. Immunol. Methods. 210, 195–203 [DOI] [PubMed] [Google Scholar]
- Limaye A.P., Jerome K.R., Kuhr C.S., et al. (2001). Quantitation of BK virus load in serum for the diagnosis of BK virus–associated nephropathy in renal transplant recipients. J. Infect. Dis. 183, 1669–1672 [DOI] [PubMed] [Google Scholar]
- Mackay I.M., Bustin S.A., Andrade J.M., et al. 2007. Quantification of microorganisms: not human, not simple, not quick, pp. 133–182. In Mackay I.M., ed. Real-time PCR in Microbiology: From Diagnosis to Characterization. Caister Academic Press, Norfolk, United Kingdom [Google Scholar]
- Mehmet D., Ahmed F., Cummins J., et al. 2001. Quantification of the common deletion in human testicular mitochondrial DNA by competitive PCR assay using a chimaeric competitor. Mol. Hum. Reprod. 7, 301–306 [DOI] [PubMed] [Google Scholar]
- Mhlanga M.M., and Malmberg L. 2001. Using molecular beacons to detect singlenucleotide polymorphisms with real-time PCR. Methods. 25, 463–471 [DOI] [PubMed] [Google Scholar]
- Nogva H.K., Bergh A., Holck A., and Rudi K. 2000. Application of the 5-nuclease PCR assay in evaluation and development of methods for quantitative detection of Campylobacter jeuni. Appl. Environ. Microbiol. 66, 4029–4036 [DOI] [PMC free article] [PubMed] [Google Scholar]
- Ramakers C., Ruijter J.M., Deprez R.H.L., and Moorman A.F. 2003. Assumption-free analysis of quantitative real-time polymerase chain reaction (PCR) data. Neurosci. Lett. 339, 62–66 [DOI] [PubMed] [Google Scholar]
- Rao X., Lai D., and Huang X. 2012. New methods for quantification and analysis of quantitative real-time polymerase chain reaction data. J. Comput. Biol. [DOI] [PMC free article] [PubMed] [Google Scholar]
- Ryncarz A.J., Goddard J., Wald A., et al. 1999. Development of a high-throughput quantitative assay for detecting herpes simplex virus DNA in clinical samples. J. Clin. Microbiol. 37, 1941–1947 [DOI] [PMC free article] [PubMed] [Google Scholar]
- Wilhelm J., Hahn M., and Pingoud A. 2000. Inuence of DNA target melting behavior on real-time pcr quantification. Clin. Chem. 46, 1738–1743 [PubMed] [Google Scholar]
- Wilhelm J., Pingoud A., and Hahn M. 2003. Validation of an algorithm for automatic quantification of nucleic acid copy numbers by real-time polymerase chain reaction. Anal. Biochem. 317, 218–225 [DOI] [PubMed] [Google Scholar]
- Zhao S., and Fernald R.D. 2005. Comprehensive algorithm for quantitative real-time polymerase chain reaction. J. Comput. Biol. 12, 1047–1064 [DOI] [PMC free article] [PubMed] [Google Scholar]