

Abstract
Cytokines are signaling biomolecules that serve as key regulators of our immune system. CD4+ T-cells can be grouped into 2 major categories based on their cytokine profile: T-helper 1 (TH1) subset and T-helper 2 (TH2) subset. Protective immunity against HIV infection requires TH1-directed CD4 T-cell responses, mediated by cytokines, such as interleukin-1β (IL-1β), IL-12, interferon-γ (IFN-γ), and tumor necrosis factor-α (TNF-α). Cytokines released by the TH1 subset of CD4 T-cells are considered important for mediating effective immune responses against intracellular pathogens such as Mycobacterium tuberculosis (M. tb). Oxidative stress and redox imbalance that occur during HIV infection often lead to inappropriate immune responses. Glutathione (GSH) is an antioxidant present in nearly all cells and is recognized for its function in maintaining redox homeostasis. Our laboratory previously reported that individuals with HIV infection have lower levels of GSH. In this study, we report a link between lower levels of GSH and dysregulation of TH1- and TH2-associated cytokines in the plasma samples of HIV-positive subjects. Furthermore, we demonstrate that supplementing individuals with HIV infection for 13 weeks with liposomal GSH (lGSH) resulted in a significant increase in the levels of TH1 cytokines, IL-1β, IL-12, IFN-γ, and TNF-α. lGSH supplementation in individuals with HIV infection also resulted in a substantial decrease in the levels of free radicals and immunosuppressive cytokines, IL-10 and TGF-β, relative to those in a placebo-controlled cohort. Finally, we determined the effects of lGSH supplementation in improving the functions of immune cells to control M. tb infection by conducting in vitro assays using peripheral blood mononuclear cells collected from HIV-positive individuals at post-GSH supplementation. Our studies establish a correlation between low levels of GSH and increased susceptibility to M. tb infection through TH2-directed response, which may be relieved with lGSH supplementation enhancing the TH1 response.
Introduction
According to the World Health Organization (WHO) more than 36 million people have died so far due to human immunodeficiency virus (HIV)-related illnesses and an estimated 35.3 million people are currently living with HIV infection (Piot and others 2001; WHO 2014). CD4 T helper (TH1) lymphocytes are crucial regulators of both cell-mediated immune responses against microbial infection and their loss during advanced stages of HIV infection will lead to progression to AIDS (acquired immunodeficiency syndrome) (Ray and others 2006). CD4 T-cells direct the immune system in 2 major pathways: cytokines produced in TH1 pathway favor a cascade of immune responses suited for controlling intracellular infections, or the opposing TH2 pathway, which ensures a humoral-mediated defense against extracellular pathogens (Romagnani 2000).
Our laboratory has previously reported that HIV-positive individuals have significantly lower levels of TH1 cytokines, interleukin-1β (IL-1β), IL-12, interferon-γ (IFN-γ), and tumor necrosis factor-α (TNF-α), combined with elevated levels of immunosuppressive TH2-associated cytokines, such as IL-10, in the plasma (Guerra and others 2011; Vera Tudela and others 2014). While the mechanisms of HIV-rooted immunosuppression are wide and complex, our laboratory has demonstrated an important relationship between HIV disease progression and a physiologically vital biomolecule, glutathione (GSH) (Morris and others 2014).
GSH, an antioxidant present in all eukaryotic cells, is a tripeptide composed of the amino acids glutamine, cysteine, and glycine. GSH plays a role in many aspects of cell physiology and is essential in maintaining redox homeostasis in the cells (Herzenberg and others 1997; Lushchak 2012). We previously reported that the levels of GSH were significantly diminished in individuals with HIV infection due to decreased levels of GSH de novo synthesis enzymes and due to excessive oxidative stress (Morris and others 2014). We also demonstrated that decreased levels of GSH in individuals with HIV infection was accompanied by impaired innate and adaptive immune responses against Mycobacterium tuberculosis (M. tb) infection (Guerra and others 2011, 2012; Morris and others 2012; Morris and others 2013a, 2013b, 2013c, 2013d, and 2014). Because oxidative stress has a profound effect on altering the viability of CD4 T-cells, we believe that depletion of GSH will increase the risk for opportunistic infections.
In this study we propose that the circulating plasma levels of cytokines produced by TH1 subset of CD4 T-cells, such as IL-12, IL-2, and IFN-γ, would be significantly lowered in individuals with HIV infection, and the plasma levels of cytokines known to induce oxidative stress (IL-6) and suppress the immune system (IL-10 and TGF-β), would be significantly elevated. We hypothesize that an increase in the intracellular GSH through oral liposomal GSH (lGSH) supplementation for 13 weeks will increase the production of cytokines, such as IL-12, IL-2, IL-1β, and IFN-γ, allowing individuals with HIV infection to control opportunistic infections resulting from a weakened immune state. We also propose a decrease in the levels of IL-10, TGF-β, and IL-6 in individuals with HIV infection upon completion of a 13-week lGSH supplementation regimen. Reinforcing our hypothesis, we expect decreased oxidative stress and improved control of M. tb infection at the completion of the study.
Our results indicate that restoring the levels of GSH in individuals with HIV infection alleviated oxidative stress, increased the production of IL-1β, IL-12, and IFN-γ, decreased the levels of IL-10, TGF-β, and IL-6, and favored successful control of M. tb infection.
Materials and Methods
Study participants
The Western University of Health Sciences Institutional Review Board approved the study. Statistically relevant sample size was determined by conducting a power analysis. The sample size consisted of individuals between the ages of 21 and 65 years. Inclusion criteria required that all participants were able to read and write English and were diagnosed with HIV before 2012. The exclusion criteria ruled out individuals with allergies, chronic disease, hepatitis, and those who were pregnant. It also excluded individuals that were classified as part of a vulnerable population. A total of 25 individuals were recruited to participate in this study without gender preference. A total of 10 out of 25 individuals were HIV negative and 15 were positive for HIV infection. E-mail and flyers were used to recruit the volunteers for this study from Pomona, California, and nearby areas. The purpose of the study and what was required from each participant was explained to each individual before obtaining their signed consent. Background information for the HIV-positive individuals, including duration of HIV infection and form of antiretroviral treatment, if any, was obtained. HIV-positive individuals were randomly divided into 2 groups, with 1 group receiving GSH supplements formulated in liposomes (lGSH) and the second group receiving empty liposomes as a placebo.
Study overview
Approximately 30 mL of blood was drawn from all of the participants using a Vacutainer Safety Lok Blood Collection Kit (364606; BD Biosciences). After the first blood draw, subjects were given lGSH or placebo supplements and instructed to take one and a half teaspoons of formula twice a day, once in the morning and once in the evening, for 7 weeks. Three teaspoons of lGSH≈15 mL (about 1,260 mg reduced GSH).
At the 7-week time point, participants were asked to come back for a second visit for more supplements. All participants were instructed to continue taking supplements to the completion of 13 weeks and asked to come back for a third and final visit for a final blood draw.
Separation of blood components from whole blood
Density gradient centrifugation using Ficoll-Paque PLUS (10040757; GE Healthcare) was used to separate plasma, red blood cells (RBCs), and peripheral blood mononuclear cells (PBMCs) from whole blood. Plasma and RBCs were aliquoted into separate vials and stored at −80° for further analysis. PBMCs were washed 3× with 1× phosphate-buffered saline (PBS) and were resuspended in RPMI media composed of RPMI, l-glutamine, HEPES (1-041-CM; Corning Cellgro), and 5% human AB serum. PBMC counts were determined using a hemocytometer. Two hundred microliters of PBMCs corresponding to 105 cells were plated on a tissue culture plate precoated with 0.005% poly-l-lysine, and incubated overnight at 37°C to allow monocyte adherence.
Plasma cytokine measurement
To establish a baseline value for the levels of cytokines in healthy and HIV group, cytokine levels were measured in plasma samples from healthy subjects and individuals with HIV infection immediately after recruitment before any intervention. Cytokines were also measured in plasma samples collected from HIV-positive subjects at 13 weeks post-lGSH (or placebo) supplementation to determine whether lGSH supplementation result in any significant changes in the levels of cytokines. Cytokine levels were measured using enzyme-linked immunosorbent assay (ELISA). The cytokines that were measured in the plasma samples isolated from the participants belonging to the 2 study groups include: IFN-γ, IL-1β, IL-2, IL-6, IL-10, IL-12, TGF-β, and TNF-α (IFN-γ, Cat. No. 88-7316; IL-1β, Cat. No. 88-7010; IL-2, Cat. No. 88-7025; IL-6, Cat. No. 88-7066; IL-10, Cat. No. 88-7106; IL-12, Cat. No. 88-7126; TGF-β, Cat. No. 88-8350; and TNF-α, Cat. No. 88-7346; eBioscience ELISA Ready-SET-Go!). The cytokine levels were measured following the manufacturer's protocol.
GSH measurements
Baseline levels of total GSH in healthy and HIV group were measured in PBMCs immediately after recruitment before any intervention. GSH levels were also measured in PBMCs isolated from individuals with HIV infection at baseline and 13 weeks post-lGSH supplementation. A GSH Detection Kit from Arbor Assays (K006-H1) was used to measure concentrations of total GSH. The GSH measurements were done following the manufacturer's protocol. Results were corrected for protein levels and were reported in μM GSH/μg protein.
Reactive oxygen species measurements
Quantifying reactive oxygen species (ROS) levels in plasma and cell lysates of RBCs and monocytes, derived from individuals with HIV infection at pre and post intervention:
ROS production was determined by 2 methods: (1) measurement of malondialdehyde (MDA) (end product of lipid peroxidation, an indirect measure of ROS production) in plasma samples and lysates of RBCs and monocytes (2) CellROX staining of monocytes, CD4, and CD8 T-cells, followed by quantification of fluorescence by flow cytometry (FACS).
MDA measurements
MDA is a byproduct of lipid peroxidation. Once MDA forms an adduct with thiobarbituric acid (TBARS) at 90°C–100°C, a color change occurs which can be measured colorimetrically at 530–540 nm. Baseline levels of MDA in healthy and HIV groups were measured in plasma samples and lysates of RBCs and monocytes, immediately after recruitment before any intervention. MDA levels were also measured in HIV-positive subjects at 13 weeks post-lGSH intervention in plasma samples and lysates of RBCs and monocytes. MDA levels were measured using a TBARS Assay Kit (10009055; Cayman Chemical). The assay procedure included with the kit was followed to obtain MDA sample concentrations. Results were corrected for protein levels and were reported in μM MDA/μg protein.
ROX staining and flow cytometry analysis
The cell-permeant CellROX™ green reagent (C10444; Life Technologies) is nonfluorescent in a reduced state and produces bright near-infrared fluorescence upon oxidation. The resulting fluorescence can be measured using flow cytometry. In addition to allowing ROS detection in live cells, the signal is retained after formaldehyde fixation. PBMCs isolated from the blood of healthy and HIV group after recruitment before any intervention, and from HIV-positive individuals after lGSH intervention, were treated with 5 μM CellROX green reagent and incubated at room temperature for 30 min in the dark. Stained PBMCs were centrifuged at 800g for 5 min and resuspended in 100 μL PBS. Antibodies conjugated to the fluorescent markers such as CD14-PE (12-0149; eBioscience), CD4-Cy5 (15-0049; eBioscience), and CD8-Cy5 (15-0088; eBioscience) were added to the appropriate tubes containing PBMCs and incubated in the dark at 4°C for 30 min. Cell suspension was centrifuged 3× at 800g for 5 min to remove excess staining and then suspended in 1 mL 1× cold PBS. The fluorescence was quantified by flow cytometry. Results were analyzed using FlowJo software version 7.6.5.
PBMC infection studies
PBMCs isolated from blood drawn from individuals with HIV infection at 13 weeks post supplementation were diluted as follows to yield 105 cells/mL: 200 μL of PBMCs was diluted to a total volume of 1 mL by adding 800 μL RPMI media. PBMCs were infected with H37Rv with multiplicity of infection of 10:1 and incubated for 1 h for the uptake of bacteria by the phagocytic cells. Extracellular bacteria were removed by washing the PBMCs 3× with RPMI. During each washing step, PBMCs were centrifuged at 1,800 rpm for 10 min, cell-free supernatants were discarded and the pellet was resuspended in RPMI. After the final wash, infected PBMCs were resuspended in fresh media and then distributed in tissue culture plates. The infected PBMCs were terminated at 1 and 72 h postinfection. Infected PBMCs were lysed by adding 150 μL of cold sterile water. Lysates were diluted and plated on 7H11 containing glycerol and albumin dextrose complex for mycobacterial colonies.
Statistical analysis
Statistical data analysis was performed using GraphPad Prism Software version 6. Levels of cytokines, MDA, GSH, and ROX were compared between 8 HIV-positive individuals in the lGSH supplementation group and 7 HIV-positive individuals in the placebo group after 13 weeks of supplementation using the unpaired t-test with Welch correction. Baseline levels of cytokines, MDA, GSH, and ROX were also compared between all 15 HIV-positive individuals and 10 healthy subjects using unpaired t-test with Welch correction. Reported values are in means. Statistical data analysis of CellROX staining and flow cytometry was completed using the non-parametric version of the unpaired t-test, Mann–Whitney test. Reported values are in medians.
Results
Baseline CD4 T-cell counts in healthy subjects and individuals with HIV infection
Seven out of the total 15 participants who were HIV-positive had CD4 T-cells that were below the minimum normal value of 500 cells/mm3. Eight out of the total 15 participants who were HIV-positive had normal CD4 T-cell counts of 500 cells/mm3 and above. Participants who were not positive for HIV and were classified as healthy had CD4 T-cell counts more than 500 cells/mm3.
Baseline levels of TGF-β and GSH in healthy subjects and individuals with HIV infection
We observed a significant increase in the levels of TGF-β in individuals with HIV infection. TGF-β levels in HIV-positive individuals were 2× greater than their healthy counterpart (Table 3). The baseline levels of total GSH in PBMCs isolated from HIV-positive individuals were significantly lower compared to healthy volunteers (Fig. 1A). In comparison to healthy volunteers, there was a 12-fold decrease in the levels of total GSH in PBMCs isolated from HIV-positive individuals (Fig. 1B and Table 1).
Table 3.
Changes in the Levels of Immunosuppressive Cytokines Before and After lGSH Supplementation
| Cytokine | Function | Fold increase in the levels of cytokines in individuals with HIV infection compared to healthy subjects | Changes in the levels of cytokines in individuals with HIV infection at 3 months post-supplementation with lGSH |
|---|---|---|---|
| TGF-β | Limits T-cell clonal expansion; downregulates glutamine cysteine ligase catalytic subunit | 2× increase | 3× decrease |
| IL-10 | Lowers TH1 responses; suppresses effector mechanisms in macrophages | 6× increase | 6× decrease |
FIG. 1.

Baseline comparison of TGF-β and total glutathione (GSH) levels between healthy subjects and individuals with HIV infection. There was a significant increase in the levels of TGF-β in plasma samples collected from individuals with HIV infection compared to healthy individuals (A). Data represent mean±SE from comparing baseline levels of 10 healthy volunteers and 15 HIV-positive individuals, *P<0.05. Assay of total GSH showed a significant decrease in the levels of total GSH in peripheral blood mononuclear cell (PBMCs) isolated from HIV-positive individuals compared to healthy subjects (B). Data represent mean±SE from comparing baseline levels of 10 healthy volunteers and 15 HIV-positive individuals, *P<0.05.
Table 1.
Changes in the Oxidative Stress Markers Before and After lGSH Supplementation
| Redox changes in the immune cells | Function | Changes in the levels of oxidative stress markers in individuals with HIV infection compared to healthy subjects | Changes in the levels of oxidative stress markers in individuals with HIV infection at 3 months post-supplementation with lGSH |
|---|---|---|---|
| IL-6 | Induces oxidative stress and inflammation | 16× increase | 2× decrease |
| Oxidative stress | Inflammation and cell death | 5× increase in monocytes | 6× decrease in monocytes |
| 2× increase in CD4 T cells | 4× decrease in CD4 T cells | ||
| 7× increase in CD8 T cells | 8× decrease in CD8 T cells | ||
| GSH | Antioxidant; has antimycobacterial and immune enhancing effects | 12× decrease in PBMC | 2× increase in PBMC |
GSH, glutathione; IL-6, interleukin-6; lGSH, liposomal GSH; PBMC, peripheral blood mononuclear cell.
Baseline levels of IL-6 and free radicals in healthy subjects and individuals with HIV infection
The proinflammatory cytokine IL-6 was significantly increased by 16-fold in plasma samples of individuals with HIV infection compared to healthy volunteers (Fig. 2A and Table 1). In line with the increased levels of IL-6, there was a significant increase in the levels of MDA in plasma, RBCs, and monocytes isolated from individuals with HIV infection compared to the healthy volunteers (Fig. 2B–D). We observed a 2-fold increase in the levels of MDA in plasma and monocytes of individuals with HIV infection compared to healthy volunteers (Fig. 2B–C). Furthermore, we observed a 9-fold increase in the levels of MDA in RBCs isolated from individuals with HIV infection compared to healthy volunteers (Fig. 2D). There was also a significant increase in ROS production in CD14+ cells, CD4+, and CD8+ T-cells isolated from individuals with HIV infection as indicated by the intensity of ROX staining (Fig. 2E–G). There was a 5-fold increase in the ROX intensity in CD14+ cells isolated from HIV-positive individuals compared to healthy volunteers (Fig. 2E and Table 1). We also observed a 2- and 7-fold increase in the ROX intensity in CD4+ T-cells (Fig. 2F and Table 1) and CD8+ T-cells (Fig. 2G and Table 1) respectively, that were isolated from individuals with HIV infection compared to healthy volunteers.
FIG. 2.

Baseline comparison of the interleukin-6 (IL-6) and reactive oxygen species (ROS) markers between healthy volunteers and HIV-positive individuals. We observed a significant increase in the levels of the proinflammatory cytokine, IL-6 in plasma samples collected from individuals with HIV infection compared to healthy individuals (A). Data represent mean±SE from comparing baseline levels of 10 healthy volunteers and 15 HIV-positive individuals, ****P<0.00005. Malondialdehyde (MDA), a marker of lipid peroxidation and oxidative stress was significantly increased in plasma (B), red blood cells (RBCs), **P<0.005 (C), and monocytes **P<0.005 (D) from HIV-positive individuals compared to healthy subjects. Data represent mean±SE from comparing baseline levels of 10 healthy volunteers and 15 HIV-positive individuals, *P<0.05. ROS production was also quantified by CellROX staining. CellROX green dye is nonfluorescent in its reduced state and produces bright near-infrared fluorescence upon oxidation. The resulting fluorescence can be measured using flow cytometry. Flow cytometry analysis indicates a significant increase in ROX mean intensity in CD4+ T-cells (E), CD8+ T-cells (F), and CD14+ cells/monocytes (G) from HIV-positive individuals compared to healthy subjects. Data represent medians with range, *P<0.05 when comparing baseline levels of healthy volunteers with HIV-positive individuals using the non-parametric version of the t-test, Mann–Whitney test.
Baseline levels of IL-12, IL-2, and IFN-γ in healthy subjects and individuals with HIV infection
The levels of TH1 cytokines such as IL-12, IL-2, and IFN-γ were significantly diminished in plasma samples isolated from individuals with HIV infection compared to healthy volunteers (Fig. 2A–C). A significant 8-fold decrease in the levels of IL-12 was observed in plasma samples isolated from individuals with HIV compared to healthy volunteers (Fig. 3A and Table 2). We also observed a 2-fold decrease in the levels of IL-2 in plasma samples isolated from HIV-positive individuals compared to healthy volunteers (Fig. 3B). Finally, we observed a 3-fold decrease in the levels of IFN-γ in plasma samples isolated from HIV-positive individuals compared to healthy volunteers (Fig. 3C and Table 2).
FIG. 3.

Baseline comparison of TH1 cytokine (IL-12, IL-2, and interferon-γ [IFN-γ]) levels between healthy volunteers and HIV-positive individuals. Assay of TH1 cytokines showed significant decrease in the levels of IL-12 (A), IL-2 (B), and IFN-γ (C) in plasma samples collected from individuals with HIV infection compared to healthy individuals. Data represent mean±SE from comparing baseline levels of 10 healthy volunteers and 15 HIV-positive individuals, *P<0.05, **P<0.005.
Table 2.
Changes in the Levels of Immune-Stimulating Cytokines Before and After lGSH Supplementation
| Cytokine | Function | Changes in the levels of cytokines in individuals with HIV infection compared to healthy subjects | Changes in the levels of cytokines in individuals with HIV infection at 3 months post-supplementation with lGSH |
|---|---|---|---|
| IL-12 | Polarizes CD4 T-cells toward TH1 response | 8× decrease | 3× increase |
| IFN-γ | Enhances macrophage control of mycobacterial infection | 3× decrease | 2× increase |
| IL-1β | Facilitates lymphocyte-directed immunity | 12× decrease | 10× increase |
| TNF-α | Induces granuloma formation and enhances the intracellular effector mechanisms | 11× decrease | 2.5× increase |
IFN-γ, interferon-γ; TNF-α, tumor necrosis factor-α.
Baseline levels of IL-1, TNF-α, IL-17, and IL-10 in healthy subjects and individuals with HIV infection
The levels of IL-1β, TNF-α, and IL-17 were also significantly diminished in plasma samples isolated from individuals with HIV infection compared to healthy volunteers (Fig. 4A–D). We detected a 12-fold decrease in IL-1β levels and 3-fold decrease in the levels of IL-17 in plasma samples isolated from individuals with HIV compared to healthy volunteers (Fig. 4A–B). We also saw an 11-fold decrease in the levels of TNF-α in plasma samples isolated from individuals with HIV infection compared to healthy volunteers (Fig. 4C and Table 2). IL-10 levels were 6× higher in plasma samples of individuals with HIV compared to the healthy volunteers (Fig. 4D and Table 2).
FIG. 4.

Baseline comparison of IL-1β, tumor necrosis factor-α (TNF-α), IL-17, and IL-10 levels between healthy volunteers and HIV-positive individuals. We observed a significant decrease in the levels of IL-1β (A), TNF-α (B), and IL-17 (C) in plasma samples collected from individuals with HIV infection compared to healthy individuals. There was also a significant increase in the levels of IL-10 (D) in plasma samples collected from individuals with HIV infection compared to healthy individuals. Data represent mean±SE from comparing baseline levels of 10 healthy volunteers and 15 HIV-positive individuals, *P<0.05.
Supplementation of HIV-positive individuals with either lGSH or empty liposomes (placebo)
A total of 15 individuals with HIV infection were recruited for this study without gender preference. The HIV group was further categorized into the placebo group and the lGSH treatment group. A total of 7 individuals with HIV infection were included in the placebo group and a total of 8 individuals with HIV infection were recruited to the lGSH treatment group. The supplementation regimen lasted for 13 weeks. Volunteers were asked to visit the clinic 3× during the study. During the first visit (V1), blood was drawn from the participants for clinical and research laboratory tests (to measure the baseline levels of cytokines, free radicals, and GSH), and to receive supplements sufficient to last for 7 weeks. The second visit (V2) was on the seventh week of the study and during this visit, participants had clinical encounters and received additional supplements to last for another 6 weeks (till the end of the study). During the third visit (V3 on week 13 of the study), blood was drawn from the participants for both research and clinical laboratory tests. Before conducting the trial, baseline levels of cytokines, free radicals, and GSH were first compared between the placebo group and lGSH treatment group using an unpaired t-test with Welch correction to demonstrate that there was no significant difference between the 2 groups during visit 1. None of the participants developed any adverse reactions to either placebo or lGSH.
Changes in the levels of TGF-β and GSH at 13 weeks post supplementation with lGSH
lGSH supplementation in HIV-positive individuals for 13 weeks resulted in a 3-fold decrease in the levels of TGF-β (Fig. 5A and Table 3) along with a 2-fold increase in the levels of total GSH (Fig. 5B and Table 1). Supplementation with empty liposomes for 13 weeks showed no significant difference in the levels of TGF-β and total GSH between visit 1 and visit 3 in the placebo group (Fig. 5).
FIG. 5.

Changes in the plasma TGF-β levels pre- and post-GSH supplementation. Sandwich enzyme-linked immunosorbent assay (ELISA) was performed to compare the cytokine levels between pre-supplementation (V1) and post-supplementation (V3). Assay of cytokines showed a significant decrease in the levels of TGF-β in plasma samples collected from the liposomal GSH (lGSH)-treatment group after 13 weeks of supplementation. There was no significant difference between the levels of TGF-β from the placebo group when comparing visit 1 and visit 3 (A). Data represent mean±SE, *P<0.05 when comparing pre- and post-supplementation levels within placebo or lGSH group. GSH assay was performed to compare the levels of total GSH between pre-supplementation (V1) and post-supplementation (V3). Assay of GSH showed a significant increase in the levels of total GSH in PBMCs of the lGSH-treatment group after 13 weeks of supplementation. There was no significant difference between the levels of total GSH from the placebo group when comparing visit 1 and visit 3 (B). Data represent mean±SE, *P<0.05 when comparing pre- and post-supplementation levels within placebo or lGSH group.
Changes in the levels of IL-6 and free radicals at 13 weeks post supplementation with lGSH
There was no significant difference in the levels of IL-6, MDA, and ROX between visit 1 and visit 3 of the placebo group (Fig. 6B, D, F, H, J, L). Interestingly, treatment with lGSH for 13 weeks significantly decreased the levels of IL-6 as observed by a 2-fold decrease in the levels of this cytokine from visit 1 to visit 3 (Fig. 6A and Table 1). The decreased levels of IL-6 in the lGSH treatment group was accompanied by a significant decrease in the levels of MDA in the plasma (Fig. 6C), RBCs (Fig. 6E), and monocytes (Fig. 6G) as evident by a 2-fold decrease in the levels of MDA in plasma, RBC, and monocyte samples between visit 1 and visit 3 (Fig. 6C, E, G). Furthermore, there was a 4-fold decrease in the intensity of ROX staining in CD4+ T-cells (Fig. 6I and Table 1), 8-fold decrease in the CD8+ T-cells (Fig. 6K and Table 1), and 6-fold decrease in the ROX staining in CD14+ cells from the lGSH treatment group at 13 weeks post-lGSH supplementation (Fig. 6M and Table 1).
FIG. 6.


Difference in plasma IL-6 levels and ROS markers pre- and post-GSH supplementation. Sandwich ELISA was performed to compare the cytokine levels between pre-supplementation (V1) and post-supplementation (V3). Assay of cytokines showed a significant decrease in the levels of IL-6 in plasma samples collected from the lGSH-treatment group. There was no significant difference between the levels of IL-6 from the placebo group when comparing visit 1 and visit 3 (A). Data represent mean±SE, *P<0.05 when comparing pre- and post-supplementation levels within placebo or lGSH group. MDA assay was performed to compare the levels of MDA, a byproduct of lipid peroxidation, between pre-supplementation (V1) and post-supplementation (V3). Assay of MDA showed that there was no significant difference between the levels of MDA in plasma (B), RBC (D), and monocytes (F) from the placebo group when comparing visit 1 and visit 3. The levels of MDA in plasma (C), RBC (E), and monocytes (G) of the lGSH-treatment group significantly decreased after 13 weeks of supplementation. Data represent mean±SE, **P<0.005 when comparing pre- and post-supplementation levels within placebo or lGSH group. Flow cytometry analysis of CellROX mean intensity, an indicator of ROS production, was completed to compare the levels of ROS production in different cell populations between pre-supplementation (V1) and post-supplementation (V3). Flow cytometry analysis of ROX showed that there was no significant difference between the median of ROX mean intensity CD4+ T-cells (H), CD8+ T-cells (J), and CD14+cells/monocytes (L) from the placebo group when comparing visit 1 and visit 3. Median of ROX mean intensity in CD4+ T-cells (I), CD8+ T-cells (K), and CD14+cells/monocytes (M) from the lGSH-treatment group significantly decreased after 13 weeks of supplementation. Data represent medians with range, *P<0.05 when comparing pre- and post-supplementation levels within placebo or lGSH group using the non-parametric version of the t-test, Mann–Whitney test.
Changes in the levels of IL-12, IL-2, and IFN-γ at 13 weeks post supplementation with lGSH
There was a significant increase in the levels IL-12 and IFN-γ in HIV-positive individuals at 13 weeks post supplementation with lGSH (Fig. 7A–C and Table 2). We observed a 3-fold increase in the levels of IL-12 (Fig. 7A and Table 2) and approximately a 2-fold increase in the levels of IFN-γ (Fig. 7B and Table 2). We also observed a tremendous 10-fold increase in the levels of IL-1β (Fig. 8A and Table 2) and a 2.5 increase in the levels of TNF-α (Fig. 8B and Table 2) in the lGSH treatment group. Importantly, supplementation with lGSH for 13 weeks resulted in a 6-fold decrease in the levels of IL-10 (Fig. 8C and Table 3). We did not observe any noticeable changes in the levels of IL-2 and IL-17 in the lGSH group between visit 1 to visit 3 (data not shown). There was no significant difference in the levels of IL-1β, TNF-α, IL-17, and IL-10 in the placebo group.
FIG. 7.

Changes in the plasma TH1 cytokine (IL-12 and IFN-γ) levels pre- and post-GSH supplementation. Sandwich ELISA was performed to compare the cytokine levels between pre-supplementation (V1) and post-supplementation (V3). Assay of cytokines showed a significant increase in the levels of IL-12 (A) and IFN-γ (B) in the plasma samples collected from the lGSH-treatment group after 13 weeks of supplementation. There was no significant difference between the levels of IL-12 (A) and IFN-γ (B) from the placebo group when comparing V1 and V3. Data represent mean±SE, *P<0.05 when comparing pre- and post-supplementation levels within the placebo or lGSH group.
FIG. 8.

Changes in the plasma IL-1β, TNF-α, and IL-10 levels pre- and post-GSH supplementation. Sandwich ELISA was performed to compare the cytokine levels between pre-supplementation (V1) and post-supplementation (V3). Assay of cytokines showed a significant increase in the levels of IL-1β (A) and TNF-α (B) in plasma samples collected from the lGSH-treatment group after 13 weeks of supplementation. On the other hand, a decrease in the levels of IL-10 was observed in the plasma samples collected from the lGSH-treatment group after 13 weeks of supplementation (C). There was no significant difference between the levels of IL-1β (A), TNF-α (B), and IL-10 (C) from the placebo group when comparing V1 and V3. Data represent mean±SE, *P<0.05 and **P<0.005 when comparing pre- and post-supplementation levels within placebo or lGSH group.
Decreased survival of M. tb in PBMCs isolated from individuals with HIV infection at 13 weeks post supplementation with lGSH
We observed a significant decrease in the intracellular survival of H37Rv in PBMCs isolated from HIV-positive individuals at 13 weeks post supplementation with lGSH (Fig. 9). In contrast to the lGSH group, there was a 2-fold increase in the intracellular survival of H37Rv in PBMCs isolated from the placebo group (Fig. 9).
FIG. 9.
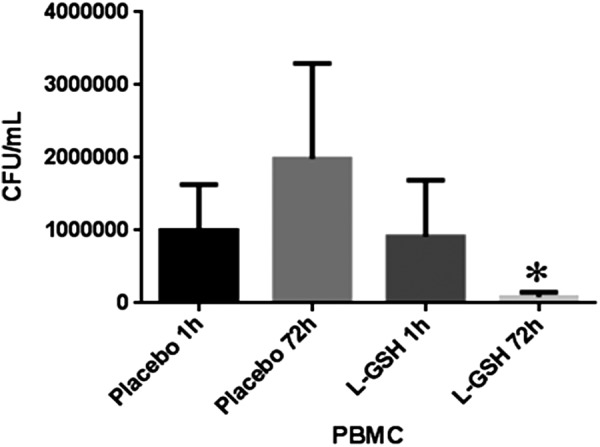
Decreased survival of Mycobacterium tuberculosis (M. tb) in PBMCs isolated from individuals with HIV infection at 13 weeks post supplementation with lGSH. The figure illustrates significant decrease in the intracellular survival of H37Rv in PBMCs isolated from individuals with HIV infection at 13 weeks post-supplementation with lGSH. Data represent mean±SE, *P<0.05 when comparing colony-forming unit counts between 1 and 72 h time points of the lGSH group.
Discussion
We previously demonstrated a pattern of HIV-induced immunosuppression, wherein those cytokines belonging to TH1 subsets were significantly decreased in individuals who were positive for HIV infection (Guerra and others 2011; Morris and others 2012). GSH, a tripeptide with key immunological functions, has been shown to be depleted in individuals with HIV infection (Ray and others 2006; Morris and others 2012). We further demonstrated that deficient GSH levels in individuals with HIV infection trigger impaired cytokine production leading to enhanced susceptibility of HIV-positive individuals to M. tb infection (Venketaraman 2011; Morris and others 2014; Vera Tudela and others 2014). These findings established the foundation for this study.
TGF-β, a cytokine produced by macrophages and regulatory T-Cells (T-Regs), is known for its role in regulating the immune responses by specifically limiting T-cell clonal expansion and proliferation (Kehrl and others 1986; Lotz and Seth 1993; Letterio and Roberts 1998; Garba and others 2002). Studies have shown that TGF-β can diminish the levels of GSH by downregulating the expression of glutamine cysteine ligase catalytic subunit), the rate limiting step enzyme involved in the synthesis of GSH (Chung and others 2003). In this study, we observed that the TGF-β levels were significantly higher in individuals with HIV infection compared to the healthy subjects at the baseline time point (Fig. 1A and Table 3). Increased levels of TGF-β in individuals with HIV infection correlated with significant decrease in the levels of GSH in the PBMCs (Fig. 1B and Table 1). We expected a decrease in TGF-β at 13 weeks, accounting for the effects of GSH supplementation in reducing immunosuppressive cytokines (Fig. 5A). Our data indicated a strong link between GSH supplementation in HIV-positive subjects for 13 weeks and significant reduction in the levels of TGF-β (Fig. 5A and Table 3). Reduced levels of TGF-β that occurred in individuals with HIV infection after 13 weeks supplementation with lGSH correlated with significant increase in the levels of GSH in the PBMCs (Fig. 5B and Table 1). Our findings establish an inverse correlation between TGF-β levels and GSH synthesis and support the previous findings that TGF-β has the ability to downregulate the de novo synthesis of GSH.
IL-6, a proinflammatory cytokine has been shown to induce oxidative stress and systemic inflammation (Wassmann and others 2004; Maeda and others 2010). We observed a significant increase in the levels of IL-6 in the plasma samples of HIV-positive individuals compared to the healthy group (Fig. 2A). Interestingly, lGSH supplementation for 13 weeks resulted in a significant decrease in the levels of IL-6 in HIV-positive individuals (Fig. 6A and Table 1).
Aligned with the lower levels of GSH in PBMCs, we observed that the levels of free radicals were significantly increased in individuals with HIV infection. The MDA assay results showed elevated levels of free radicals in the plasma, monocytes, and RBCs of individuals with HIV infection compared to the healthy cohort (Fig. 2B–D). GSH supplementation for 13 weeks resulted in a marked decrease in the levels of MDA in the same blood components (Fig. 6C, E, G).
The baseline levels of total GSH in PBMCs were significantly decreased in HIV-positive individuals (Fig. 1B) and this decrease was accompanied by a notable elevation in the intensity of ROX staining in monocytes, CD4+ T-cells, and CD8+ T-cells in HIV-positive individuals in comparison to healthy individuals (Fig. 2E–G and Table 1). lGSH supplementation for 13 weeks resulted in a significant decrease in the intensity of ROX staining in monocytes, CD4+ T-cells, and CD8+ T-cells from HIV-positive individuals (Fig. 6I, K, M, and Table 1). We offer this finding as a plausible explanation for the positive correlation between GSH restoration and normalized levels of IL-6 and free radicals.
In line with the diminished levels of GSH and increased levels of TGF-β, IL-6, and free radicals, we found decreased levels of TH1-specific cytokines such as IL-12, IL-2, and IFN-γ in HIV-positive individuals (Fig. 3 and Table 2). We also found increased levels of the TH2-directing cytokine IL-10 in the plasma samples of HIV-positive participants (Fig. 4B and Table 3). Expanding on our hypothesis, we proposed that GSH supplementation in individuals with HIV infection should increase TH1 cytokines while decreasing TH2 cytokines, resulting in a more effective immune response against M. tb infection. Our study measured cytokine levels in the plasma samples derived from HIV-positive individuals before and after supplementation with oral lGSH. HIV-positive individuals receiving a placebo treatment (empty liposomes) were carefully analyzed alongside this group.
In line with our hypothesis that decreased GSH in HIV infection reduces the levels of IL-12 in favor of a TH2-directed effect, we expected levels of IL-12 to be increased after 13 weeks of lGSH supplementation. Our data indicates that relative to the placebo-controlled cohorts, IL-12 levels increased in the lGSH supplement group after 13 weeks of supplementation (Fig. 7A and Table 2).
Likewise, we expected an increase in the levels of IFN-γ after lGSH supplementation, but not after placebo supplementation. Our results indicate a significant increase in the levels of IFN-γ in individuals with HIV infection at 13 weeks post supplementation with lGSH (Fig. 7B and Table 2).
While the aforementioned cytokines are important regulators of adaptive immunity, our hypothesis also anticipated an increase in the levels of IL-1β and TNF-α in the lGSH treatment group.
Baseline levels of IL-1β and TNF-α were markedly decreased in HIV-positive individuals compared to healthy individuals at the initiation of our study (Fig. 4A, B and Table 2). Our results showed a significant increase in the levels of IL-1β and TNF-α in individuals with HIV infection at 13 weeks post lGSH supplementation (Fig. 8A, B, and Table 2).
IL-2 was hypothesized to increase in individuals with HIV infection after the participants had completed the 13-week long lGSH supplementation regimen. However, our data showed no significant difference in the levels of IL-2 after lGSH treatment (data not shown).
We found that baseline levels of IL-17 were significantly lower in individuals with HIV infection compared to healthy volunteers (Fig. 7C). However, our data showed no significant difference in the levels of IL-17 after lGSH treatment (data not shown).
We observed that the baseline levels of IL-10 were significantly higher in individuals with HIV compared to healthy volunteers (Fig. 4D and Table 3). Elevated levels of IL-10 as observed in the plasma samples from individuals with HIV infection will increase the risks for opportunistic infections. lGSH supplementation was effective in reducing the levels of IL-10 at the 13-week mark (Fig. 8C and Table 3). Finally, we observed a significant decrease in the intracellular survival of H37Rv in PBMCs isolated from individuals with HIV infection at 13 weeks post lGSH supplementation (Fig. 9).
Our findings indicate that there is an imbalance created in the cytokine profiles due to the HIV disrupting the body's normal physiological processes and supplementation with lGSH can restore immune responses that could be of great advantage to HIV patients in managing opportunistic infections (Fig. 10).
FIG. 10.

Effects of GSH supplementation in restoring the immune cell functions against M. tb infection.
Acknowledgments
The authors appreciate the funding support from Western University of Health Sciences to conduct this study. The authors thank Your Energy Systems for providing lGSH for this study and for the funding support. Their sincere thanks to all their study participants for taking time out of daily lives to make their study possible.
Author Disclosure Statement
No competing financial interests exist.
References
- Chung SS, Ho EC, Lam KS, Chung SK. 2003. Contribution of polyol pathway to diabetes-induced oxidative stress. J Am Soc Nephrol 14:S233–S236 [DOI] [PubMed] [Google Scholar]
- Garba ML, Pilcher CD, Bingham AL, Eron J, Frelinger JA. 2002. HIV antigens can induce TGF-beta(1)-producing immunoregulatory CD8(+) T cells. J Immunol 168:2247–2254 [DOI] [PubMed] [Google Scholar]
- Guerra C, Johal K, Morris D, Moreno S, Alvarado O, et al. 2012. Control of Mycobacterium tuberculosis growth by activated natural killer cells. Clin Exp Immunol 168:142–152 [DOI] [PMC free article] [PubMed] [Google Scholar]
- Guerra C, Morris D, Sipin A, Kung S, Franklin M, et al. 2011. Glutathione and adaptive immune responses against Mycobacterium tuberculosis infection in healthy and HIV infected individuals. PLoS One 6 (12):e28378. [DOI] [PMC free article] [PubMed] [Google Scholar]
- Herzenberg LA, DeRosa SC, Dubs JG, Roederer M, Anderson MT, et al. 1997. Glutathione deficiency is associated with impaired survival in HIV disease. Proc Natl Acad Sci U S A 94:1967–1972 [DOI] [PMC free article] [PubMed] [Google Scholar]
- Kehrl JH, Wakefield LM, Roberts AB, Jakowlew S, Alvarez-Mon M, et al. 1986. Production of transforming growth factor beta by human T lymphocytes and its potential role in the regulation of T cell growth. J Exp Med 163:1037–1050 [DOI] [PMC free article] [PubMed] [Google Scholar]
- Letterio JJ, Roberts AB. 1998. Regulation of immune responses by TGF-beta. Annu Rev Immunol 16:137–161 [DOI] [PubMed] [Google Scholar]
- Lotz M, Seth P. 1993. TGF beta and HIV infection. Ann N Y Acad Sci 685:501–511 [DOI] [PubMed] [Google Scholar]
- Lushchak VI. 2012. Glutathione homeostasis and functions: potential targets for medical interventions. J Amino Acids 2012:736837. [DOI] [PMC free article] [PubMed] [Google Scholar]
- Maeda K, Mehta H, Drevets DA, Coggeshall KM. 2010. IL-6 increases B-cell IgG production in a feed-forward proinflammatory mechanism to skew hematopoiesis and elevate myeloid production. Blood 115:4699–4706 [DOI] [PMC free article] [PubMed] [Google Scholar]
- Morris D, Gonzalez B, Khurasany M, Kassissa C, Luong J, et al. 2013a. Characterization of dendritic cell and regulatory T cell functions against Mycobacterium tuberculosis infection. Biomed Res Int 2013:402827. [DOI] [PMC free article] [PubMed] [Google Scholar]
- Morris D, Guerra C, Donohue C, Oh H, Khurasany M, et al. 2012. Unveiling the mechanisms for decreased glutathione in individuals with HIV infection. Clin Dev Immunol 2012:734125. [DOI] [PMC free article] [PubMed] [Google Scholar]
- Morris D, Guerra C, Khurasany M, Guilford F, Saviola B, et al. 2013b. Glutathione supplementation improves macrophage functions in HIV. J Interferon Cytokine Res 33:270–279 [DOI] [PubMed] [Google Scholar]
- Morris D, Khurasany M, Nguyen T, Kim J, Guilford F, et al. 2013c. Glutathione and infection. Biochim Biophys Acta 1830:3329–3349 [DOI] [PubMed] [Google Scholar]
- Morris D, Ly J, Chi PT, Daliva J, Nguyen T, Soofer C, Chen YC, Lagman M, Venketaraman V. 2014. Glutathione synthesis is compromised in erythrocytes from individuals with HIV. Front Pharmacol 5:73. [DOI] [PMC free article] [PubMed] [Google Scholar]
- Morris D, Nguyen T, Kim J, Kassissa C, Khurasany M, et al. 2013d. An elucidation of neutrophil functions against Mycobacterium tuberculosis infection. Clin Dev Immunol 2013:959650. [DOI] [PMC free article] [PubMed] [Google Scholar]
- Piot P, Bartos M, Ghys PD, Walker N, Schwartlander B. 2001. The global impact of HIV/AIDS. Nature 410:968–973 [DOI] [PubMed] [Google Scholar]
- Ray K, Gupta SM, Bala M, Muralidhar S, Kumar J. 2006. CD4/CD8 lymphocyte counts in healthy, HIV-positive individuals & AIDS patients. Indian J Med Res 124:319–330 [PubMed] [Google Scholar]
- Romagnani S. 2000. T-cell subsets (Th1 versus Th2). Ann Allergy Asthma Immunol 85:9–18; quiz 18, 21. [DOI] [PubMed] [Google Scholar]
- Trinchieri G. 1997. Cytokines acting on or secreted by macrophages during intracellular infection (IL-10, IL-12, IFN-γ). Curr Opin Immunol 9:17–23 [DOI] [PubMed] [Google Scholar]
- Venketaraman V, Morris D, Donohou C, Sipin A, Kung S, et al. 2011. Role of Cytokines and Chemokines in HIV Infection, HIV and AIDS - Updates on Biology, Immunology, Epidemiology and Treatment Strategies, Dumais Nancy. (Ed.)
- Vera Tudela E, Singh Manpreet Kaur, Lagman Minette, Ly Judy, Patel Nishita, Ochoa Cesar, Venketaraman Vishwanath. 2014. Cytokine levels in plasma samples of individuals with HIV infection. Austin J Clin Immunol 1(1):1003 [Google Scholar]
- Wassmann S, Stumpf M, Strehlow K, Schmid A, Schieffer B, et al. 2004. Interleukin-6 induces oxidative stress and endothelial dysfunction by overexpression of the angiotensin II type 1 receptor. Circ Res 94:534–541 [DOI] [PubMed] [Google Scholar]
- WHO. 2014. Global update on the health sector response to HIV, 2014. (2014, July 1)