Figure 3.
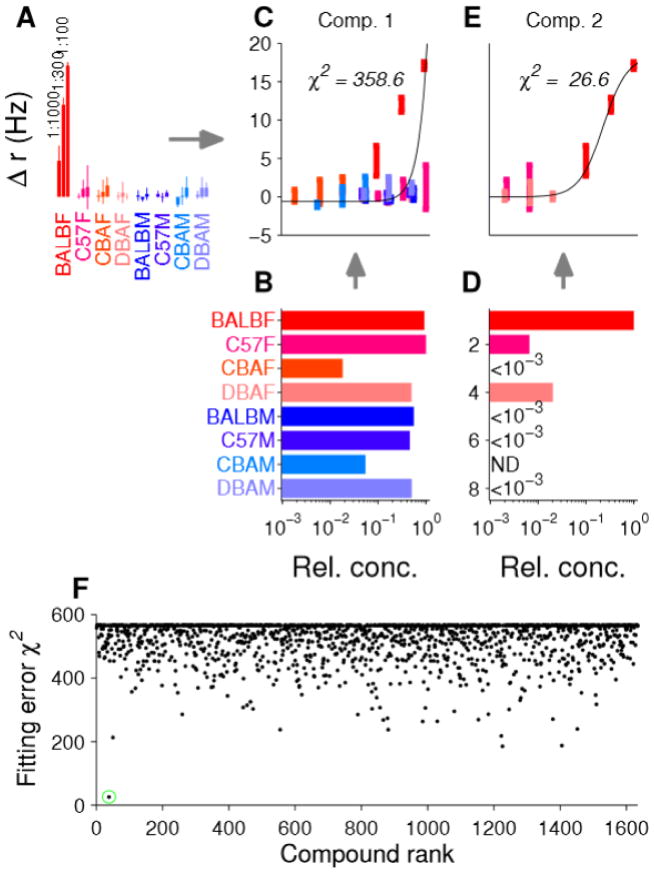
Matching component concentrations to single-neuron activity patterns. (A) Firing rate of a neuron from the second class in Figure 2C, marked with a yellow arrow in Figure S1. (B) Relative abundance across samples of a component with m/z 336.0723 eluting between 34–37% acetonitrile. (C) Incorporation of the abundance with the dilution factor for each stimulus leads to a putative dose-response curve as a function of the concentration of this particular component. Fitting the points to a Hill model leads to a goodness-of-fit measured by χ2. This example represents a very poor fit (p < 10−50). (D) Another component with m/z 427.1793 eluting between 52–56% acetonitrile is most abundant in BALB/c female urine. (E) The dose-response curve from this second component fits well (p = 0.18). (F) χ2 for a class 1 neuron (Figure 2C, marked with a green arrow in Figure S1) for each of 1,634 components. Only a single component (marked with a green circle), the one in D&E, represents a good fit (χ2 < 75). See also Figure S2.

