

Peri‐Ablation Monitoring of RFA Lesion Stiffness
Introduction
Elastography imaging can provide radiofrequency ablation (RFA) lesion assessment due to tissue stiffening at the ablation site. An important aspect of assessment is the spatial and temporal stability of the region of stiffness increase in the peri‐ablation period. The aim of this study was to use 2 ultrasound‐based elastography techniques, shear wave elasticity imaging (SWEI) and acoustic radiation force impulse (ARFI) imaging, to monitor the evolution of tissue stiffness at ablation sites in the 30 minutes following lesion creation.
Methods and Results
In 6 canine subjects, SWEI measurements and 2‐D ARFI images were acquired at 6 ventricular endocardial RFA sites before, during, and for 30 minutes postablation. An immediate increase in tissue stiffness was detected during RFA, and the area of the postablation region of stiffness increase (RoSI) as well as the relative stiffness at the RoSI center was stable approximately 2 minutes after ablation. Of note is the observation that relative stiffness in the region adjacent to the RoSI increased slightly during the first 15 minutes, consistent with local fluid displacement or edema. The magnitude of this increase, ∼0.5‐fold from baseline, was significantly less than the magnitude of the stiffness increase directly inside the RoSI, which was greater than 3‐fold from baseline.
Conclusions
Ultrasound‐based SWEI and ARFI imaging detected an immediate increase in tissue stiffness during RFA, and the stability and magnitude of the stiffness change suggest that consistent elasticity‐based lesion assessment is possible 2 minutes after and for at least 30 minutes following ablation.
Keywords: acoustic radiation force impulse imaging, elastography, intraprocedure radiofrequency ablation lesion assessment, shear wave elasticity imaging
Introduction
An imaging technique that provides visual feedback of radiofrequency ablation (RFA) completeness could potentially increase the efficacy of transcatheter cardiac ablation (TCA) procedures for the treatment of cardiac arrhythmias.1 At lethal RFA temperatures, structural proteins (collagen, elastin), and myofilaments (myosin, actin) immediately and irreversibly coagulate;2 this thermocoagulation is believed to be an endpoint for permanent cell injury3, 4 and causes the ablated region to become stiffer than the surrounding myocardium.5 Elastography imaging can visualize thermocoagulated lesions due to the increase in tissue stiffness.6 Ultrasound‐based techniques (acoustic radiation force or ARF‐based imaging,7, 8, 9, 10, 11 strain imaging12) and magnetic resonance elastography (MRE)13 are both currently being investigated as possible tools for intra‐procedure lesion assessment.
Two‐dimensional (2‐D) acoustic radiation‐force impulse (ARFI) imaging is an ARF‐based ultrasound imaging method.14 ARFI images are constructed by applying a sequence of short‐duration acoustic impulses to tissue over a lateral field of view and measuring the resulting tissue displacement with conventional ultrasound. The measured ARFI‐induced displacement magnitude is inversely proportional to tissue stiffness and presents a representation of the relative stiffness.14, 15 We have previously shown in vitro that ARFI imaging can visualize RFA lesions,16, 17 and that in vivo intracardiac echocardiography (ICE) based diastolic ARFI imaging can provide high‐contrast visualization of stiff atrial lesions consistent with electrical block at the imaging site.7, 18 Initial results from a clinical feasibility study demonstrated that ARFI imaging could identify stiffness changes consistent with RF ablation in human patients.8
Shear wave elasticity imaging (SWEI) is another ARF‐based elastography technique that uses acoustic impulses to displace tissue, but monitors the off‐axis propagation of the radiation‐force induced transverse shear wave.19 The velocity of propagation, or shear wave speed (SWS), is a function of the tissue material properties and is proportional to the tissue stiffness.20, 21 Pernot et al.,9 Hollender et al.,11 and Kwiecinski et al.10 have previously demonstrated the use of shear‐wave elastography methods to quantify RFA lesion stiffness in vitro and in vivo.
It is important to the clinical translation of any lesion evaluation technique that relies on elastography to determine if the visualized region of stiffness increase (RoSI) is spatially and temporally stable in the presence of transient physiological responses in the peri‐ablation period. This study used high‐spatial resolution (sub‐millimeter) epicardial 2‐D ARFI image monitoring (1 image every 30–60 seconds) of 6 right ventricular (RV) endocardial RFA sites in an open‐chest canine model to characterize the spatial and temporal stability of the RoSI in the peri‐ablation period. It is important to note that while a relatively stiff lesion can be differentiated from untreated myocardium in qualitative elastography images, variability between patients and imaging conditions could make it difficult to establish a universal parametric threshold to delineate lesion from healthy tissue based on the relative stiffness; this work does not aim to determine the threshold to define RF‐treated myocardium. Rather, in this experiment a constant 2‐D imaging plane is used to monitor tissue stiffening during RFA and to characterize the evolution of the RoSI in the 30 minutes following the ablation.
Methods
Animal Experimental Procedure
This protocol was approved by the Duke University Animal Care and Use Committee and conformed to the Guide for the Care and Use of Laboratory animals.22
Six canine subjects were anesthetized (preanesthesia: intramuscular acepromazine 0.02–0.05 mg/kg followed by intravenous propofol 4–6 mg/kg; general anesthesia: isoflurane gas 1–5% via inhalation), intubated, and ventilated. A median sternotomy was performed and the pericardium was opened and sutured to form a cradle. A linear ultrasound transducer was mounted into a vacuum‐coupling device and rigidly mounted against the RV epicardium. The vacuum‐coupling device was lightly suctioned to the epicardium to maintain the imaging plane; it held the transducer 1 cm from the heart and imaged through an ultrasonically transparent standoff. This located the imaging focus at the center of the myocardial wall (Fig. 1, panel A).
Figure 1.
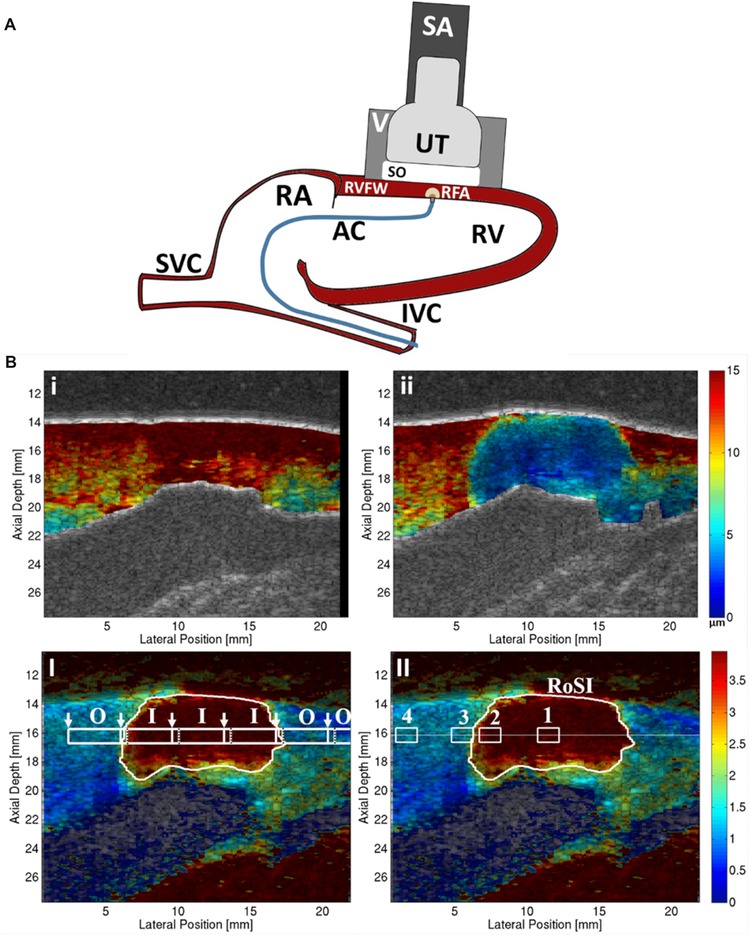
Panel A: Experimental setup. The VF10‐5 ultrasound transducer (UT) and gel standoff (SO) were held by a vacuum (V) apparatus and positioned directly onto the right ventricular free wall (RVFW) using an adjustable stabilization arm (SA). The ablation catheter (AC) was introduced to the right ventricle (RV) through the inferior vena cava (IVC) and right atrium (RA) and brought in contact with the endocardium directly under the UT. The RF‐ablation (RFA) lesion formed in the ARFI imaging plane. Panel B: Top row: Peak ARFI‐induced displacement images (units μm; red = high displacement, compliant tissue; blue = low displacement, stiffer tissue) in the B‐mode detected myocardium before (i) and after (ii) RFA. Bottom row: Relative stiffness ARFI images (unit‐less, red = large stiffness increase, blue = little, no stiffness increase relative to preablation image) with the automatically detected‐RoSI boundary (white trace). (B‐I) Shear wave speed (SWS) measurement‐regions (white boxes) inside the RoSI (I) and outside the RoSI (O); white arrows indicate ARFI‐excitation locations and black dotted line indicates furthest tracking distance right of the excitation location. Note: the tracking measurement‐regions overlap. (B‐II) ROI (white boxes) for (1) the RoSI centroid, (2) 0.25 mm inside the edge of the RoSI, (3) directly outside the RoSI, and (4) 3 mm outside the edge of the RoSI in unablated myocardium at the depth of the detected‐lesion centroid (horizontal white line).
A single imaging acquisition collected a 2‐D B‐mode image, a 2‐D ARFI image, and 6 equally spaced SWEI measurements (1 acquisition per heart beat). All ARFI images and SWEI measurements were ECG‐gated to diastole to maximize the stiffness contrast between the ablated tissue and surrounding myocardium and to minimize the effects of cardiac motion on the displacement estimation.7, 23 Respiration was suspended during the imaging acquisition to minimize the effects of gross motion. Overall, a full imaging acquisition took approximately 150 milliseconds.
The RFA catheter was positioned into the field of view and acquisitions were taken before RFA, and every 30–45 seconds during and for 30 minutes after a 60‐second endocardial ablation. Ablations were performed with a nonirrigated catheter (Celsius®, Biosense Webster, Diamond Bar, CA, USA) with tip temperature limited at 65 °C and a maximum allowable power of 30 W. All images, including the baseline images, were acquired with the ablation catheter in place. This ensured any tissue stiffness or position changes due to the catheter contact‐force were consistent over the monitoring period.
At the end of the study, the animal was euthanized and the heart removed. Each lesion (1–4 attempts per canine) was sectioned parallel to the approximate imaging plane. The tissue samples were stained with triphenyltetrazolium (TTC) to confirm the presence of a lesion.
Imaging Methods and Image Processing
Imaging was performed with a VF10‐5 linear transducer and modified Antares scanner (Siemens Medical, Issaquah, WA, USA). All images were formed with an imaging center frequency of 8.0 MHz, an ARFI excitation frequency of 5.7 MHz, and an imaging focus of 1.6 cm or 2.0 cm. ARF‐induced tissue displacement during the tracking time was calculated using the Loupas algorithm;24, 25 pixel locations with a low (<0.90) median magnitude complex cross‐correlation coefficient, indicating a poor displacement estimate, were removed from the ARFI image.14 Bulk axial motion of the cardiac wall during the acquisition was removed by applying a quadratic extrapolation motion filter.14, 23, 26
The maximum ARFI‐induced displacement at each pixel location was plotted in 2‐D using color to represent the displacement magnitude (Fig. 1, panel B). Each pixel was then normalized using the baseline displacement measured in the preablation image. This normalization reduced the effects of the focal depth of field and energy attenuation on the displacement magnitude.16 Each pixel's normalized displacement value was converted to relative stiffness by calculating the inverse.15 In other words, relative stiffness equaled 1/normalized ARFI‐induced displacement, and represented the relative increase in stiffness from the preablation image (Fig. 1, panel B). The final image was median filtered spatially with a 0.1 axial by 0.5 mm lateral kernel.
SWS was calculated for each SWEI measurement region (1×5 mm) using the Radon sum transformation algorithm described by Rouze et al.20, 27, 28 The SWEI measurement‐regions were centered in the myocardium at the axial depth of the RoSI centroid to ensure tracking of propagating shear waves and not transverse surface (Rayleigh‐Lamb) waves.29
The cyclic motion of the heart and lungs inevitably caused small translations of the imaging plane between image acquisitions. These were corrected by shifting the images acquired over time by a few pixels in the axial and lateral directions. The lateral and axial offset corrections were calculated by maximizing the 2‐D normalized cross‐correlation of sequential B‐mode images using only the image region containing the myocardial wall. The corresponding ARFI and SWEI images were adjusted using these offsets.
Temporal Stability of the Region of Stiffness Increase
A relative stiffness threshold was applied (mean relative stiffness in the myocardium minus one‐half of the standard deviation) to the images, and the region of stiffness increase (RoSI) was identified as the pixel locations with a stiffness increase greater than the threshold in at least 75% of the postablation images. The mathematical centroid of the RoSI (see Fig. 1, panel B‐II) was defined as the center of this region.
Each SWS measurement region (see Fig. 1, panel B‐I) was classified as inside (I) the RoSI if more than 90% of the measurement‐region pixels were inside the RoSI, or outside (O) the RoSI if less than 5% of the measurement‐region pixels were inside the RoSI. The SWS for each measurement region was plotted over the 30 minute time course, and stabilization time constants were calculated. Individual measurement regions where the standard deviation of the SWS through the time course was more than 2 m/s, likely due to motion or an unstable heart rhythm, were excluded from the analysis (2 of 36 total SWEI measurement‐regions, both in the same lesion).
For the ARFI images, 4 1×1 mm ROIs at the axial depth of the RoSI centroid were defined for each lesion group at the following lateral positions (Fig. 1, panel B‐II): (1) the RoSI centroid, (2) 0.25 mm inside the edge of the RoSI, (3) directly outside the RoSI, and (4) 3 mm outside the edge of the RoSI in unablated myocardium. The mean relative stiffness of the 4 ROIs at each ablation site was plotted versus time to examine the temporal stability. A Tukey's honest significant difference multiple comparison test was used to determine if the mean relative stiffness for ROIs 1–3 were significantly different than in the unablated ROI; stabilization time constants were calculated if the mean stiffness in the regions were significantly different.30
An exponential curve fit (eq. (1)) was used to find the stabilization time constants, where t (units, s) is time, xFinal, and xInitial were the fitted steady‐state and initial values, and τ (units, s) is the fitted stabilization time constant. The time to stabilization was calculated as 3 times the time constant, or when 95% of the steady‐state value was reached.
| (1) |
To characterize any change in the relative stiffness of the myocardium adjacent to the RoSI, the average relative stiffness for several regions around the RoSI border was plotted to visualize stiffness changes. For each ablation site, the images taken 5, 10, 15, and 30 minutes after RFA were used to calculate the mean relative stiffness for 5 laterally neighboring 1×1 mm regions axially centered at the RoSI centroid and located 0, 1, 2, 3 mm from the RoSI edge and the 5th region just inside the RoSI. These results for all lesions were averaged to visualize any overall stiffening trends. Any pixels that were contained in the RoSI were excluded from the means for the adjacent myocardial regions, and any non‐RoSI pixels were excluded from the mean of the region inside the RoSI. These analyses were repeated for additional axial locations 1 mm above (closer to epicardium) and below (closer to endocardium) the RoSI centroid.
Spatial Stability of the Region of Stiffness Increase
For each RoSI, the relative stiffness across the lateral field of view at the axial depth of the lesion centroid was compiled into a single image of the 30 minute time course to visually examine the stability of the RoSI width.
As previously mentioned, selecting a universal relative stiffness threshold to differentiate RFA lesion from healthy myocardium is problematic due to variability between subjects and the slight differences in imaging conditions such as myocardial depth and instant in the cardiac cycle;7 although for this study, which aims solely to observe any change in the lesion stiffness between consecutive images, a single relative stiffness threshold was used to determine the evolution of the RoSI area. Kwiecinski et al. found the estimated increase in SWS after RFA to be approximately 2‐fold in vivo.10 Grondin et al. showed the average value of strain after ablation was 2.6 times lower than before ablation in human patients.12 For this study a threshold of 2, equivalent to 2 times the stiffness prior to the ablation, defined the RoSI area. For RoSI areas bounded by the field of view, the area calculation was bounded by the edge of the image. The RoSI area was plotted as a function of time, and the stability time constant and stabilization time were calculated (eq. (1)). The RoSI area was confirmed to be stable after the defined stabilization time, as the mean slopes of the linear regression time trends for each lesion after this point were all found to be small.
Results
A total of 12 ablations were attempted in 6 canine subjects, but full analysis was completed for only 6 lesions. All 6 of the unreported lesions had significant shifts of the transducer imaging plane during the 30 minutes of recording. Pathology confirmed the presence of a necrotic lesion at all imaging sites.
Figure 2 shows relative stiffness ARFI images for 2 ablation sites before, during, and after RFA. During RFA, the relative stiffness increased radially outward from the ablation catheter contact point, forming a stiff semicircular lesion. The relative stiffness ROI (white boxes) are displayed on the ARFI images. The full sets of relative stiffness ARFI images for these 2 lesions are included in the Supporting Information (Videos S1 and S2). To convey the difficulty of maintaining the imaging plane position during the 30 minute monitoring period, a video example of the B‐mode images for an unanalyzed lesion showing a significant shift in the imaging plane during the monitoring period is also included with the online Supporting Information (Video S3).
Figure 2.
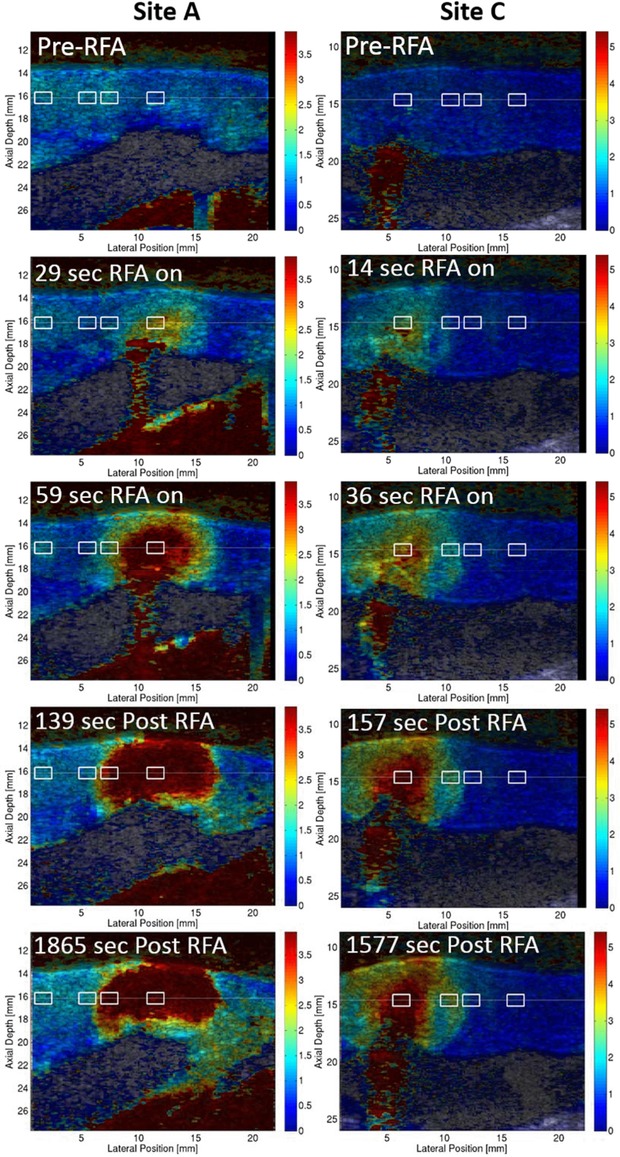
2‐D relative stiffness images of RFA ablation sites A and C (white boxes, relative stiffness ROI) before ablation, during RFA delivery, within 3 minutes of the ablation, and more than 25 minutes after ablation.
Temporal Stability of the Region of Stiffness Increase
The Tukey multiple comparison test determined the postablation mean relative stiffness for both of the ROI inside the RoSI were significantly different than the stiffness of the unablated ROI for all 6 lesions. The mean relative stiffness of the ROI directly outside the boundary was not significantly different than the unablated ROI stiffness for any lesion.
Figure 3 shows temporal plots and the respective curve fits of the SWS inside and outside the RoSI (panel A) and the mean relative stiffness in the ARFI image ROI (panel B). Postablation, the average (n = 6) SWS inside all RoSI was 4.20 ± 0.62 m/s and 1.36 ± 0.37 m/s outside the RoSI. The average (n = 6) relative stiffness postablation was 5.65 ± 1.83 at the RoSI centroid, 3.50 ± 0.82 at the inside edge, 1.29 ± 0.17 directly outside the lesion, and 1.14 ± 0.22 3 millimeters from the RoSI edge. Table 1 summarizes the stabilization time results.
Figure 3.
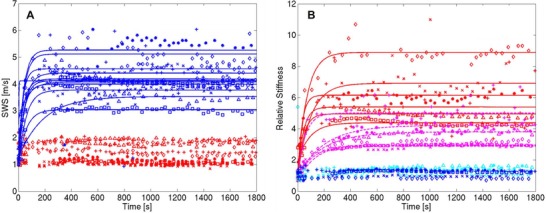
Time course plots for all RoSI: (A) SWEI measurement‐regions inside (red) and outside (blue) the RoSI and (B) mean relative stiffness in ARFI image ROI at the RoSI centroid (red), 0.25 mm inside the edge of the RoSI (magenta), directly outside the RoSI (cyan), and 3 mm outside the edge of the RoSI in unablated myocardium (blue). RF‐energy delivery commenced at 0s and terminated at 60 s. Exponential stabilization curve fits are shown as solid lines.
Table 1.
Stabilization Times for SWS and Relative Stiffness Inside the RoSI.* Includes 60s Ablation Time
| Stabilization Time, 3/τ s | ||||
|---|---|---|---|---|
| Relative Stiffness | ||||
| Site | SWS † Inside | Centroid | Inside Edge | Area |
| A | 348 | 128 | 617 | 172 |
| B | 118 | 94 | 616 | 117 |
| C | 156 | 292 | 327 | 158 |
| D | 128 | 125 | 172 | 79 |
| E | 169 | 279 | 378 | 258 |
| F | 72 | 212 | 315 | 105 |
| Mean | 165 ± 99 | 189 ± 85 | 404 ± 178 | 148 ± 64 |
*SWS = shear wave speed; RoSI = region of stiffness increase; τ = stabilization time constant.
†If more than 1 SWEI measurement‐region per lesion, reports mean.
Figure 4 shows a histogram plot of the average increase in relative stiffness in the area surrounding the RoSI. While there was no significant difference between the relative stiffness of the unablated ROI and ROI just outside the RoSI boundary for each individual lesion as seen in Figure 3, Figure 4 reveals on average there is a slight increase in stiffness in the tissue directly outside the RoSI (light blue bar). This increase is small and appears to stabilize after 15 minutes, and the region inside the RoSI remains significantly stiffer. This trend is similar at all 3 axial depths shown.
Figure 4.
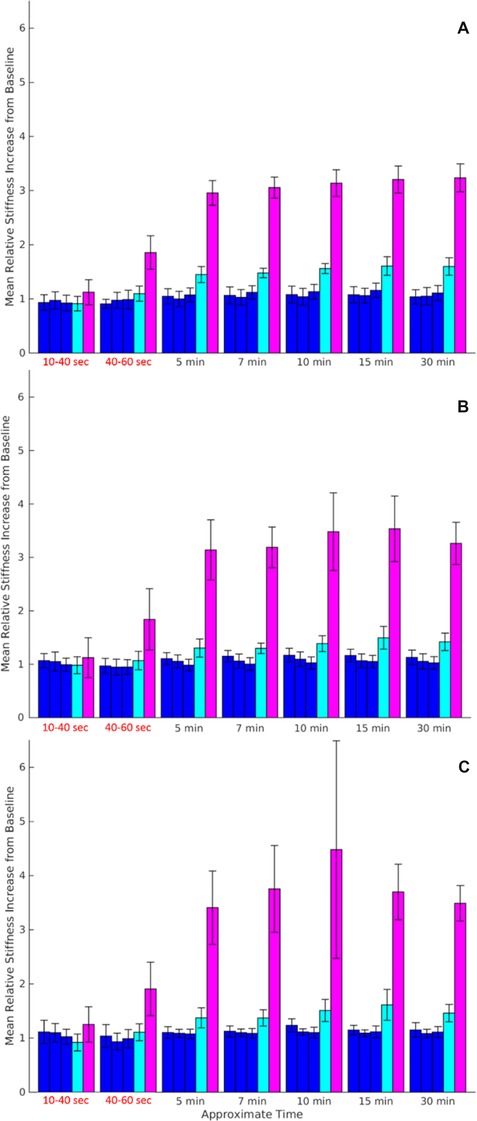
Histogram plots showing the average relative stiffness at all ablation sites for 6 1×1 mm regions. Histogram bars represent from left to right the regions laterally positioned 3, 2, and 1 mm from the RoSI edge (blue), outside the RoSI edge (cyan), and directly inside the RoSI (magenta). Plots are for axial positions of (A) 1 mm above the RoSI centroid, closer to epicardium, (B) centered at the lesion centroid, and (C) 1 mm below the lesion centroid, closer to endocardium. Error bar line represents standard error between ablation sites (n = 6).
Spatial Stability of the Region of Stiffness Increase
The relative stiffness of tissue located at a constant axial depth through the time course is shown in Figure 5. The figure shows the relative stiffness (color) as a function of time (x‐axis) and lateral coordinate (y‐axis). Visualization of the relative stiffness data in this way demonstrates how the RoSI border and the stiffness within the RoSI remain spatially stable throughout the monitoring period.
Figure 5.
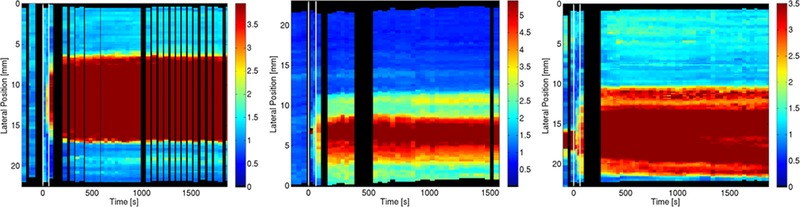
Plot showing the stability of both the measured relative stiffness and the width of the RoSI for 3 different ablation sites. Color represents the relative stiffness value according to the scale shown. The measured ARFI stiffness in the lateral plane through the centroid of the lesion is plotted as a 30 s wide vertical bar centered at the acquisition time. Black regions represent temporal gaps (x) or the lateral translation (y) of an image based on the registration analysis. The ablation power is delivered between 0 and 60 s (white vertical lines). The RoSI is evident as the high relative stiffness region (red).
Figure 6 shows a plot of the RoSI area and the stabilization curve fit over the time course for the 6 ablation sites. In all, the RoSI area grows rapidly during RFA and stabilizes within 2 minutes of the start of RF‐delivery.
Figure 6.
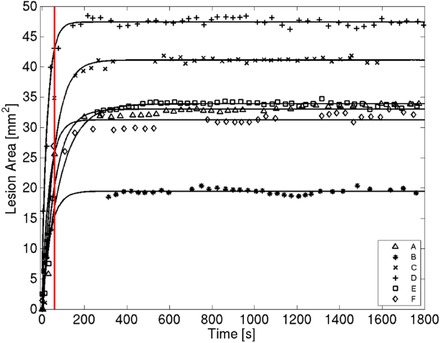
Time course plot of RoSI area as detected by an ARFI relative stiffness threshold of 2. RF energy delivery commenced at 0 s and was terminated after 60 s (red vertical line). Exponential stabilization curve fits are plotted as solid lines.
Discussion
This investigation used 2‐D ultrasound elastography imaging to monitor the evolution of myocardial stiffness changes caused by thermal ablation. To our knowledge, this is the first study to capture elastography generated images of RF‐induced tissue stiffening during ablation in vivo and to monitor changes in the stiffened region during the peri‐ablation period.
The stiffness data were used to calculate stabilization time constants that characterize the temporal and spatial stability of the change in tissue stiffness around the ablation site. These time constants showed that the detected RoSI sites were stable within 3 minutes of the ablation.
A recent study in human patients (n = 3) by Grondin et al. observed an average increase in lesion stiffness in the peri‐ablation period when lesion strain was measured at specific times after ablation, and then reevaluated between 5 and 20 minutes later. Because of the limited time and spatial (2–3 mm axial kernel) resolution, they were unable to characterize the time course of this stiffening or report changes in detected lesion size.12 Our data showed that the stiffness at the RoSI center increased immediately during RFA and was stable 2 minutes after ablation. This finding is consistent with studies that have shown thermocoagulation continues through the first minute post‐RF‐heating until the treated tissue temperature cools below the critical ablation range (∼48 °C).31, 32 We also found that the stiffness at the inside edge of the RoSI took as long as 10 minutes (mean: 6.5 minutes) to equilibrate. It is important to note that the increases in stiffness (13 ± 9%) associated with these longer time constants were not significant and did not cause a measurable increase in lesion area as defined by a threshold of 2 times the relative stiffness increase. The longer stabilization time could be attributed to the resolution of hyperthermic contraction‐band necrosis33 or equilibration of the hydrostatic pressure at the ablation site.34, 35 Based on these results, the relative stiffness and RoSI area appear stable and consistent approximately 2 minutes after completing an ablation, and intra‐procedure elastography assessment of lesions should provide reproducible lesion size results within minutes of treatment.
While we did not quantify the extent of acute interstitial edema, histological analysis has shown the zone around lesions can contain immune fluid infiltrate.35, 36, 37 An MRI study by Lardo et al. observed the delayed onset and stabilization of local interstitial edema 10–12 minutes after RFA ablation.34 In our study, while a slight increase in stiffness was observed in the 1 mm of myocardium adjacent to the RoSI within 15 minutes of the ablation, consistent with interstitial edema or fluid displacement from the thermocoagulated lesion core, the relative stiffness in this region remained significantly less than inside the RoSI and was not significantly different than untreated myocardium. There is evidence to support that ARFI imaging can detect hydrostatic pressure‐induced increases in tissue stiffness from a limited feasibility study that found that ARFI imaging could visualize cryoablation lesions in vivo.38 The primary cause of the relative stiffness increase in cryo‐lesions is severe edema and hemorrhage at the freeze site.38, 39 We have also shown previously that ARFI imaging visualizes the thermocoagulation‐induced increase in tissue stiffness in vitro, where there is no inflammatory response.16, 17 Therefore, it is likely that, if present in this study, edema either occurred during the ablation concurrent with the increase in stiffness due to thermo‐coagulation, or the hydrostatic pressure increase caused by late occurring edema caused a nonsignificant change in tissue stiffness compared to thermo‐coagulation.
We have previously shown that ARFI imaging can be implemented from an ICE catheter transducer.7, 16, 40 While the use of ICE‐based ARFI has been shown during clinical TCA procedures, the experimental setup described in this study is not possible in the clinic. The use of a large linear transducer placed directly on the epicardial surface (1) maximized imaging plane stability over the time course, (2) minimized interference from the RF‐energy application sometimes present when using ICE, (3) maximized the ARFI imaging field of view, and, most importantly, allowed us to characterize the changes that actually occurred and not the ability of currently available clinical technology to measure the changes.
Results from both SWEI and ARFI imaging were reported in this study as they have complementary advantages: ARFI imaging provides high temporal and spatial resolution of relative tissue stiffness at higher signal to noise ratio, while SWEI measures absolute tissue stiffness with somewhat limited resolution. The higher spatial resolution of ARFI imaging may be better suited for clinical assessment of RFA lesions, but in this study SWEI was valuable because it verified the absolute increase in tissue stiffness.
Study Limitations
A direct comparison between the ARFI imaging determined RoSI area and the stained necrotic lesion pathology was not possible in this study due the likelihood of large registration errors between the histological cross‐section and the actual imaging plane. Despite the lack of a direct comparison, gross pathological examination confirmed the presence and the general shape of the RFA lesions at all imaging sites (see Supporting Information).
Movement of the imaging plane was the primary cause of loss of data in this study. The registration process was able to adjust for small axial and lateral shifts of the imaging plane, but was unable to correct for elevational or angular spatial translations; slight changes in the imaging plane in these directions could have resulted in the imaging of a different cross‐section of the lesion, leading to artificial changes the RoSI. We chose to use only data sets with enough temporal stability of the imaging plane to allow a meaningful analysis.
All measurements of stiffness were gated to occur during diastole. The QRS of the previous beat was used as the trigger. The delay between the QRS and the start of imaging was held constant over the 30 minute time course; changes in the heart rate during this period would have caused some images to be acquired during a slightly different time in the cardiac cycle. This change could have accounted for some of the registration problems that contributed to the loss of some data sets.
An exponential fit for the time course data was chosen because it visually provided a reasonable fit for the data and allowed for the calculation of a time constant. We did not attempt to prove mathematically that this is the appropriate function; regardless, all data measurement points used for the model fits are included in the plots and appear observationally to be consistent with the findings of the time constant calculations.
Conclusion
This investigation was the first of its kind to monitor the evolution of RFA‐induced tissue stiffening at transcatheter cardiac ablation sites. SWS and ARFI measured stiffness increased within the RFA‐treated myocardium during tissue heating and stabilized within the first 2 minutes after ablation. There was no significant change in the stiffness of the adjacent myocardium, and the lesion area, measured using a stiffness threshold, stabilized within 2 minutes of completing ablation. The findings strongly suggest that edema does not significantly alter tissue stiffness surrounding the lesion in the peri‐procedural period in a way that would compromise the utility of elastography based lesion evaluation. Overall, elastography imaging remains a promising technique for intra‐procedure thermal lesion evaluation.
Supporting information
Video S1. 2‐D relative stiffness images of RFA site A throughout the full monitoring time course, including before ablation, during RFA delivery, and during the 30 minutes after ablation. The lesion presents as a uniformly stiff region with a discrete boundary, and the shape and stiffness remain stable throughout the time course.
Video S2. 2‐D relative stiffness images of RFA site C throughout the full monitoring time course, including before ablation, during RFA delivery, and during the 25 minutes after ablation. The lesion has a discrete border, and appears as a stiff region with stiffer core. This appearance is consistent with a thermocoagulated lesion with a collagen charred core
Video S3. B‐mode images from a full monitoring time course where there was a significant shift in the 2‐D imaging plane. The data for this ablation site were excluded from the analysis.
Figure S1. B‐mode (left), relative stiffness ARFI images (center), and approximate pathology cross‐sections (right) for lesion A‐F. TTC staining of pathology specimens confirms thermo‐coagulated lesions (white, charred brown core) surrounded by viable myocardium (dark red).
Acknowledgments
We would like to thank Siemens Healthcare for their hardware system and support, Ellen Dixon‐Tulloch for her assistance during the procedures, and Kelly Kang for her assistance with the data processing and pathology staining.
This manuscript was processed by a guest editor.
Funding was provided by NIH grants R01‐EB‐012484 and R37‐HL‐096023.
This research was conducted with loaned equipment from Siemens Healthcare (ACUSON Antares; Issaquah, WA). Gregg Trahey is an inventor on Duke owned patents for ARFI imaging technology.
Other disclosures: None.
References
- 1. Balk EM, Garlitski AC, Alsheikh‐Ali AA, Terasawa T, Chung M, Ip S: Predictors of atrial fibrillation recurrence after radiofrequency catheter ablation: A systematic review. J Cardiovasc Electrophysiol 2010;21:1208‐1216. [DOI] [PubMed] [Google Scholar]
- 2. Bischof JC, He X: Thermal stability of proteins. Ann N Y Acad Sci 2005;1066:12‐33. [DOI] [PubMed] [Google Scholar]
- 3. Pearce JA: Models for thermal damage in tissues: Processes and applications. Crit Rev Biomed Eng 2010;38:1‐20. [DOI] [PubMed] [Google Scholar]
- 4. Lepock JR: Cellular effects of hyperthermia: Relevance to the minimum dose for thermal damage. Int J Hyperthermia 2003;19:252‐266. [DOI] [PubMed] [Google Scholar]
- 5. Chen SS, Humphrey JD: Heat‐induced changes in the mechanics of a collagenous tissue: Pseudoelastic behavior at 37 degrees C. J Biomech 1998;31:211‐216. [DOI] [PubMed] [Google Scholar]
- 6. Sarvazyan A, Hall TJ, Urban MW, Fatemi M, Aglyamov SR, Garra BS: An overview of elastography—an emerging branch of medical imaging. Curr Med Imaging Rev 2011;7:255‐282. [DOI] [PMC free article] [PubMed] [Google Scholar]
- 7. Eyerly SA, Bahnson TD, Koontz JI, Bradway DP, Dumont DM, Trahey GE, Wolf PD: Intracardiac acoustic radiation force impulse imaging: A novel imaging method for intraprocedural evaluation of radiofrequency ablation lesions. Heart Rhythm 2012;9:1855‐1862. [DOI] [PMC free article] [PubMed] [Google Scholar]
- 8. Bahnson TD, Eyerly SA, Hollender PJ, Doherty JR, Kim YJ, Trahey GE, Wolf PD: Feasibility of near real‐time lesion assessment during radiofrequency catheter ablation in humans using acoustic radiation force impulse imaging. J Cardiovasc Electrophysiol 2014;25:1275‐1283. [DOI] [PMC free article] [PubMed] [Google Scholar]
- 9. Pernot M, Mace E, Dubois R, Couade M, Fink M, Tanter M: Mapping myocardial elasticity changes after RF‐ablation using supersonic shear imaging. Comput Cardiol 2009:793‐796. [Google Scholar]
- 10. Kwiecinski W, Provost J, Dubois R, Sacher F, Haissaguerre M, Legros M, Nguyen‐Dinh A, Dufait R, Tanter M, Pernot M: Quantitative evaluation of atrial radio frequency ablation using intracardiac shear‐wave elastography. Med Phys 2014;41:112901. [DOI] [PubMed] [Google Scholar]
- 11. Hollender P, Rosenzweig S, Eyerly S, Wolf P, Trahey G: Three‐dimensional fusion of shear wave imaging and electro‐anatomical mapping for intracardiac radiofrequency ablation monitoring. IEEE Int Ultra Sym 2013:108‐111. [Google Scholar]
- 12. Grondin J, Wan E, Gambhir A, Garan H, Konofagou E: Intracardiac myocardial elastography in canines and humans in vivo. IEEE Trans Ultrason Ferroelectr Freq Control 2015;62:337‐349. [DOI] [PMC free article] [PubMed] [Google Scholar]
- 13. Wu T, Felmlee JP, Greenleaf JF, Riederer SJ, Ehman RL: Assessment of thermal tissue ablation with MR elastography. Magn Reson Med 2001;45:80‐87. [DOI] [PubMed] [Google Scholar]
- 14. Doherty JR, Trahey GE, Nightingale KR, Palmeri ML: Acoustic radiation force elasticity imaging in diagnostic ultrasound. IEEE Trans Ultrason Ferroelectr Freq Control 2013;60:685‐701. [DOI] [PMC free article] [PubMed] [Google Scholar]
- 15. Nightingale K, Palmeri M, Trahey G: Analysis of contrast in images generated with transient acoustic radiation force. Ultrasound Med Biol 2006;32:61‐72. [DOI] [PubMed] [Google Scholar]
- 16. Eyerly SA, Hsu SJ, Agashe SH, Trahey GE, Li Y, Wolf PD: An in vitro assessment of acoustic radiation force impulse imaging for visualizing cardiac radiofrequency ablation lesions. J Cardiovasc Electrophysiol 2010;21:557‐563. [DOI] [PMC free article] [PubMed] [Google Scholar]
- 17. Eyerly SA, Dumont DM, Trahey GE, Wolf PD: In vitro monitoring of the dynamic elasticity changes during radiofrequency ablation with acoustic radiation force impulse imaging. J Cardiovasc Electrophysiol 2013;24:472‐473. [DOI] [PMC free article] [PubMed] [Google Scholar]
- 18. Eyerly SA, Bahnson TD, Koontz JI, Bradway DP, Dumont DM, Trahey GE, Wolf PD: Contrast in intracardiac acoustic radiation force impulse images of radiofrequency ablation lesions. Ultrason Imaging 2014;36:133‐148. [DOI] [PMC free article] [PubMed] [Google Scholar]
- 19. Sarvazyan AP, Rudenko OV, Swanson SD, Fowlkes JB, Emelianov SY: Shear wave elasticity imaging: A new ultrasonic technology of medical diagnostics. Ultrasound Med Biol 1998;24:1419‐1435. [DOI] [PubMed] [Google Scholar]
- 20. Nightingale KR, Rouze NC, Wang MH, Zhai L, Palmeri ML: Comparison of qualitative and quantitative acoustic radiation force based elasticity imaging methods. 8th IEEE International Symposium on Biomedical Imaging: From Nano to Macro 2011, pp. 1606‐1609. [Google Scholar]
- 21. Rouze NC, Wang MH, Palmeri ML, Nightingale KR: Parameters affecting the resolution and accuracy of 2‐D quantitative shear wave images. IEEE Trans Ultrason Ferroelectr Freq Control 2012;59:1729‐1740. [DOI] [PMC free article] [PubMed] [Google Scholar]
- 22. Council NR: Guide for the Care and Use of Laboratory Animals: 8th Edition. Washington, DC: The National Academies Press; 2011. [Google Scholar]
- 23. Hsu SJ, Bouchard RR, Dumont DM, Wolf PD, Trahey GE: In vivo assessment of myocardial stiffness with acoustic radiation force impulse imaging. Ultrasound Med Biol 2007;33:1706‐1719. [DOI] [PMC free article] [PubMed] [Google Scholar]
- 24. Loupas T, Peterson RB, Gill RW: Experimental evaluation of velocity and power estimation for ultrasound blood‐flow imaging, by means of a 2‐dimensional autocorrelation approach. IEEE Trans Ultrason Ferroelectr Freq Control 1995;42:689‐699. [Google Scholar]
- 25. Loupas T, Powers JT, Gill RW: An axial velocity estimator for ultrasound blood‐flow imaging, based on a full evaluation of the Doppler equation by means of a 2‐dimensional autocorrelation approach. IEEE Trans Ultrason Ferroelectr Freq Control 1995;42:672‐688. [Google Scholar]
- 26. Giannantonio DM, Dumont DM, Trahey GE, Byram BC: Comparison of physiological motion filters for cardiac ARFI. Ultrason Imaging 2011;33:89‐108. [DOI] [PMC free article] [PubMed] [Google Scholar]
- 27. Rouze NC, Wang MH, Palmeri ML, Nightingale KR: Robust estimation of time‐of‐flight shear wave speed using a radon sum transformation. Ultrasonics, ferroelectrics and frequency Control, IEEE Transactions on 2010;57:2662‐2670. [DOI] [PMC free article] [PubMed] [Google Scholar]
- 28. Vejdani‐Jahromi M, Nagle M, Trahey GE, Wolf PD: Ultrasound shear wave elasticity imaging quantifies coronary perfusion pressure effect on cardiac compliance. IEEE Trans Med Imaging 2015;34:465‐473. [DOI] [PMC free article] [PubMed] [Google Scholar]
- 29. Bouchard RR, Hsu SJ, Wolf PD, Trahey GE: In vivo cardiac, acoustic‐radiation‐force‐driven, shear wave velocimetry. Ultrason Imaging 2009;31:201‐213. [DOI] [PMC free article] [PubMed] [Google Scholar]
- 30. Tukey JW: The philosophy of multiple comparisons. Statistical Science 1991;6:100‐116. [Google Scholar]
- 31. Nakagawa H, Yamanashi WS, Pitha JV, Arruda M, Wang X, Ohtomo K, Beckman KJ, McClelland JH, Lazzara R, Jackman WM: Comparison of in vivo tissue temperature profile and lesion geometry for radiofrequency ablation with a saline‐irrigated electrode versus temperature control in a canine thigh muscle preparation. Circulation 1995;91:2264‐2273. [DOI] [PubMed] [Google Scholar]
- 32. Cao H, Vorperian VR, Tsai JZ, Tungjitkusolmun S, Woo EJ, Webster JG: Temperature measurement within myocardium during in vitro RF catheter ablation. IEEE Trans Biomed Eng 2000;47:1518‐1524. [DOI] [PubMed] [Google Scholar]
- 33. Whittaker P, Zheng S, Patterson MJ, Kloner RA, Daly KE, Hartman RA: Histologic signatures of thermal injury: applications in transmyocardial laser revascularization and radiofrequency ablation. Lasers Surg Med 2000;27:305‐318. [DOI] [PubMed] [Google Scholar]
- 34. Lardo AC, McVeigh ER, Jumrussirikul P, Berger RD, Calkins H, Lima J, Halperin HR: Visualization and temporal/spatial characterization of cardiac radiofrequency ablation lesions using magnetic resonance imaging. Circulation 2000;102:698‐705. [DOI] [PubMed] [Google Scholar]
- 35. Schwartzman D, Ren JF, Devine WA, Callans DJ: Cardiac swelling associated with linear radiofrequency ablation in the atrium. J Interv Card Electrophysio 2001;5:159‐166. [DOI] [PubMed] [Google Scholar]
- 36. Ge YZ, Shao PZ, Goldberger J, Kadish A: Cellular electrophysiological changes induced in vitro by radiofrequency current: comparison with electrical ablation. Pacing Clin Electrophysiol 1995;18:323‐333. [DOI] [PubMed] [Google Scholar]
- 37. Wilber DJ, Packer D, Stevenson WG: Catheter Ablation of Cardiac Arrhythmias: Basic Concepts and Clinical Applications. Malden, MA: Blackwell Futura, 2008, p. xi, 375 p. [Google Scholar]
- 38. Dumont DM PB, Eyerly SA, Wolf PD: Feasibility of cryoablation lesion assessment using acoustic radiation force impulse imaging. Heart Rhythm Supplement 2012:S353. [DOI] [PMC free article] [PubMed] [Google Scholar]
- 39. Khairy P, Dubuc M: Transcatheter cryoablation part I: Preclinical experience. Pacing Clin Electrophysiol 2008;31:112‐120. [DOI] [PubMed] [Google Scholar]
- 40. Hsu SJ, Fahey BJ, Dumont DM, Wolf PD, Trahey GE: Challenges and implementation of radiation‐force imaging with an intracardiac ultrasound transducer. IEEE Trans Ultrason Ferroelectr Freq Control 2007;54:996‐1009. [DOI] [PMC free article] [PubMed] [Google Scholar]
Associated Data
This section collects any data citations, data availability statements, or supplementary materials included in this article.
Supplementary Materials
Video S1. 2‐D relative stiffness images of RFA site A throughout the full monitoring time course, including before ablation, during RFA delivery, and during the 30 minutes after ablation. The lesion presents as a uniformly stiff region with a discrete boundary, and the shape and stiffness remain stable throughout the time course.
Video S2. 2‐D relative stiffness images of RFA site C throughout the full monitoring time course, including before ablation, during RFA delivery, and during the 25 minutes after ablation. The lesion has a discrete border, and appears as a stiff region with stiffer core. This appearance is consistent with a thermocoagulated lesion with a collagen charred core
Video S3. B‐mode images from a full monitoring time course where there was a significant shift in the 2‐D imaging plane. The data for this ablation site were excluded from the analysis.
Figure S1. B‐mode (left), relative stiffness ARFI images (center), and approximate pathology cross‐sections (right) for lesion A‐F. TTC staining of pathology specimens confirms thermo‐coagulated lesions (white, charred brown core) surrounded by viable myocardium (dark red).