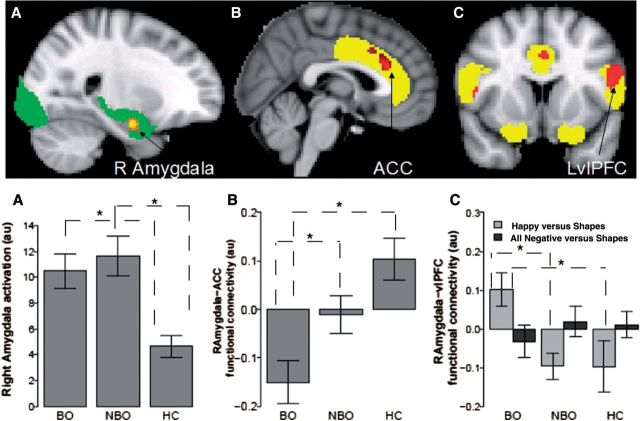
Figure 2.
The differences in brain activation and functional connectivity in BO, NBO and healthy controls. (A) Right amygdala activation, (B) right amygdala-ACC and (C) right amygdala-left ventrolateral PFC (LvlPFC) functional connectivity. The emotional face processing region of interest mask is shown in green. The emotion regulation regions (ACC, OFC, and vlPFC) mask is shown in yellow. au = arbitrary units; asterisk indicates significant post hoc Tukey’s HSD results. BO, n = 29; NBO, n = 29 and healthy control subjects (HC), n = 23.

