

Using a novel method to probe the spatiotemporal structure of intrinsic brain networks, Madhyastha et al. show that measures of network disruption correlate with CSF biomarkers of pathophysiological processes in Parkinson’s disease. Measures of network (dys)function also distinguish patients from controls more accurately than other functional neuroimaging measures.
Keywords: resting state, functional connectivity, Parkinson’s disease, default mode network, structural equation modeling
Using a novel method to probe the spatiotemporal structure of intrinsic brain networks, Madhyastha et al. show that measures of network disruption correlate with CSF biomarkers of pathophysiological processes in Parkinson’s disease. Measures of network (dys)function also distinguish patients from controls more accurately than other functional neuroimaging measures.
Abstract
Recent advances with functional connectivity magnetic resonance imaging have demonstrated that at rest the brain exhibits coherent activity within a number of spatially independent maps, normally called ‘intrinsic’ or ‘resting state’ networks. These networks support cognition and behaviour, and are altered in neurodegenerative disease. However, there is a longstanding perspective, and ample functional magnetic resonance imaging evidence, demonstrating that intrinsic networks may be fractionated and that cortical elements may participate in multiple intrinsic networks at different times, dynamically changing alliances to adapt to cognitive demands. A method to probe the fine-grained spatiotemporal structure of networks may be more sensitive to subtle network changes that accompany heterogeneous cognitive deficits caused by a neurodegenerative disease such as Parkinson’s disease. Here we tested the hypothesis that alterations to the latent (hidden) structure of intrinsic networks may reveal the impact of underlying pathophysiologic processes as assessed with cerebrospinal fluid biomarkers. Using a novel modelling approach that we call ‘network kernel analysis’, we compared fine-grained network ensembles (network kernels) that include overlapping cortical elements in 24 patients with Parkinson’s disease (ages 45–86, 17 male) and normal cognition or mild cognitive impairment (n = 13), and 21 cognitively normal control subjects (ages 41–76, nine male). An omnibus measure of network disruption, calculated from correlations among network kernels, was correlated with cerebrospinal fluid biomarkers of pathophysiological processes in Parkinson’s disease: concentrations of α-synuclein and amyloid-β42. Correlations among network kernels more accurately classified Parkinson’s disease from controls than other functional neuroimaging measures. Inspection of the spatial maps related to the default mode network and a frontoparietal task control network kernel showed that the right insula, an area implicated in network shifting and associated with cognitive impairment in Parkinson’s disease, was more highly correlated with both these networks in Parkinson’s disease than in controls. In Parkinson’s disease, increased correlation of the insula with the default mode network was related to lower attentional accuracy. We demonstrated that in an omnibus sense, correlations among network kernels describe biological impact of pathophysiological processes (through correlation with cerebrospinal fluid biomarkers) and clinical status (by classification of patient group). At a greater level of detail, we demonstrate aberrant involvement of the insula in the default mode network and the frontal frontoparietal task control network kernel. Network kernel analysis holds promise as a sensitive method for detecting biologically and clinical relevant changes to specific networks that support cognition and are impaired in Parkinson’s disease.
Introduction
Recent functional connectivity MRI work has demonstrated that at rest, the brain exhibits coherent activity within a number of spatially independent maps, normally called ‘intrinsic’ or ‘resting state’ networks (Fox and Raichle, 2007; Cole et al., 2014). These networks support cognition and behaviour, and are altered in neurodegenerative disease. Thus, decline in cognition may be interpreted in the context of disruption of the networks that support higher-order processes (e.g. memory and executive function), a property that has been pivotal in understanding the progression of neurodegenerative disease. An example is the default mode network (DMN), which has a role in memory encoding and retrieval. Hippocampal activation is normal when DMN deactivation is normal, and hippocampal ‘hyperactivation’ occurs when DMN deactivation is abnormal (Miller et al., 2008; Vannini et al., 2011), possibly at early stages of Alzheimer’s disease (Dickerson et al., 2005). This functional interaction of the hippocampus (which is among the first structures to degenerate in preclinical Alzheimer’s disease), and the DMN in memory encoding brings some clarity to the basis for the progression of memory-related symptoms in Alzheimer’s disease.
The situation in Parkinson’s disease is more complex than in Alzheimer’s disease. Cognitive impairment is present in about one-third of patients with Parkinson’s disease at the time of initial diagnosis and ultimately afflicts the vast majority. The disease mechanisms underlying cognitive impairment and dementia in Parkinson’s disease are an unclear mix of intrinsic processes related to regional accumulation of α-synuclein (encoded by SNCA) and loss of nigrostriatal and midbrain dopaminergic neurons, and processes of Alzheimer’s disease, characterized by regional accumulation of amyloid-β and pathologic tau species. Psychometric testing has demonstrated impairment in varying domains in patients with Parkinson’s disease, with some demonstrating an amnestic pattern (Cholerton et al., 2014; Mata et al., 2014) and others impairment in executive and/or visuospatial function. Multiple pathophysiologic processes converge to cause known deficits in lateral frontoparietal networks that support attention and task control, as evidenced by metabolic covariance analysis (Eckert et al., 2007; Huang et al., 2007). In addition to cerebral cortical dysfunction, impairment of multiple interacting ascending control systems, including the dopaminergic, noradrenergic, cholinergic and serotonergic systems, contribute to cognitive deficits and are difficult to disentangle (Mattila et al., 2001; Barone, 2010). Thus, the functioning of intrinsic networks is a promising target for understanding the heterogeneity of cognitive impairment in Parkinson’s disease.
Networks that have been conceptualized as being important for attention include the (i) frontoparietal task control network (FPTC), comprising anterior prefrontal, dorsolateral prefrontal, dorsomedial superior frontal/anterior cingulate, anterior inferior parietal lobule, and anterior insular cortices (Dosenbach et al., 2007); and (ii) dorsal attention network (DAN), comprising frontal eye fields and intraparietal sulci (Corbetta and Shulman, 2002), and the salience network (Seeley et al., 2007). These ‘task positive’ networks are typically thought of as being anticorrelated with the DMN, but Spreng et al. (2010) demonstrated that the FPTC flexibly coupled with the DMN or DAN to support either internally- or externally-focused goal-directed cognition. There is a high degree of inter-network connectivity between the FPTC and the DMN and DAN, suggesting its role in mediating engagement of these networks (Spreng et al., 2013). Dopamine plays an important role in this mediation by enhancing coupling between the FPTC and the DMN while reducing the coupling between the FPTC and the DAN (Dang et al., 2012).
Disruption in engagement of the FPTC and DAN correlates with visual misperceptions and hallucinations in Parkinson’s disease (Shine et al., 2013). A failure to recruit the DAN may lead to an over-reliance on the DMN for interpretation of the ambiguous stimuli (Shine et al., 2014). The anterior insula, which is hypothesized to play an important role in ‘network switching’ (Menon and Uddin, 2010), was more highly activated when viewing bistable precepts, and subjects with deficits had less bilateral grey matter in the insula. The insula is affected in Parkinson’s disease both by α-synuclein accumulation and disruptions to neurotransmitter function and is an important target for understanding non-motor symptoms in Parkinson’s disease (Christopher et al., 2014a). Recent findings that insular D2 receptor loss underlies executive dysfunction in Parkinson’s disease with mild cognitive impairment (Christopher et al., 2014b) suggest that changes to large-scale network interactions together with changes to anterior insular functional connectivity should be a hallmark of Parkinson’s disease.
Although Lewy body pathology has been related to dementia in Parkinson’s disease, (Braak et al., 2006) comorbid Alzheimer’s disease pathology is common in Parkinson’s disease dementia and may contribute to cognitive symptoms in Parkinson’s disease (Irwin et al., 2012, 2013). It is widely thought that pathophysiological processes of Parkinson’s disease and Alzheimer’s disease may advance at different rates in different individuals to yield unique patterns of cognitive impairment. One approach to assess the extent of Parkinson’s disease versus Alzheimer’s disease in a given person is to quantify CSF biomarkers. Indeed, Alzheimer’s disease is characterized by reduction in CSF amyloid-β42 concentration and increase in total tau and tau-P181 concentrations. The latter two are non-specific changes that accompany neuronal injury from a variety of disease mechanisms. Parkinson’s disease is characterized by a reduction in CSF concentration of α-syn. Increased cerebral amyloid by PET is correlated closely with reduced CSF amyloid-β42 concentration in Alzheimer’s disease (Fagan et al., 2006; Grimmer et al., 2009). Newer PET imaging agents for pathological tau are now coming into widespread use, while imaging probes for α-synuclein are still under development. Thus CSF biomarkers currently offer the most comprehensive approach to anchor an analysis of systems alterations to pathophysiological processes of Alzheimer’s or Parkinson’s diseases (Montine et al., 2010; Stewart et al., 2014; Buddhala et al., 2015).
In this study we apply a new methodological approach that we developed to solve an important problem with comparison of the spatiotemporal dynamics of intrinsic networks between groups. By spatiotemporal, we mean that cortical regions may interact with multiple intrinsic networks at different times to respond to cognitive demands (Spreng et al., 2010, 2013). Before we can meaningfully measure and compare correlations between networks (i.e. the degree to which the networks are simultaneously coupled in one group relative to another), we must first make sure that we are measuring the same ‘networks’ in each group. The problem is illustrated in Fig. 1, a cartoon of a red and blue network evolving over time. Figure 1A shows anticorrelated red and blue networks. Figure 1B shows activity in the red and blue networks becoming more correlated as the two networks become less differentiated. Finally, Fig. 1C shows breakdown of within-network structure, illustrated by colouring the nodes of the blue network and red network using light and dark shades. Only one node within the red and the blue network is ever fully active at a single time point. If controls are like Fig. 1A and subjects with Parkinson’s disease are like Fig. 1B, we can describe changes to network correlations that occur with Parkinson’s disease. However, if subjects with Parkinson’s disease look like Fig. 1C, we must note that their network structure has changed and that correlations between networks cannot be fairly compared. Indeed, if asked to identify networks from subjects like Fig. 1C, we might decide that there were two networks: ‘Blue + Red’ and ‘Light Blue + Orange’ that were anticorrelated in the same way as Fig. 1A. There are other possible differences in dynamics, but only these three cases are relevant to this study.
Figure 1.

Cartoon illustration of brain networks evolving in time. Grey circles represent snapshots of a brain at each time point. Red and blue circles represent nodes that are active in that time point within a red and blue network. Beneath each network cartoon is the timeline of the corresponding functional MRI (fMRI) signals within each network. To the right of each cartoon is the corresponding correlation matrix, assuming that the signal at each node (operationalized as a region of interest) is sampled precisely at each repetition time (TR). See text for description.
In this cartoon we have colour-coded the networks; in reality, we determine the network structure from the data. This structure is present in noisy data: it is a hidden, or ‘latent’ structure, which must be obtained indirectly from the signal at the network nodes. In Fig. 1, regions of interest each belong only to one network. However, regions of interest may participate in multiple networks. Within these, there are common subsets of regions with temporally coherent network activity that may reflect some primitive of cognitive network functioning. For example, temporal functional mode analysis demonstrated three visual subnetworks that were only partially spatially overlapping and positively correlated (Smith et al., 2012). We propose calling these subnetworks ‘network kernels’ to distinguish them from large scale intrinsic networks. We can equate network kernels across groups and examine their correlations to quantify network dynamics.
Here, we use a novel analytic approach to identify network kernels in resting state functional MRI data from participants with and without Parkinson’s disease, to determine to what extent the correlations of network kernels are changed in Parkinson’s disease, and how they relate to CSF biomarkers of Parkinson’s disease or Alzheimer’s disease and to cognitive performance.
Materials and methods
Participants
This analysis includes 24 subjects with Parkinson’s disease, diagnosed according to UK Brain Bank criteria (mean age = 66, range: 45–86 years) and 21 subjects without Parkinson’s disease (mean age = 62, range: 41–76) from a study described previously (Madhyastha et al., 2014). See Table 1 for sample characteristics. Patients with Parkinson’s disease did not differ significantly from controls on age, education, or Montreal Cognitive Assessment score (Nasreddine et al., 2005). Thirteen participants with Parkinson’s disease were classified via consensus conference as having mild cognitive impairment (Cholerton et al., 2013), but this is based on estimated decline from premorbid abilities, and there is little variance in measured cognitive function. Parkinson’s disease participants had significantly higher scores on the Unified Parkinson’s Disease Rating Scale (UPDRS) motor subscale, indicating greater motor impairment (Goetz et al., 2007) [t(43) = −11.72, P < 0.001].
Table 1.
Demographics of sample
| Parkinson’s disease | Control | Total | |
|---|---|---|---|
| Demographics | |||
| n | 24 | 21 | 45 |
| Age at scan | 66.08 (10.27) | 61.90 (10.00) | 64.13 (10.25) |
| Sex (number of males) | 17 (71%) | 9 (43%) | 26 (58%) |
| Education (years) | 16.17 (2.12) | 15.90 (2.39) | 16.05 (2.23) |
| Hoen and Yahr | 2.04 (1–2.5) | ||
| Handedness (right) | 20 | 19 | 39 |
| Parkinson’s disease symptoms | |||
| Hoen and Yahr | 2.04 (1–2.5) | ||
| Dominant side of motor symptoms | 6 left/18 right | ||
| UPDRS Part I | 9.78 (5.81) | 9.78 (5.81) | |
| UPDRS Part II | 8.38 (5.08) | 8.38 (5.08) | |
| UPDRS Part III | 23.12 (8.61) | 0.81 (1.40) | 12.71 (12.90) |
| UPDRS Part IV | 1.88 (3.72) | 1.88 (3.72) | |
| Levodopa (current) | 16 | 0 | 16 |
| Dopamine agonist (current) | 11 | 0 | 11 |
| Time since symptom onset (years) | 8.27 (4.80) | ||
| Cognitive | |||
| MoCA | 26.38 (2.16) | 27.29 (1.95) | 26.80 (2.10) |
| Hopkins Verbal Learning Test | 24.88 (5.71) | ||
| Golden Stroop (total correct) | 189.92 (26.23) | ||
| Trails B (s) | 75.22 (32.79) | ||
| ANT Attention (s) | 97.01 (3.05) | 98.36 (1.85) | |
ANT = Attention Network Test; UPDRS = Unified Parkinson’s Disease Rating Scale; MoCA = Montreal Cognitive Assessment.
Males were over-represented in the Parkinson’s disease group, consistent with higher incidence rates of Parkinson’s disease in men (Wooten et al., 2004). Patients with Parkinson’s disease ranged from Hoehn and Yahr (1967) stage 1 to 2.5 with most at stage 2 (n = 19; bilateral involvement without impairment of balance) and had been experiencing symptoms for an average of 8.27 years. At diagnosis, all subjects reported asymmetric motor involvement with 18 more affected on the right side. At the time of the scan and corresponding neuropsychological evaluations, most patients with Parkinson’s disease were taking dopaminergic medications (29% were taking both levodopa and a dopamine agonist, 37% were taking only levodopa, 17% were taking only a dopamine agonist, and 17% were taking no dopaminergic medications). This study was approved by the University of Washington Institutional Review Board. All participants provided written informed consent.
Procedures
Participants completed two baseline scanning sessions, without intervention, 1 to 3 weeks apart. Scans were performed after morning doses of dopaminergic Parkinson’s disease medication (if applicable). During each session, participants were scanned while viewing a fixation cross at rest. Subjects were given the Attention Network Test (Fan et al., 2005). This test is designed to measure the alerting, orienting, and executive control networks by examining change in reaction time to identify the orientation of an arrow surrounded by congruent or incongruent arrows (a Flanker task) when preceded by different categories of cues. For this paper, we used overall accuracy for the Flanker task (averaged across both baseline sessions, across all conditions; Table 1) as a behavioural measure of attention in controls and in Parkinson’s disease. Overall accuracy was high, and marginally higher in controls than in Parkinson’s disease (Mann-Whitney U = 332, P = 0.069); for details see (Madhyastha et al., 2015).
Although lumbar punctures were not required as part of this study, concentration of CSF biomarkers [including α-synuclein, amyloid-β42, total tau, and tau phosphorylated at serine 181 (tau-P181)] was quantified with Luminex assay (Shi et al., 2011) for 14 of the Parkinson’s disease participants as part of the Pacific Northwest Udall Centre clinical core (obtained a mean of 1.04 years prior to imaging).
Magnetic resonance imaging
Acquisition
Data were acquired using a Philips 3 T Achieva MR System (Philips Medical Systems, software version 3.2.2) with a 32-channel SENSE head coil. During each session, whole-brain axial echo-planar images (43 sequential ascending slices, 3 mm isotropic voxels, field of view = 240 × 240 × 129, repetition time = 2400 ms, echo time = 25 ms, flip angle = 79°, SENSE acceleration factor = 2) were collected parallel to the AC-PC line for all functional runs. Each resting state scan was 300 volumes (12 min). A sagittal T1-weighted 3D MPRAGE (176 slices, matrix size = 256 × 256, inversion time = 1100 ms, turbo-field echo factor = 225, repetition time = 7.46 ms, echo time = 3.49 ms, flip angle = 7°, shot interval = 2530 ms) with 1 mm isotropic voxels was also acquired for registration.
Processing
Functional images from both baseline sessions were processed using a pipeline developed using software from FSL (Jenkinson et al., 2012), FreeSurfer (Fischl and Dale, 2000), and AFNI (Cox, 1996). Processing steps for each analysis [network kernel analysis and independent components analysis (ICA)] were kept as similar as possible to improve the quality of the analysis following FSL recommendations.
Data were corrected for motion using FSL MCFLIRT (Jenkinson et al., 2002). The pipeline removed spikes using AFNI, performed slice timing correction using FSL, and regressed out time series motion parameters and the mean signal for eroded (1 mm in 3D) masks of the lateral ventricles and white matter (derived from running FreeSurfer on the T1-weighted image). We did not regress out the global signal. We did not perform bandpass filtering to avoid artificially inflating correlations or inducing structure that was not actually present in the data, and because resting state networks exhibit different levels of phase synchrony at different frequencies (Niazy et al., 2011; Handwerker et al., 2012). Factor analysis explicitly models error that might be introduced into correlations by higher frequencies. Three dimensional spatial smoothing was performed using a Gaussian kernel with a full-width at half-maximum of sigma = 3 mm. Co-registration to the T1 image was performed using boundary based registration based on a white matter segmentation of the T1 image (epi_reg in FSL).
We performed a conventional group ICA and subsequent dual regression of the resting state data. Data were preprocessed as described above except that motion, CSF, and white matter regressors were not removed from the data (because motion and physiological signals are accurately separated from signal using ICA) (Salimi-Khorshidi et al., 2014). A Temporally Concatenated Probabilistic Group ICA (TC-GICA) was implemented using Multivariate Exploratory Linear Decomposition into Independent Components (MELODIC) Version 3.12 (Beckmann and Smith, 2004) to generate large-scale components across all resting state scans for all participants. A dual-regression approach implemented in FSL (Filippini et al., 2009) was used to identify session-specific time courses for each subject corresponding to the spatial maps identified in the ICA, then to identify session-specific spatial maps for each subject corresponding to these time courses. Correlations between components were calculated using the subject-specific time course for each component obtained from the first stage of dual regression. Group comparisons of correlations were performed after Fisher’s z-transformation to convert them to a normally distributed variable. A group-level analysis comparing patients with Parkinson’s disease to control subjects was performed by non-parametric testing (5000 permutations) on the averaged single-subject spatial maps from both sessions for the group-level components of interest. Maps were thresholded at a Bonferroni corrected probability of 0.05 with threshold-free cluster-enhancement.
Overview of network kernel analysis
Network kernels were obtained from a factor analysis of the blood oxygen level-dependent signal in a set of relevant regions of interest. We selected MNI coordinates that have been identified as nodes in the default mode network, dorsal attention network, and frontoparietal task control network, republished by Power et al. (2011) and derived from Raichle (2001) and Dosenbach et al. (2007). Additionally, we obtained coordinates for a ‘salience’ network from Sridharan and colleagues (Sridharan et al., 2008; Menon and Uddin, 2010), and for primary visual cortex and sensory cortex from the Harvard Oxford Cortical Atlas. See Supplementary Table 1 for coordinates. We also obtained masks for the caudate, putamen, and nucleus accumbens on an individual level using the Freesurfer subcortical parcellation. For each coordinate, we created a 10 mm diameter mask in standard space and transformed that to subjects’ native space to calculate mean subject-specific time courses for each region of interest. The basal ganglia masks were simply transformed to subjects’ native space to obtain mean subject-specific time courses.
Network kernel identification
Normalized subject-specific time courses for all regions of interest were concatenated across all subjects and input to an exploratory factor analysis in a structural equation modelling (SEM) framework (ESEM) (Asparouhov and Muthén, 2009) implemented in Mplus (see Supplementary material for a more detailed overview of these methods). This allowed us to construct a factor model that described the structure of temporal fluctuations in the selected regions of interest. In this context, a factor is a mathematical description of a structured set of correlated regions of interest that operate within larger networks. To convey the correspondence of factors to neural systems, we call these factors network kernels. The ESEM method is exploratory, but provides access to typical SEM parameters, including standard errors, goodness of fit statistics, comparisons of competing models, and multiple group analysis. We used ESEM multiple group analysis to establish that the model was identical for Parkinson’s disease and controls. This ensures that network kernels are identical in each group. The number of kernels is determined by a reproducible procedure that involves inspecting model fit parameters. We use Geomin rotation, a type of oblique rotation that allows us to model correlated network kernels where nodes ‘belong’ to multiple networks at different times (Browne, 2001).
We followed established procedures for testing for measurement invariance, which ensure that the network kernels are the same in both groups. After these criteria were met, we established that the mean network kernel correlations differed across in the two groups.
Network kernel analysis
Network kernels describe ‘weights’ of regions of interest whose activity covaries. The normalized functional MRI signal at each region of interest is the sum of these weights multiplied by a score for each network kernel (for each repetition time and for each subject), plus an error term. These scores represent the mean expression of each network in the subject during that repetition time (e.g. how relatively high or low the signal in that network was during that repetition time). We can use these scores as regressors in a univariate General Linear Model (GLM) analysis of the resting state data to identify cortical regions that are more or less correlated with each network (controlling for all other networks). The GLM was implemented using FSL’s FMRI expert analysis tool (FEAT) version 6.0. Time series statistical analysis was carried out using FILM with local autocorrelation correction (Woolrich et al., 2001). Mean images (mean expression of each network) were generated for each run for each participant and registered to standard MNI space. Registered mean images were then carried forward into higher-level models to generate a single mean image for each participant across all runs. These images were fed into a group comparison model using FMRIB’s Local Analysis of Mixed Effects (FLAME) stage 1 (Beckmann et al., 2003; Woolrich et al., 2004). Z-statistic images were masked using a grey matter mask (probability of grey matter > 30%) and thresholded using clusters determined by Z > 2.3 and a corrected cluster significance threshold of P = 0.05 (Worsley, 2001).
Statistical analysis
Statistical analysis of network kernel scores was performed using R version 3.1.1. We first tested for group differences in the mean scores obtained at each session (the level of network expression) using a multilevel model that allowed for correlated random error within subjects at each session. We then computed the partial correlations between network kernel scores (i.e. the correlation between two network kernels controlling for all others) for each individual. Using partial correlations allowed us to better examine the relationship between pairs of network kernels. All statistical analyses of partial correlations were performed after Fisher’s Z transformation to convert them to a normally distributed variable. Statistical tests were corrected for multiple comparisons using Bonferroni correction with a corrected P-value of 0.05 within the category of measures being examined. We examined the relationship of a measure of network disruption derived from partial correlations to CSF concentration of amyloid-β42 or α-synuclein as a primary analysis and examine the relationship to CSF concentration of tau or tau-P181 as an exploratory analysis.
Results
Identification of network kernels by exploratory factor analysis
Figure 2 shows the 10 network kernels (factors) that we identified using exploratory factor analysis and the corresponding spatial maps obtained for control subjects through network kernel analysis. In the top panel, the size of the spheres corresponds to the magnitude of the loadings for each factor (Supplementary Table 2). In the bottom panel, the spatial map is obtained by using the subject-specific network kernel time courses as regressors in a GLM. The model has very good fit by all standard measures (see Supplementary material and Supplementary Table 3). Crucially, this model fits the data better than a model that constrained correlations between network kernels to be the same in Parkinson’s disease and in controls. This allows us to examine group differences in the temporal overlap of network kernels (e.g. the difference between Fig. 1A and B), knowing that the structure of the network kernels is identical in both groups. The excellent spatial correspondence between the magnitude of the contributions of the regions of interest to the network kernel and the spatial map obtained from GLM analysis indicates that the network kernel time courses reflect meaningful intrinsic network activity, and are not driven by noise, physiological signal, or other regions that are not included in our factor analysis.
Figure 2.

Network kernels identified in 24 subjects with Parkinson’s disease and 21 controls. All images follow radiological convention (left is on the right). HC = hippocampus; ROI = region of interest.
There were no differences in the level of network expression between Parkinson’s disease and controls, except for the frontal FPTC component, which had higher expression in Parkinson’s disease but was not significant after Bonferroni correction for 10 comparisons (P = 0.031, Pcorr = 0.309).
Conventional analysis methods are not as sensitive to Parkinson’s disease-related network disruption
A conventional ICA analysis of the data yielded 23 components identified by visual inspection (M.K.A.) as neural signals of interest (Kelly et al., 2010). Example components are shown in Fig. 3 (see also Supplementary Table 4). We calculated the pairwise partial correlations among subject-specific time courses for each component (obtained from the first stage of dual regression) for each subject (Supplementary Fig. 2) and tested for group differences on the Z-transformed correlations. Differences included both increases and decreases in component correlations, but no correlations were significant after Bonferroni correction for 253 comparisons (Supplementary Table 5). A dual regression yielded no significant differences in the connectivity within any of these networks after correction for multiple comparisons.
Figure 3.

Selected components defined by melodic ICA.
To objectively compare information available in measures derived from ICA and network kernel analysis, we used a linear support vector machine with 10-fold cross-validation to classify each of our subjects as Parkinson’s disease or control, using resting state data alone. In this method, the original sample is randomly partitioned into 10 equal size subsamples. Nine subsamples are used as data for training the model, and the remaining subsample is used as validation. This process is repeated 10 times, withholding a different subsample each time, to produce an average estimation using all observations for both training and validation data. Using stationary correlations between the regions of interest used in this study, sensitivity was 0.82 [standard deviation (SD) = 0.29] and specificity was 0.11 (SD = 0.22). Using partial correlations between all the cognition-related ICA components, we obtained sensitivity of 0.65 (SD = 0.30) and specificity of 0.29 (SD = 0.19). Using partial correlations between network kernels, sensitivity was 0.99 (SD = 0.03) and specificity was 0.99 (SD = 0.05). This is evidence that there is information obtained through functional overlap of networks and their dynamics that is not captured by regional connectivity alone, and that partial correlations of dynamic kernels are more sensitive to Parkinson’s disease-related changes than stationary correlations or partial correlations among ICA-derived components.
Differences in correlations within and between intrinsic networks are related to concentrations of CSF biomarkers
We computed the partial correlations between all pairs of network kernels. Figure 4 shows the patterns of positive and negative correlations between all network kernels in controls (Fig. 4A), and differences among the DMN, FPTC and DAN between Parkinson’s disease and controls (Fig. 4B and C; see Supplementary Fig. 1 for Parkinson’s disease). The blue or red outlined ellipses in in Fig. 4B and C indicate partial correlations that are significantly higher (blue) or lower (red), correcting for 45 comparisons, in Parkinson’s disease than controls. Overall, there were both increases and decreases in correlations among network kernels in the DMN, FPTC, and DAN in Parkinson’s disease compared to controls. There were no significant group differences after correction for multiple comparisons in Parkinson’s disease versus controls in correlations of network kernels involving the basal ganglia or primary visual cortex.
Figure 4.

Correlations of network kernels. (A) Controls only (see Supplementary Fig. 1 for correlations of network kernels in Parkinson’s disease); (B) differences between Parkinson’s disease (PD) and controls highlighting only within-network correlations. Correlations marked with heavy blue or red lines are significantly higher or lower, respectively, in Parkinson’s disease. Correlations within the DMN and FPTC are lower in Parkinson’s disease. (C) Correlations among kernels of the DMN, FPTC, and DAN intrinsic networks, highlighting only between-network correlations. Between-network correlations show both increases and decreases for individual network kernels in Parkinson’s disease.
Looking first at the correlations within each intrinsic network (Fig. 4B), we can see that correlations are decreased in Parkinson’s disease within the DMN and FPTC. However, if we look between these networks (Fig. 4C), we can see that correlations are both increased and decreased between kernels in the DMN and FPTC, the FPTC and DAN, and the DMN and DAN. Considering first the DMN and FPTC, we see decreased correlations between the primary DMN kernel and the anterior and posterior FPTC kernels. However, the left-lateralized FPTC component has higher correlations with the first DMN kernel and lower correlations with the hippocampal DMN kernel. The hippocampal DMN kernel has lower correlations with the posterior DAN and higher correlations with the sensorimotor/DAN kernel. Finally, the frontal FPTC kernel has higher correlations with the posterior DAN and lower correlations with the sensorimotor/DAN kernel. These patterns were reproduced at both sessions (Supplementary material).
In the current sample, four subjects were not taking dopamine agonists or levodopa. We tested for group differences between these subjects and controls. We found the same directional pattern of differences that were significant in the entire Parkinson’s disease group (although only the partial correlations involving the primary DMN kernel and the correlation between the sensorimotor/DAN and FPTC-frontal network kernels were significant in the subgroup comparison after controlling for multiple comparisons).
To determine whether these differences to the structure of within and between intrinsic network connectivity are related to pathophysiological processes, as indexed by CSF biomarkers, we computed the Euclidean distance between the mean partial correlation matrix of controls and the partial correlation matrix for each Parkinson’s disease subject. This created, for each individual, a metric of ‘network disruption’ that described the deviation of the subject’s network configuration from that of controls. Network disruption was highly correlated with lower CSF levels of amyloid-β42 and α-synuclein (Fig. 5) among the 14 participants with CSF. Controlling for time between scan and CSF acquisition, the correlation between CSF amyloid-β42 concentration and network disruption was r(11) = −0.75, P < 0.001 (Pcorr = 0.005), and the correlation between CSF α-synuclein concentration and network disruption was r(11) = −0.55, P = 0.025 (Pcorr = 0.05). We also calculated the same metric of overall network disruption using the mean partial correlations among the 23 cognitive components identified in the ICA. Controlling for time between scan and CSF acquisition, the correlation between CSF amyloid-β42 concentration and network disruption was significant r(11) = −0.63, P = 0.007 (Pcorr = 0.035), but the correlation between CSF α-synuclein concentration and network disruption was not (P = 0.77), suggesting that the ICA-derived network disruption measure is less sensitive to pathophysiologic processes indicated by changes in CSF α-synuclein concentration. Neither metric of overall network disruption correlated with CSF concentrations of tau or tau-P181.
Figure 5.
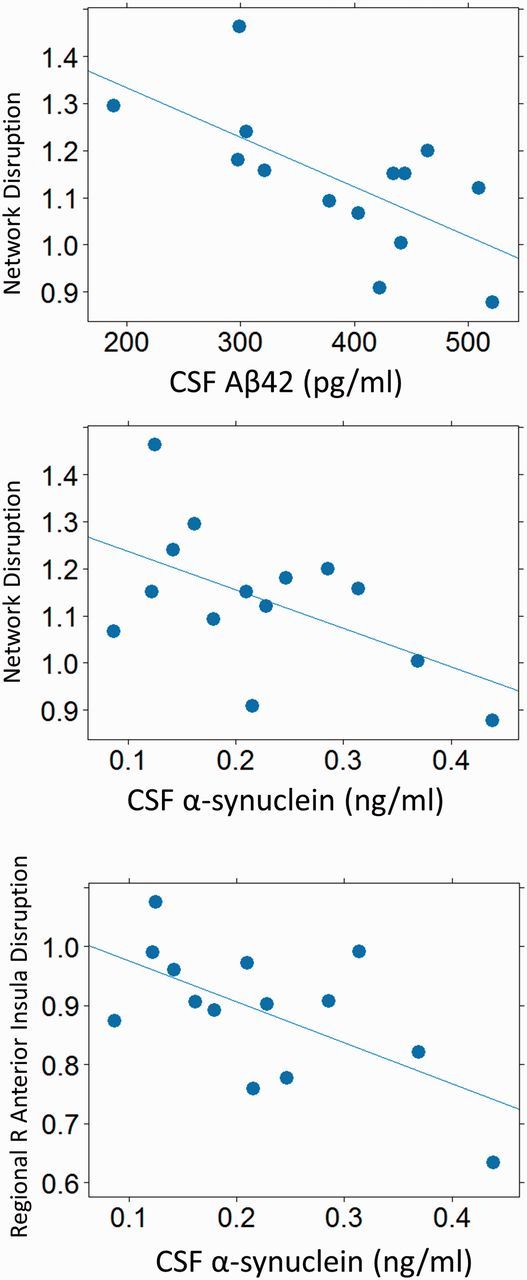
Correlation of CSF biomarkers to network disruption. Greater network disruption is correlated with greater neuropathological change (indicated by lower CSF amyloid-β42 or lower α-synuclein concentration).
Because we expected that alterations in the relationship of the right anterior insula would specifically contribute to network disruption, we computed a more specific regional measure of disruption as above, including only partial correlations among network kernels in which the right anterior insula participated (i.e. where the significance of the corresponding factor loading was < 0.05 uncorrected). This included all factors except for the DAN-SM and DAN-IPS (Supplementary Table 2), or 28 correlations. Controlling for time between scan and CSF acquisition, the correlation between CSF α-synuclein concentration and regional right insular network disruption was r(11) = −0.61, P = 0.009 (Pcorr = 0.045). The relationship with CSF amyloid-β42 concentration was not significant (P = 0.13). Insula disruption was related to lower CSF concentration of tau-P181 [r(11) = −0.57, P = 0.019] and marginally with lower CSF tau concentration [r(11) = −0.50, P = 0.054].
In summary, we found widespread differences in the correlations of network kernels between controls and Parkinson’s disease, and the degree of network disruption was related to CSF biomarkers.
The insula as a potential factor in network disruption and cognitive impairment in Parkinson’s disease
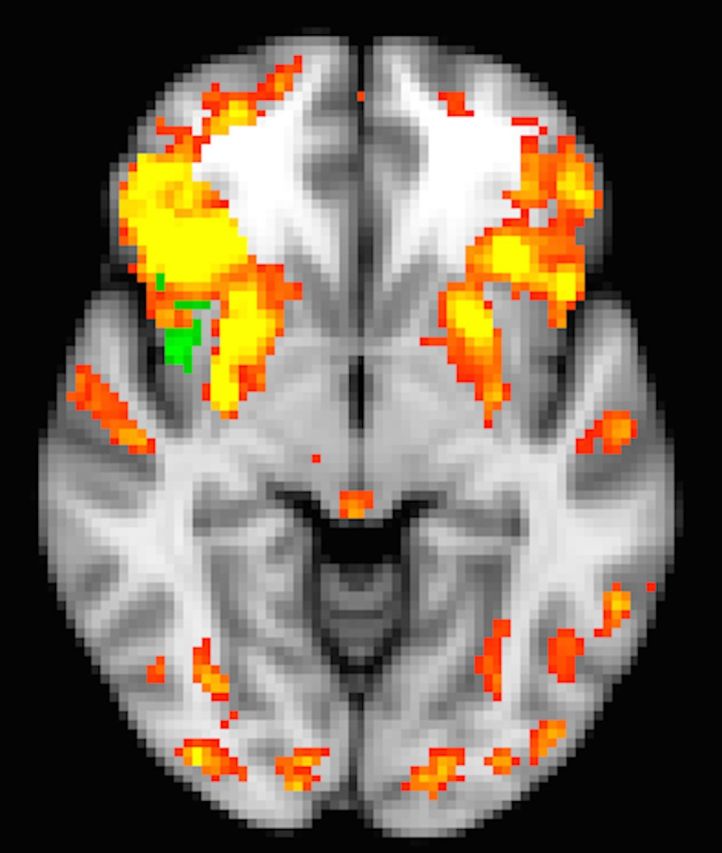
Figure 6 shows group differences in the DMN and FPTC frontal network kernels, controlling for all network kernels. We focused on these two network kernels because they are the only ones that show group differences in the anterior insula, an area of specific interest with respect to network disruption. The anterior/ventral insula has greater correlation in Parkinson’s disease than in controls to both the DMN and FPTC frontal network kernels (green axial slices in Fig. 6A and B). These clusters partially overlap, with the DMN clusters being located more dorsal-anteriorly, and the FPTC more ventrally (Fig. 6C).
Figure 6.

Group differences in DMN and FPTC frontal network kernels. Spatial maps for the network kernel in controls are shown in red/yellow. (A) DMN; (B) FPTC frontal. Green regions are more highly correlated with the network kernel in Parkinson’s disease (anterior insula in DMN and FPTC frontal, supramarginal gyrus in DMN), and blue regions are less highly correlated with the network kernel in Parkinson’s disease (hippocampus, fusiform cortex in DMN). (C) Right anterior insula cluster in both DMN (green) and FPTC frontal (red). All images follow radiological convention (left is on the right).
There are additional group differences in the DMN. A cluster located in the supramarginal gyrus is more correlated to the default mode network in Parkinson’s disease, and the left hippocampus and fusiform cortex is less correlated to the default mode network in Parkinson’s disease.
We investigated whether the increased correlation of the insula to these network kernels was related to attention. We calculated the Spearman rank partial correlation of the mean Z-score in the right insula cluster from each network kernel and overall accuracy on the Attention Network Test, controlling for age, in Parkinson’s disease and controls. Higher accuracy is associated with a lower Z-score in the DMN insular cluster in Parkinson’s disease (P = 0.039) but not in controls (P = 0.39) (data shown in Supplementary Fig. 3). The relationship between the FPTC-frontal insular cluster and accuracy follows the same direction but is not significant (Parkinson’s disease: P = 0.18, control: P = 0.28).
Discussion
We propose a hypothesis-driven approach to identifying the latent structure of intrinsic networks, and the alterations to the dynamics of these networks, that might explain the impact of different disease mechanisms on cognition in patients with Parkinson’s disease. We demonstrated that collectively, correlations among network kernels describe the impact of specific pathophysiological processes (through correlation with CSF biomarkers) and clinical status (by classification of patient group).
Intrinsic networks, as defined by ICA analysis, are clearly an organizing framework for network kernels, but there are some differences. Figures 2 and 3 are examples of network kernels and a subset of identified ICA components obtained from the same data. The default mode, visual and putamen networks have direct analogues as network kernels. However, other network kernels incorporate areas that span intrinsic networks, reflecting the spatiotemporal flexibility of their constituent nodes. Although within-network connectivity (in the DMN and FPTC) decreased in Parkinson’s disease, we did not observe a simple pattern of increases or decreases in correlations between network kernels. This is consistent with a more nuanced picture of spatiotemporal network behaviour that reflects the observed inter-network connectivity (Spreng et al., 2010, 2013). Network disruption may be caused by multiple pathophysiological processes that affect ascending transmitter systems, localized disease mechanisms in regions controlling switching, or compensatory circuit activation. We show aberrant involvement of the right anterior insula, a region implicated in network switching that is affected by loss of dopamine receptors and synucleinopathy in Parkinson’s disease, in both the DMN and the frontal FPTC.
Network kernel analysis gives us a way to probe sensitively alterations to within- and between- network structure. We anchored our analysis of intrinsic connectivity changes to well-established CSF biomarkers of Parkinson’s disease or Alzheimer’s disease. Greater network disruption obtained from network kernel analysis was associated with greater extent of one facet of Alzheimer’s disease and with the ‘synucleinopathy’ of Parkinson’s disease, as indicated by reduced CSF concentrations of amyloid-β42 and α-syn. By comparison, overall network disruption obtained from an ICA approach was associated with only amyoid-β42. This agreement between methods (for CSF amyloid-β42) is remarkable because both approaches yielded unbiased ‘ominibus’ measures of network disruption, and included different cognitive networks. Lack of agreement between methods for CSF α-synuclein may suggest that the ICA-derived networks, including all identified cortical networks, are less specific to α-synuclein pathology. Indeed, increased disruption to only the correlations among network kernels involving the right anterior insula was specifically related to lower CSF α-syn, suggesting that network disruption may reflect the pathophysiological processes that underlie the accumulation of this neurotoxic protein in this region of brain or other regions of brain important to appropriate function of the right anterior insula.
We found that omnibus measures of network disruption were not related to CSF tau or tau-P181, but that higher disruption surrounding the right anterior insula was related to lower CSF tau. It is unclear whether CSF total tau decreases (Zhang et al., 2008; Kang et al., 2013) or remains unchanged in Parkinson’s disease (Buddhala et al., 2015), and therefore difficult to predict how CSF levels of tau might relate to network disruption. Therefore our investigations of tau and tau-P181 and network disruption are exploratory.
We validated the network kernel abstraction, and specifically the correlations among network kernels, as a more sensitive way of quantifying network alterations that discriminate Parkinson’s disease from controls than correlations between regions of interest or between ICA-derived components. Sensitivity of network kernel analysis stems from two methodological points: first, we used factor analysis to identify a latent structure of network kernels that is identical in two groups, with respect to specific regions of interest. A data-driven approach such as an ICA does not make such a comparison, and group differences in structure are confounded with group differences in expression. Second, the latent structure allows regions of interest to belong to multiple network kernels. This might more realistically represent the dynamically changing configuration of networks. However, the selection of regions of interest to include in the network kernel analysis is hypothesis-driven and will affect what kernels are identified.
Motion can be a potential confound in a functional MRI study. Reproducibility of the network kernel correlation changes across two sessions, the near-perfect classification ability of network kernel correlations to discriminate Parkinson’s disease from controls, and the quality of the spatial maps that we obtain from network kernel scores are strong evidence that our group-level results are not driven by motion. That said, it has been well established that even low levels of motion perturb calculation of the within-subject correlations we are interested in modelling (Power et al., 2014). We must determine the optimal combination of preprocessing techniques to enhance accuracy of measurement using the network kernel approach before we can longitudinally track changes in network correlations at the individual level.
There are limitations to our study. First, it is possible that some Parkinson’s disease-related network changes are compensatory, occurring early in the disease process, and others are pathological. An analogous example from Alzheimer’s disease is hippocampal hyperactivation that occurs early in the disease process. To characterize the specific patterns of change that occur that might relate to altered cognition in Parkinson’s disease, and how these are related to CSF biomarkers, longitudinal data will be needed. Second, we identified network kernel structures that are found at rest. These may change during task, or in different populations, or had we used different regions of interest for our analysis. The slow temporal resolution of the blood oxygen level-dependent signal will affect the modelled structure of network kernels and their correlations. The structure of network kernels might be more detailed if measured using accelerated multi-band acquisition (as in Smith et al., 2012). More research is necessary to determine the structure of network kernels that explains cognitive function. Third, because our subjects were taking their normal medications, we cannot separate medication-related effects from Parkinson’s disease-related effects. The four unmedicated subjects in our sample showed the same pattern of group differences as all Parkinson’s disease participants (although not all differences were significant after correction for multiple comparisons). This supports the interpretation that these changes are related to pathological processes, but is speculative. Last, our results are based on a relatively small sample that will need to be replicated in a separate larger cohort.
Although we have used network kernel analysis to examine large-scale measures of system disruption, the method may prove to be an inherently more sensitive prognostic indicator of subtle physiological change than behavioural measures. Dynamic shifts in network configuration reflect changing task demands and directly support performance (Kelly et al., 2008; Spreng et al., 2010). The ability of the brain to support cognitive function in the face of profound injury, neuropathology, or developmental disruption indicates that function is supported by multiple degenerate neuronal systems (Damasio and Damasio, 1994; Noppeney et al., 2004). Therefore, altered dynamics give us insight into neural compensation in the face of systems degeneration. Network kernel analysis holds promise as a sensitive method for detecting biologically and clinical relevant changes to specific networks that support cognition and are impaired in Parkinson’s disease.
Table 2.
Peak locations and z-scores for DMN network and FPTC-frontal networks, and clusters where patients with Parkinson's disease differ from controls
| Voxels | P | Z (max) | x | y | z | Peak region | |
|---|---|---|---|---|---|---|---|
| DMN | |||||||
| PD mean | |||||||
| 51 387 | <0.001 | 8.41 | −2 | −58 | 28 | Precuneus | |
| 289 | <0.001 | 4.83 | 24 | −2 | −8 | ||
| Control mean | |||||||
| 48 573 | <0.001 | 8.12 | −4 | −54 | 28 | Cingulate gyrus | |
| 229 | <0.001 | 4.53 | 26 | 20 | −12 | Frontal orbital cortex | |
| PD > Control | |||||||
| 138 | 0.010 | 3.39 | 30 | 18 | 4 | Anterior insular cortex | |
| 108 | 0.047 | 3.21 | 40 | −38 | 40 | Supramarginal gyrus | |
| Control > PD | |||||||
| 188 | <0.001 | 3.52 | −28 | −52 | −8 | Hippocampus, fusiform cortex | |
| FPTC-frontal | |||||||
| PD Mean: | |||||||
| 56 116 | <0.001 | 7.43 | 44 | 8 | 36 | Middle frontal gyrus | |
| 360 | <0.001 | 4.9 | 10 | −14 | 8 | Right thalamus | |
| 118 | 0.024 | 3.85 | −54 | 2 | −38 | Temporal pole | |
| Control mean | |||||||
| 46 734 | <0.001 | 7.28 | 46 | 10 | 32 | Precentral gyrus | |
| 493 | <.001 | 4.04 | 46 | 12 | −38 | Temporal pole | |
| 289 | <0.001 | 4.14 | −46 | 8 | −40 | Temporal pole | |
| 161 | 0.003 | 4.16 | 0 | −10 | 8 | Left thalamus | |
| 145 | 0.006 | 3.76 | −28 | 14 | −38 | Temporal pole | |
| PD > Control | |||||||
| 123 | 0.019 | 3.65 | 40 | 4 | −8 | Insular cortex | |
PD = Parkinson’s disease.
Funding
This research was supported by grants from the National Institutes of Health 1RC4NS073008-01 and P50NS062684, and the Jane and Lee Seidman Fund.
Supplementary material
Supplementary material is available at Brain online.
Glossary
Abbreviations
- DMN
default mode network
- DAN
dorsal attention network
- FPTC
fronto-parietal task control network
- ICA
independent components analysis
References
- Asparouhov T, Muthén B. Exploratory structural equation modeling. Struct Equ Modeling 2009; 16: 397–438. doi:10.1080/10705510903008204 [Google Scholar]
- Barone P. Neurotransmission in Parkinson’s disease: beyond dopamine. Eur J Neurol 2010; 17: 364–76. doi:10.1111/j.1468-1331.2009.02900.x. [DOI] [PubMed] [Google Scholar]
- Beckmann C, Jenkinson M, Smith SM. General multi-level linear modeling for group analysis in FMRI. NeuroImage 2003; 20: 1052–63. [DOI] [PubMed] [Google Scholar]
- Beckmann CF, Smith SM. Probabilistic independent component analysis for functional magnetic resonance imaging. IEEE Trans Med Imaging 2004; 23: 137–52. doi:10.1109/TMI.2003.822821 [DOI] [PubMed] [Google Scholar]
- Braak H, Rüb U, Del Tredici K. Cognitive decline correlates with neuropathological stage in Parkinson’s disease. J Neurol Sci 2006; 248: 255–8. doi:10.1016/j.jns.2006.05.011 [DOI] [PubMed] [Google Scholar]
- Browne MW. An overview of analytic rotation in exploratory factor analysis. Multivariate Behav Res 2001; 36: 111–50. doi:10.1207/S15327906MBR3601_05 [Google Scholar]
- Buddhala C, Campbell MC, Perlmutter JS, Kotzbauer PT. Correlation between decreased CSF α-synuclein and Aβ1–42 in Parkinson disease. Neurobiol Aging 2015; 36: 476–84. doi:10.1016/j.neurobiolaging.2014.07.043 [DOI] [PMC free article] [PubMed] [Google Scholar]
- Cholerton BA, Zabetian CP, Wan JY, Montine TJ, Quinn JF, Mata IF, et al. Evaluation of mild cognitive impairment subtypes in Parkinson’s disease. Mov Disord 2014; 29: 756–64. doi:10.1002/mds.25875 [DOI] [PMC free article] [PubMed] [Google Scholar]
- Cholerton BA, Zabetian C, Quinn J, Chung K, Peterson A, Espay A, et al. Pacific northwest udall center of excellence clinical consortium: study design and baseline cohort characteristics. J Parkinson’s Dis 2013; 3: 205–14. doi:10.3233/JPD-130189 [DOI] [PMC free article] [PubMed] [Google Scholar]
- Christopher L, Koshimori Y, Lang AE, Criaud M, Strafella AP. Uncovering the role of the insula in non-motor symptoms of Parkinson’s disease. Brain 2014a; 137: 2143–54. doi:10.1093/brain/awu084 [DOI] [PMC free article] [PubMed] [Google Scholar]
- Christopher L, Marras C, Duff-Canning S, Koshimori Y, Chen R, Boileau I, et al. Combined insular and striatal dopamine dysfunction are associated with executive deficits in Parkinson’s disease with mild cognitive impairment. Brain 2014b; 137: 565–75. doi:10.1093/brain/awt337 [DOI] [PMC free article] [PubMed] [Google Scholar]
- Cole MW, Bassett DS, Power JD, Braver TS, Petersen SE, Intrinsic and task-evoked network architectures of the human brain. Neuron 2014; 83: 238–51. doi:10.1016/j.neuron.2014.05.014 [DOI] [PMC free article] [PubMed] [Google Scholar]
- Corbetta M, Shulman GL. Control of goal-directed and stimulus-driven attention in the brain. Nat Rev Neurosci 2002; 3: 201–15. doi:10.1038/nrn755 [DOI] [PubMed] [Google Scholar]
- Cox RW. AFNI: software for analysis and visualization of functional magnetic resonance neuroimages. Comput Biomed Res 1996; 29: 162–73. [DOI] [PubMed] [Google Scholar]
- Damasio AR, Damasio H. Cortical systems for retrieval of concrete knowledge: the Convergence zone framework. In: Koch C, Davis J, Editors, Large-scale neuronal theories of the brain. Cambridge, MA: MIT Press; 1994. p. 61–74. [Google Scholar]
- Dang LC, O’Neil JP, Jagust WJ. Dopamine supports coupling of attention-related networks. J Neurosci 2012; 32: 9582–7. doi:10.1523/JNEUROSCI.0909-12.2012 [DOI] [PMC free article] [PubMed] [Google Scholar]
- Dickerson BC, Salat DH, Greve DN, Chua EF, Rand-Giovannetti E, Rentz DM, et al. Increased hippocampal activation in mild cognitive impairment compared to normal aging and AD. Neurology 2005; 65: 404–11. [DOI] [PMC free article] [PubMed] [Google Scholar]
- Dosenbach NUF, Fair DA, Miezin FM, Cohen AL, Wenger KK, Dosenbach RAT, et al. Distinct brain networks for adaptive and stable task control in humans. Proc Natl Acad Sci USA 2007; 104: 11073–8. doi:10.1073/pnas.0704320104 [DOI] [PMC free article] [PubMed] [Google Scholar]
- Eckert T, Tang C, Eidelberg D. Assessment of the progression of Parkinson’s disease: a metabolic network approach. Lancet Neurol 2007; 6: 926–32. doi:10.1016/S1474-4422(07)70245-4 [DOI] [PMC free article] [PubMed] [Google Scholar]
- Fagan AM, Mintun MA, Mach RH, Lee S-Y, Dence CS, Shah AR, et al. Inverse relation between in vivo amyloid imaging load and cerebrospinal fluid Aβ42 in humans. Ann Neurol 2006; 59: 512–19. doi:10.1002/ana.20730 [DOI] [PubMed] [Google Scholar]
- Fan J, McCandliss BD, Fossella J, Flombaum JI, Posner MI. The activation of attentional networks. Neuroimage 2005; 26: 471–79. doi:10.1016/j.neuroimage.2005.02.004 [DOI] [PubMed] [Google Scholar]
- Filippini N, MacIntosh BJ, Hough MG, Goodwin GM, Frisoni GB, Smith SM, et al. Distinct patterns of brain activity in young carriers of the APOE-ε4 allele. Proc Natl Acad Sci USA 2009; 106; 7209–14. [DOI] [PMC free article] [PubMed] [Google Scholar]
- Fischl B, Dale A. Measuring the thickness of the human cerebral cortex from magnetic resonance images. Proc Natl Acad Sci USA 2000; 97: 11050–5. [DOI] [PMC free article] [PubMed] [Google Scholar]
- Fox MD, Raichle ME. Spontaneous fluctuations in brain activity observed with functional magnetic resonance imaging. Nat Rev Neurosci 2007; 8: 700–11. doi:10.1038/nrn2201 [DOI] [PubMed] [Google Scholar]
- Goetz CG, Fahn S, Martinez-Martin P, Poewe W, Sampaio C, Stebbins GT, et al. Movement Disorder Society-sponsored revision of the Unified Parkinson’s Disease Rating Scale (MDS-UPDRS): Process, format, and clinimetric testing plan. Mov Disord 2007; 22: 41–7. doi:10.1002/mds.21198 [DOI] [PubMed] [Google Scholar]
- Grimmer T, Riemenschneider M, Förstl H, Henriksen G, Klunk WE, Mathis CA, et al. Beta amyloid in Alzheimer’s disease: increased deposition in brain is reflected in reduced concentration in cerebrospinal fluid. Biol Psychiatry 2009; 65: 927–34. doi:10.1016/j.biopsych.2009.01.027 [DOI] [PMC free article] [PubMed] [Google Scholar]
- Handwerker DA, Roopchansingh V, Gonzalez-Castillo J, Bandettini PA. Periodic changes in fMRI connectivity. Neuroimage 2012; 63: 1712–19. doi:10.1016/j.neuroimage.2012.06.078 [DOI] [PMC free article] [PubMed] [Google Scholar]
- Hoehn MM, Yahr MD. Parkinsonism: onset, progression and mortality. Neurology 1967; 17: 427–42. [DOI] [PubMed] [Google Scholar]
- Huang C, Mattis P, Tang C, Perrine K, Carbon M, Eidelberg D. Metabolic brain networks associated with cognitive function in Parkinson’s disease. Neuroimage 2007; 34: 714–23. doi:10.1016/j.neuroimage.2006.09.003 [DOI] [PMC free article] [PubMed] [Google Scholar]
- Irwin DJ, Lee VM-Y, Trojanowski JQ. Parkinson’s disease dementia: convergence of α-synuclein, tau and amyloid-β pathologies. Nat Rev Neurosci 2013; 14: 626–36. doi:10.1038/nrn3549 [DOI] [PMC free article] [PubMed] [Google Scholar]
- Irwin DJ, White MT, Toledo JB, Xie SX, Robinson JL, Van Deerlin V, et al. Neuropathologic substrates of Parkinson disease dementia. Ann Neurol 2012; 72: 587–98. doi:10.1002/ana.23659 [DOI] [PMC free article] [PubMed] [Google Scholar]
- Jenkinson M, Bannister P, Brady M, Smith S. Improved optimization for the robust and accurate linear registration and motion correction of brain images. Neuroimage 2002; 17: 825–41. [DOI] [PubMed] [Google Scholar]
- Jenkinson M, Beckmann CF, Behrens TEJ, Woolrich MW, Smith SM. FSL. Neuroimage 2012; 62: 782–90. doi:10.1016/j.neuroimage.2011.09.015 [DOI] [PubMed] [Google Scholar]
- Kang J-H, Irwin DJ, Chen-Plotkin AS, Siderowf A, Caspell C, Coffey CS, et al. Association of cerebrospinal fluid β-amyloid 1-42, T-tau, P-tau181, and α-synuclein levels with clinical features of drug-naive patients with early Parkinson disease. JAMA Neurol 2013; 70: 1277–87. doi:10.1001/jamaneurol.2013.3861 [DOI] [PMC free article] [PubMed] [Google Scholar]
- Kelly AMC, Uddin LQ, Biswal BB, Castellanos FX, Milham MP. Competition between functional brain networks mediates behavioral variability. Neuroimage 2008; 39: 527–37. doi:10.1016/j.neuroimage.2007.08.008 [DOI] [PubMed] [Google Scholar]
- Kelly RE, Jr., Alexopoulos GS, Wang Z, Gunning FM, Murphy CF, Morimoto SS, et al. Visual inspection of independent components: defining a procedure for artifact removal from fMRI data. J Neurosci Methods 2010; 189: 233–45. doi:10.1016/j.jneumeth.2010.03.028 [DOI] [PMC free article] [PubMed] [Google Scholar]
- Madhyastha TM, Askren MK, Boord P, Grabowski TJ. Dynamic connectivity at rest predicts attention task performance. Brain Connect 2014; 5: 45–59. doi:10.1089/brain.2014.0248 [DOI] [PMC free article] [PubMed] [Google Scholar]
- Madhyastha TM, Askren MK, Boord P, Grabowski TJ. Dynamic connectivity at rest predicts attention task performance. Brain Connectivity 2015; 5: 45–59. [DOI] [PMC free article] [PubMed] [Google Scholar]
- Mata IF, Leverenz JB, Weintraub D, Trojanowski JQ, Hurtig HI, Van Deerlin VM, et al. APoe, mapt, and snca genes and cognitive performance in parkinson disease. JAMA Neurol 2014; 71: 1405–12. doi:10.1001/jamaneurol.2014.1455 [DOI] [PMC free article] [PubMed] [Google Scholar]
- Mattila PM, Röyttä M, Lönnberg P, Marjamäki P, Helenius H, Rinne JO. Choline acetytransferase activity and striatal dopamine receptors in Parkinson’s disease in relation to cognitive impairment. Acta Neuropathol 2001; 102: 160–6. [DOI] [PubMed] [Google Scholar]
- Menon V, Uddin LQ. Saliency, switching, attention and control: a network model of insula function. Brain Struct Funct 2010; 214: 655–67. doi:10.1007/s00429-010-0262-0 [DOI] [PMC free article] [PubMed] [Google Scholar]
- Miller SL, Celone K, DePeau K, Diamond E, Dickerson BC, Rentz D, et al. Age-related memory impairment associated with loss of parietal deactivation but preserved hippocampal activation. Proc Natl Acad Sci USA 2008; 105: 2181–6. doi:10.1073/pnas.0706818105 [DOI] [PMC free article] [PubMed] [Google Scholar]
- Montine TJ, Shi M, Quinn JF, Peskind ER, Craft S, Ginghina C, et al. CSF Aβ42 and tau in Parkinson’s disease with cognitive impairment. Mov Disord 2010; 25: 2682–5. doi:10.1002/mds.23287 [DOI] [PMC free article] [PubMed] [Google Scholar]
- Nasreddine ZS1, Phillips NA, Bédirian V, Charbonneau S, Whitehead V, Collin I, et al. The Montreal Cognitive Assessment, MoCA: a brief screening tool for mild cognitive impairment. J Am Geriatr Soc 2005; 53: 695–9. [DOI] [PubMed] [Google Scholar]
- Niazy RK, Xie J, Miller K, Beckmann CF, Smith SM. Spectral characteristics of resting state networks. Prog Brain Res 2011; 193: 259–76. doi:10.1016/B978-0-444-53839-0.00017-X [DOI] [PubMed] [Google Scholar]
- Noppeney U, Friston KJ, Price CJ. Degenerate neuronal systems sustaining cognitive functions. J Anat 2004; 205: 433–42. doi:10.1111/j.0021-8782.2004.00343.x [DOI] [PMC free article] [PubMed] [Google Scholar]
- Power JD, Mitra A, Laumann TO, Snyder AZ, Schlaggar BL, Petersen SE. Methods to detect, characterize, and remove motion artifact in resting state fMRI. Neuroimage 2014; 84: 320–41. doi:10.1016/j.neuroimage.2013.08.048 [DOI] [PMC free article] [PubMed] [Google Scholar]
- Raichle ME, MacLeod AM, Snyder AZ, Powers WJ, Gusnard DA, Shulman GL. A default mode of brain function. Proc Natl Acad Sci USA 2001; 98: 676–82. [DOI] [PMC free article] [PubMed] [Google Scholar]
- Salimi-Khorshidi G, Douaud G, Beckmann CF, Glasser MF, Griffanti L, Smith SM. Automatic denoising of functional MRI data: combining independent component analysis and hierarchical fusion of classifiers. Neuroimage 2014; 90, 449–68. doi:10.1016/j.neuroimage.2013.11.046 [DOI] [PMC free article] [PubMed] [Google Scholar]
- Seeley WW, Menon V, Schatzberg AF, Keller J, Glover GH, Kenna H, et al. Dissociable intrinsic connectivity networks for salience processing and executive control. J Neurosci 2007; 27: 2349–56. doi:10.1523/JNEUROSCI.5587-06.2007 [DOI] [PMC free article] [PubMed] [Google Scholar]
- Shi M, Bradner J, Hancock AM, Chung KA, Quinn JF, Peskind ER, et al. Cerebrospinal fluid biomarkers for Parkinson disease diagnosis and progression. Ann Neurol 2011; 69: 570–80. doi:10.1002/ana.22311 [DOI] [PMC free article] [PubMed] [Google Scholar]
- Shine JM, Halliday GM, Gilat M, Matar E, Bolitho SJ, Carlos M, et al. The role of dysfunctional attentional control networks in visual misperceptions in Parkinson’s disease. Hum Brain Mapp 2013; 35; 2206–19. doi:10.1002/hbm.22321 [DOI] [PMC free article] [PubMed] [Google Scholar]
- Shine JM, O’Callaghan C, Halliday GM, Lewis SJG. Tricks of the mind: visual hallucinations as disorders of attention. Prog Neurobiol 2014; 116: 58–65. doi:10.1016/j.pneurobio.2014.01.004 [DOI] [PubMed] [Google Scholar]
- Smith SM, Miller KL, Moeller S, Xu J, Auerbach EJ, Woolrich MW, et al. Temporally-independent functional modes of spontaneous brain activity. Proc Natl Acad Sci USA 2012; 109: 3131–6. doi:10.1073/pnas.1121329109 [DOI] [PMC free article] [PubMed] [Google Scholar]
- Spreng RN, Sepulcre J, Turner GR, Stevens WD, Schacter DL. Intrinsic architecture underlying the relations among the default, dorsal attention, and frontoparietal control networks of the human brain. J Cogn Neurosci 2013; 25: 74–86. doi:10.1162/jocn_a_00281 [DOI] [PMC free article] [PubMed] [Google Scholar]
- Spreng RN, Stevens WD, Chamberlain JP, Gilmore AW, Schacter DL. Default network activity, coupled with the frontoparietal control network, supports goal-directed cognition. Neuroimage 2010; 53: 303–17. doi:10.1016/j.neuroimage.2010.06.016 [DOI] [PMC free article] [PubMed] [Google Scholar]
- Sridharan D, Levitin DJ, Menon V. A critical role for the right fronto-insular cortex in switching between central-executive and default-mode networks. PNAS 2008; 105: 12569–74. doi:10.1073/pnas.0800005105 [DOI] [PMC free article] [PubMed] [Google Scholar]
- Stewart T, Liu C, Ginghina C, Cain KC, Auinger P, Cholerton B, et al. Cerebrospinal fluid α-synuclein predicts cognitive decline in Parkinson disease progression in the DATATOP cohort. Am J Pathol 2014; 184: 966–75. doi:10.1016/j.ajpath.2013.12.007 [DOI] [PMC free article] [PubMed] [Google Scholar]
- Vannini P, O’Brien J, O’Keefe K, Pihlajamäki M, Laviolette P, Sperling RA. What goes down must come up: role of the posteromedial cortices in encoding and retrieval. Cereb Cortex 2011; 21: 22–34. doi:10.1093/cercor/bhq051 [DOI] [PMC free article] [PubMed] [Google Scholar]
- Woolrich MW, Ripley BD, Brady M, Smith SM. Temporal autocorrelation in univariate linear modeling of FMRI data. Neuroimage 2001; 14: 1370–86. doi:10.1006/nimg.2001.0931 [DOI] [PubMed] [Google Scholar]
- Woolrich MW, Behrens TEJ, Beckmann CF, Jenkinson M, Smith SM. Multi-level linear modelling for FMRI group analysis using Bayesian inference. Neuroimage 2004; 21: 1732–47. [DOI] [PubMed] [Google Scholar]
- Worsley KJ. Statistical analysis of activation images. In: Jezzard P, Matthews PM, Smith SM, editors. Ch 14, Functional MRI: an introduction to methods. Oxford University Press; 2001. [Google Scholar]
- Wooten GF, Currie LJ, Bovbjerg VE, Lee JK, Patrie J. Are men at greater risk for Parkinson’s disease than women? J Neurol Neurosurg Psychiatr 2004; 75: 637–9. [DOI] [PMC free article] [PubMed] [Google Scholar]
- Zhang J, Sokal I, Peskind ER, Quinn JF, Jankovic J, Kenney C, et al. CSF Multianalyte Profile distinguishes Alzheimer and Parkinson diseases. Am J Clin Pathol 2008; 129: 526–9. doi:10.1309/W01Y0B808EMEH12L [DOI] [PMC free article] [PubMed] [Google Scholar]
Associated Data
This section collects any data citations, data availability statements, or supplementary materials included in this article.