

Abstract
Purpose
To assess the association between self-reported racial discrimination and prenatal depressive symptoms among black women.
Methods
Our study population consisted of two cohorts of pregnant women: the Asthma Coalition on Community, Environment, and Social Stress project (ACCESS) and Project Viva. We measured self-reported racial discrimination among black women using a modified Experiences of Discrimination scale (score 0–8). We assessed elevated depressive symptoms (EDS) with the Edinburgh Postnatal Depression Scale (≥13 on a 0–30 scale).
Results
Fifty-four percent of ACCESS and 78% of Viva participants reported experiencing racial discrimination. After adjusting for age, marital status, income, education, and nativity, a 1-U increment in Experiences of Discrimination score was associated with 48% increased odds of EDS (odds ratio, 1.48; 95% confidence interval, 1.24–1.76) for ACCESS participants but was not significantly associated among Viva participants (odds ratio, 1.12; 95% confidence interval, 0.92–1.37). In both cohorts, responding to unfair treatment by talking to others was associated with the lowest odds of EDS.
Conclusions
Our findings suggest that higher levels of perceived racial discrimination may increase depressive symptoms during pregnancy among U.S. black women. Interventions involving talking to others may aid in reducing the risk of depressive symptoms among black women experiencing higher levels of racial discrimination.
Keywords: Prenatal depression, Racial discrimination, Missing data, Perinatal mental health, Unfair treatment, Socioeconomic status, Depression, Prejudice, Prenatal
Introduction
Depression during pregnancy is widespread and has deleterious consequences for maternal, fetal, and child health. Recent meta-analyses estimated that 7%–13% of pregnant women experience depression, although estimates from individual studies range widely [1,2]. Elevated depressive symptoms (EDS) are a significant source of suffering for pregnant women, a strong predictor of postpartum depression [3–5], and are associated with increased risk of adverse health outcomes in neonates and children [6–9]. In the United States, black or African American women (compared with whites) and women with low socioeconomic status (compared with high) are more likely to experience EDS during pregnancy [1,10].
The prevalence of and adverse outcomes associated with prenatal depression, as well as the difficulties in managing and treating during pregnancy [11], make elucidation of the modifiable causes of prenatal depression an important public health goal. Although the causes of prenatal depression are multifactorial, previous literature provides evidence that social stressors play an important role [10,12,13]. One prevalent and understudied social stressor that may contribute to EDS during pregnancy among black or African American women is exposure to racial discrimination.
Discrimination is associated with depression and depressive symptoms in nonpregnant samples of women identified as black or African American [14–16]. To our knowledge, only one study has examined the association between racial discrimination and prenatal depression, finding that pregnant women who reported experiencing lifetime racial discrimination had more depressive symptoms than those who reported no racial discrimination [17]. While studies indicate the importance of how one responds to or copes with discriminatory events [14,18–20], few studies have assessed coping with discrimination among pregnant women.
When studying health effects of racial discrimination, it is important to consider socioeconomic position. Individuals of higher socioeconomic position may be more likely to report racial discrimination [18,21–23]; however, the mental health impact of discrimination may be greater in individuals with low educational attainment or limited resources [24]. These relations are complex and have not been adequately studied.
Understanding relations between racial discrimination, response to unfair treatment, and depressive symptoms has great potential to contribute to prevention and treatment strategies for prenatal depression; however, our knowledge in this arena is very limited. To address this knowledge gap, we used data on black women enrolled in two U.S. cohorts of pregnant women to examine associations between racial discrimination and prenatal depressive symptoms and explored the role of response to unfair treatment as it relates to prenatal depressive symptoms. By incorporating two cohorts that differed in their sociodemographic profile, we were able to explore these associations across a broad sociodemographic range and explicitly test whether associations differed by socioeconomic position.
Methods
We used data from two prospective cohort studies: the Asthma Coalition on Community, Environment, and Social Stress project (ACCESS), whose participants were drawn largely from public clinics, and Project Viva, whose participants were drawn from private obstetrical practices. These studies enrolled women in early pregnancy from the Boston area and were designed to have complementary protocols and similar survey instruments to measure women’s experiences of racial discrimination. Project ACCESS participants were recruited between August 2001 and January 2007. Women receiving prenatal care at Brigham and Women’s Hospital, Boston Medical Center, and three urban community health centers, as well as pregnant women attending Women, Infants and Children programs associated with health centers in the Boston area were eligible to participate in Project ACCESS. Women who did not speak English or Spanish, were younger than 18 years, or did not plan to carry the pregnancy to term were excluded [25]. This analysis included only the first birth of each participant and excluded women with multiple gestations. In Project ACCESS, among 1641 women who were screened, 1501 were eligible, 1267 (84% of those eligible) were initially enrolled; of these, 979 (77.2%) gave birth to a live infant and continued follow-up in the longitudinal study. The current analysis is restricted to women who self-identified as non-Hispanic black or African American, n = 525. The Project ACCESS study was approved by the human studies committees at the Brigham and Women’s Hospital and the Boston Medical Center.
Project Viva participants were recruited between 1999 and 2002 at their first prenatal visit to one of the eight obstetrical practices of Harvard Vanguard Medical Associates in the greater Boston area. Project Viva, designed to study early origins of childhood obesity, excluded subjects based on the following criteria: multiple gestation, inability to answer questions in English, plans to move out of the area before delivery, and gestational age more than 22 weeks at the first prenatal visit. Project Viva staff enrolled 2670 pregnant women (64% of those eligible); 329 subsequently became ineligible (60% because they were no longer pregnant), 195 withdrew, and 18 were lost to follow-up; thus, 2128 participants delivered a live infant [26]. The current analysis is restricted to women who self-identified as non-Hispanic black or African American, n = 352. The Project Viva study was approved by the Institutional Review Board at the Harvard Pilgrim Health Care.
Measures
Racial discrimination
Project ACCESS and Project Viva assessed self-reported experiences of racial discrimination with a modified version of the Experiences of Discrimination (EOD) questionnaire ([27] based on studies by Krieger et al. [28,29]). This modified version of EOD asks participants to respond “yes” or “no” to “I have experienced unfair or bad treatment because of my race or ethnicity” in eight different situational domains: at school, getting hired or getting a job, at work, getting housing, getting medical care, getting service in a store or restaurant, on the street or in a public setting, and from the police or in the courts (no = 0, yes = 1). We summed “yes” responses to produce a racial discrimination count (range 0–8). Project ACCESS and Project Viva administered this questionnaire in mid-pregnancy and in early pregnancy, respectively. In a validation study among black adults, EOD showed good internal reliability, adequate internal consistency, and test–retest reliability. Confirmatory factor analysis showed that the EOD items were assessing a unidimensional measure of discrimination [27].
Response to unfair treatment
Project ACCESS and Project Viva asked participants, also using a modified version of EOD, “When I am treated unfairly by someone who has authority or more power than I do, I typically, ‘talk to other people about it’ or ‘keep it to myself” Participants were also asked whether they typically “accept it as a fact of life” or “try to do something about it.” Consistent with prior literature [27–29], we combined these responses to classify participants into one of the four categories: (1) talk to others and try to do something about it (talk, act), (2) talk to others and accept it as a fact of life (talk, accept), (3) keep it to myself and do something (quiet, act), and (4) keep it to myself and accept it (quiet, accept).
Depressive symptoms
The 10-item Edinburgh Postnatal Depression Scale (EPDS) was administered during mid-pregnancy via interview for Project ACCESS participants and as part of a self-report questionnaire for Project Viva participants. EPDS is the only self-reported depression scale that has been validated for use during pregnancy and in the postpartum period [30,31]. EPDS is a screening tool that measures probable depression and is not a clinical diagnosis of depression. We used the standard cut point of 13 or more (on the 0–30 point scale) to indicate EDS, consistent with previous research [3,8,32]. We also ran the analysis using an EPDS cut point of 15 or more, as some authors prefer that cut point [31,33]. Results were largely the same; thus, we report only results using the cut point of 13 or more.
Covariates
Covariates were chosen based on their previously established relationship with racial discrimination and/or depression. In both Project ACCESS and Project Viva, women self-reported age (coded categorically in years: <20, 20 to <25, 25 to <30, 30 to <35, and ≥35), race or ethnicity, education (coded categorically: did not complete high school, high school graduate or graduate equivalency degree, some college, college degree, and graduate school), marital status (married, cohabitating, and unpartnered), parity (0, 1, and 2+), country of birth (United States or non-United States), employment status (yes or no), household income (<$5000, $5001–$10,000, $10,001–$20,000, $20,001–$40,000, $40,001–$70,000, and >$70,000), social support (measured with the Turner Social Support Scale [34]), and ethnic identity (measured in ACCESS with the Multigroup Ethnic Identity Measure [35,36] and in Viva with two single-item questions). Additionally, in Project ACCESS, we include self-report of how difficult it was to live on their household income and in Project Viva whether the current pregnancy was intended.
Statistical analysis
Epidemiologic studies typically use a “complete case” approach in which only subjects with complete data on all study variables are included in the analysis. Preliminary examination in these data sets raised concerns about missingness and potential selection bias in a complete case approach. As shown in Table 1, a complete case approach would exclude a large proportion of study subjects because of missing data (complete case n = 131 vs. imputed n = 526 in ACCESS; complete case n = 113 vs. imputed n = 352 in Viva). Also shown in Table 1, complete case subjects tended to be more advantaged compared with the observed data: compared with observed subjects, complete case subjects tended to have higher levels of education, were more likely to be married, and had higher income (for Viva only). Given these differences, the data are not “missing completely at random [37];” thus, the complete case approach is not based on a random sample from the source population and selection bias may be present. In this scenario, unbiased and more efficient analyses may be produced through the use of multiple imputation [37–39].
Table 1.
Selected characteristics (complete case, observed values, and the average across imputed data sets presented) of black participants in Project ACCESS and Project Viva, Boston, Massachusetts
| Variable | Project ACCESS
|
Project Viva
|
||||
|---|---|---|---|---|---|---|
| Complete case (n =131)
|
Observed data (n varies)
|
Average across imputed data sets (n =526)
|
Complete case (n =113)
|
Observed data (n varies)
|
Average across imputed data sets (n = 352)
|
|
| n (%) | n (%) | n (%) | n (%) | n (%) | n (%) | |
| Age (y) | ||||||
| <20 | 18 (13.7) | 73 (15.8) | 82 (15.5) | 4 (3.5) | 35 (10.1) | 35 (10.1) |
| 20 to <25 | 41 (31.3) | 157 (33.9) | 177 (33.7) | 17 (15.0) | 51 (14.7) | 52 (14.6) |
| 25 to <30 | 32 (24.4) | 109 (23.5) | 128 (24.3) | 29 (25.7) | 93 (26.7) | 94 (26.7) |
| 30 to <35 | 20 (15.3) | 72 (15.6) | 83 (15.7) | 36 (31.9) | 100 (28.7) | 101 (28.8) |
| ≥35 | 20 (15.3) | 52 (11.2) | 57 (10.8) | 27 (23.9) | 69 (19.8) | 70 (19.8) |
| Missing | 0 | 0 | ||||
| Marital status | ||||||
| Unpartnered | 65 (49.6) | 246 (54.1) | 284 (54.1) | 24 (21.2) | 86 (24.7) | 87 (24.7) |
| Cohabitating | 34 (26.0) | 116 (25.5) | 134 (25.5) | 27 (23.9) | 95 (27.3) | 96 (27.2) |
| Married | 32 (24.4) | 93 (20.4) | 107 (20.3) | 62 (54.9) | 167 (48.0) | 169 (48.0) |
| Missing | 8 | 0 | ||||
| Annual household income | ||||||
| <$5000 | 25 (19.1) | 38 (20.3) | 111 (21.0) | 0 (0.0) | 6 (2.4) | 23 (6.7) |
| $5001–$10,000 | 28 (21.4) | 39 (20.9) | 132 (25.2) | 4 (3.5) | 12 (4.7) | 22 (6.2) |
| $10,001–$20,000 | 21 (16.0) | 26 (13.9) | 101 (19.1) | 4 (3.5) | 21 (8.3) | 33 (9.5) |
| $20,001–$40,000 | 33 (25.2) | 49 (26.2) | 96 (18.3) | 26 (23.0) | 71 (28.1) | 88 (25.1) |
| $40,001–$70,000 | 17 (13.0) | 25 (13.4) | 50 (9.6) | 43 (38.1) | 77 (30.4) | 97 (27.6) |
| >$70,000 | 7 (5.3) | 10 (5.4) | 36 (6.8) | 36 (31.9) | 66 (26.1) | 88 (24.9) |
| Missing | 276 | 95 | ||||
| Education | ||||||
| Less than HS | 24 (18.3) | 103 (22.7) | 126 (23.9) | 1 (0.9) | 31 (8.9) | 32 (9.0) |
| HS graduate | 40 (30.5) | 151 (33.3) | 173 (32.9) | 9 (8.0) | 67 (19.3) | 67 (19.2) |
| Some college | 52 (36.7) | 157 (34.7) | 172 (32.7) | 43 (38.1) | 129 (37.1) | 130 (36.9) |
| College degree | 14 (10.7) | 40 (8.8) | 47 (9.0) | 43 (38.1) | 84 (24.1) | 85 (24.2) |
| Graduate school | 1 (0.8) | 2 (0.4) | 7 (1.4) | 17 (15.0) | 37 (10.6) | 38 (10.8) |
| Missing | 10 | 0 | ||||
| Nativity | ||||||
| Foreign born | 54 (41.2) | 217 (47.1) | 250 (47.5) | 41 (36.3) | 125 (36.6) | 129 (36.8) |
| U.S. born | 77 (58.8) | 244 (52.9) | 276 (52.5) | 72 (63.7) | 217 (63.5) | 222 (63.2) |
| Missing | 2 | 6 | ||||
| Racial discrimination (no. of domains) | ||||||
| 0 | 74 (56.5) | 153 (57.1) | 244 (46.4) | 22 (19.5) | 60 (23.7) | 77 (21.9) |
| 1 | 12 (9.2) | 33 (12.3) | 107 (20.4) | 14 (12.4) | 32 (12.7) | 52 (14.9) |
| 2 | 11 (8.4) | 27 (10.1) | 74 (14.1) | 18 (15.9) | 47 (18.6) | 66 (18.8) |
| 3 | 15 (11.5) | 22 (8.2) | 46 (8.8) | 20 (17.7) | 42 (16.6) | 57 (16.2) |
| 4 | 11 (8.4) | 14 (5.2) | 25 (4.7) | 19 (16.8) | 32 (12.7) | 42 (12.0) |
| 5 | 5 (3.9) | 11 (4.1) | 16 (3.0) | 9 (8.0) | 17 (6.7) | 24 (6.8) |
| 6 | 2 (1.5) | 4 (1.5) | 7 (1.3) | 6 (5.3) | 14 (5.5) | 18 (5.2) |
| 7 | 1 (0.8) | 3 (1.1) | 4 (0.7) | 1 (0.9) | 3 (1.2) | 6 (1.6) |
| 8 | 0 (0.0) | 1 (0.4) | 3 (0.5) | 4 (3.5) | 6 (2.4) | 9 (2.6) |
| Missing | 195 | 95 | ||||
| Response to unfair treatment | ||||||
| Talk, act | 92 (70.2) | 185 (68.8) | 353 (67.2) | 91 (80.5) | 167 (76.3) | 258 (73.3) |
| Talk, accept | 20 (15.3) | 32 (11.9) | 62 (11.8) | 10 (8.9) | 22 (10.1) | 36 (10.2) |
| Quiet, act | 12 (9.2) | 32 (11.9) | 66 (12.6) | 5 (4.4) | 17 (7.8) | 33 (9.5) |
| Quiet, accept | 7 (5.3) | 20 (7.4) | 44 (8.4) | 7 (6.2) | 13 (5.9) | 25 (7.1) |
| Missing | 194 | 129 | ||||
| EDS | ||||||
| No | 95 (75.5) | 212 (74.7) | 394 (75.0) | 97 (85.8) | 164 (85.4) | 304 (86.6) |
| Yes | 36 (27.5) | 72 (25.3) | 131 (25.0) | 16 (14.2) | 28 (14.6) | 47 (13.4) |
| Missing | 179 | 156 | ||||
HS =high school.
Complete case data represent the participants with observed data on all study variables. Observed data include all observed values, with n observed varying by variable. Average across imputed data sets present results using multiple imputed data sets.
Racial discrimination assessed by a modified version of the EOD scale (range 0–8). EDS is defined as EPDS scores of 13 and greater.
We used IVEware (Imputation and Variance Estimation software) [40,41] (Survey Methodology Program, Survey Research Center, Institute for Social Research, University of Michigan) to produce 20 complete data sets for Project ACCESS and Project Viva. In our imputation model, we used all analysis variables (exposures, outcome, covariates), as well as potential predictors of missing values and missing mechanisms [42,43]: maternal pre-pregnancy body mass index, age moved to the United States, history of depression, anxiety during pregnancy, smoking during pregnancy, experience of physical or sexual abuse, household size, and childhood economic deprivation. All results reported in the text, Table 2, and Fig.1 are based on the imputed data.
Table 2.
ORs (95% CIs) for prenatal EDS associated with a 1-U increment in EOD Project ACCESS and Project Viva, Boston, Massachusetts
| Model | Project ACCESS
|
Project Viva
|
|---|---|---|
| OR (95% CI) | OR (95% CI) | |
| Model 1 | ||
| Racial discrimination (1 U) | 1.43 (1.22–1.68) | 1.11 (0.93–1.33) |
| Model 2 | ||
| Racial discrimination (1 U) | 1.48 (1.24–1.76) | 1.12 (0.92–1.37) |
| Model 3 | ||
| Racial discrimination (1 U) | 1.48 (1.24–1.78) | 1.13 (0.93–1.38) |
Model 1 adjusts for age; model 2 adjusts for age, marital status, household income, education, and nativity; model 3 adds response to unfair treatment. Racial discrimination assessed with a modified version of the EOD scale (range 0–8).
Fig. 1.
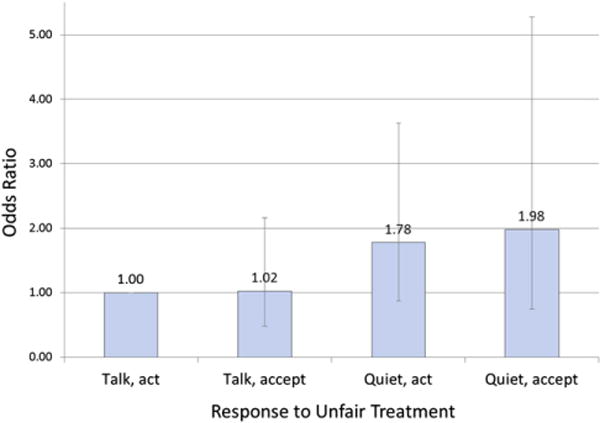
ORs (95% CIs) for response to unfair treatment and prenatal EDS, Project ACCESS and Project Viva, Boston, Massachusetts. Model adjusts for age, marital status, household income, education, nativity, racial discrimination, cohort, and cohort × racial discrimination. Notes: 1) talk, act is the reference; 2) error bars represent 95% CIs; 3) there was not a statistically significant interaction between cohort and response to unfair treatment; thus, we present ORs for the combined cohorts here; 4) response to unfair treatment assessed by a modified EODs questionnaire. The questions regarding response to unfair treatment were preceded by this text: “The questions below ask about how you typically respond when you have been treated unfairly by someone who has authority or more power than you (not including family members), like a teacher, supervisor, boss, store clerk, or government employee.” The individual questions were the following: “When I am treated unfairly by someone who has authority or more power than I do, I typically,” with two sets of response options: “talk to other people about it” or “keep it to myself and whether they typically “accept it as a fact of life” or “try to do something about it.” Consistent with prior literature, we combined these responses to classify participants into one of the four categories: talk to others and try to do something about it (talk, act), talk to others and accept it as a fact of life (talk, accept), keep it to myself and do something (quiet, act), and keep it to myself and accept it (quiet, accept).
We used logistic regression to estimate odds ratios (ORs) of prenatal depression associated with racial discrimination and response to unfair treatment, combining information across the imputed data sets [37]. We also examined the primary models in the complete case subjects. We conducted analyses in SAS version 9.1 (SAS Institute, Cary, NC).
Our primary exposure, racial discrimination, is a count variable (0–8). Preliminary analysis in Project ACCESS revealed a significant linear association between the racial discrimination score and EDS (P < .01) with no other functional form fitting the data; therefore, we modeled racial discrimination as a continuous term. There was not a strong relationship between racial discrimination and EDS in Project Viva for any functional form, so we present results using racial discrimination as a continuous term to be consistent with our approach for Project ACCESS.
To understand possible confounding associations, we ran a series of models. Model 1 adjusts for age. Model 2 additionally adjusts for marital status, household income, education, and place of birth (United States or outside United States). Model 3 adds usual response to unfair treatment to model 2. We excluded covariates that did not change our main effect by more than 10% (maternal employment status during pregnancy, parity, social support, ethnic identity [in Project ACCESS], how difficult it was to live on household income, and [in Project Viva] pregnancy intention). The association between racial discrimination and prenatal depressive symptoms may vary according to sociodemographic characteristics, so we evaluated effect modification by nativity, income, education, social support, ethnic identity, and response to unfair treatment within each cohort by adding interaction terms to model 3 and estimating their effects. We also formally tested whether the association between racial discrimination and EDS differed by cohort by combining the two cohorts and including an interaction term. Given that the interaction term was significant, we present results for racial discrimination separately for Project ACCESS and Project Viva. In contrast, for our secondary exposure, response to unfair treatment, there was not a statistical difference between the cohorts, so we present results from the combined data set for these relations. In the combined data set, we also tested whether education and income explained the different associations between the cohorts by including interaction terms of racial discrimination with each of these two factors. We concluded that interaction existed if P < .10 for the interaction term.
Results
Sociodemographic characteristics and prevalence of racial discrimination and EDS among Project ACCESS and Project Viva participants are presented in Table 1 for complete case (those subjects who had data for all study variables), observed (subjects with data observed for that variable, regardless of missingness for other variables), and imputed (including all subjects, with imputed values averaged across data sets). As shown in Table 1, complete case subjects tended to be more advantaged in education, income, and marital status compared with observed data. Imputed values largely reflect patterns from the observed data; thus, all results presented henceforth take advantage of the imputed data sets. Black women in Project ACCESS tended to be younger than 30 years (74%), unpartnered (54%), and have annual household incomes of less than $10,000 (46%). In contrast, black women in Project Viva were slightly older than ACCESS participants, less likely to be unpartnered (25%), and less likely to have annual household incomes less than $10,000 (13%).
The prevalence of EDS was 25% in Project ACCESS and 13% in Project Viva. Fifty-four percent of ACCESS participants and 78% of Viva participants reported experiencing racial discrimination in one or more domains (Table 1). In both cohorts, the most frequent reports of unfair treatment were while getting service in a store or restaurant and on the street or in a public setting; additionally, Project Viva participants reported high levels of unfair treatment at school and in the workplace. Project Viva and Project ACCESS participants were most likely to report that their usual response to unfair treatment was talking to others and trying to do something about it (Table 1).
In multivariable modeling within each cohort, OR for EDS for each 1-U increment in the racial discrimination scale was 1.48 (95% confidence interval [CI], 1.24–1.78) in Project ACCESS and 1.13 (95% CI, 0.93–1.38) in Project Viva, adjusting for age, marital status, household income, education, nativity, and response to unfair treatment (Table 2). Analysis in the complete case subjects revealed similar findings (data not shown). We detected no interactions between racial discrimination and nativity, income, education, social support, or ethnic identity in predicting EDS in either cohort.
When assessing the differences between the cohorts, we observed a strong interaction between cohort and racial discrimination in predicting EDS. In these analyses, Project ACCESS participants with racial discrimination had much higher odds of EDS than Project Viva participants: OR for Project ACCESS was 1.32 (95% CI, 1.22–1.47) higher per each 1-U increment in racial discrimination. We did not detect interactions between racial discrimination and income or between racial discrimination and education in this combined data set.
In multivariable analyses in the combined data set, the quiet, accept response to unfair treatment conferred greatest odds of EDS (OR, 1.98; 95% CI, 0.74–5.28 compared with the talk, act response) (Fig. 1). Participants who responded by talking with others, either in combination with doing something about it (talk, act, the reference group, OR, 1) or in combination with accepting it (the talk, accept group, OR, 1.02; 95% CI, 0.54–1.14), had the lowest odds of EDS (Fig. 1). There was no significant interaction between response to unfair treatment and cohort or between response to unfair treatment and racial discrimination. For all analyses, use of the alternative EPDS cut point of 15 revealed similar results.
Discussion
The higher prevalence of self-reported racial discrimination in the more affluent Project Viva cohort (78%), compared with the more economically deprived Project ACCESS cohort (54%), is consistent with other literature that has found that self-report of racial discrimination in the U.S. black population is positively associated with economic resources [18,21–23], including among black pregnant women [17,44]. Possible reasons for lower self-report of racial discrimination in groups with fewer socioeconomic resources include (1) internalized oppression, in which black women have taken on the negative views of the dominant culture and thus may be more likely to view unfair treatment as deserved and nondiscriminatory [18] and (2) the inverse relationship between power and social desirability (i.e., the tendency to say what one thinks the other person wants to hear, as opposed to what one truly thinks) [18,22]. Additionally, more educated women may feel more empowered to recognize and name racism and thus may report more discrimination or have a lower threshold for calling an action discrimination. With regard to the outcome, among black women in Project ACCESS, 25% experienced prenatal EDS, which is consistent with the findings from other socioeconomically diverse, urban populations of pregnant women [5,13,45,46]. On the other hand, fewer black women (13%) in Project Viva experienced prenatal EDS, similar to the findings from another predominantly middle-class sample [47].
Self-reported racial discrimination was differentially associated with the risk of EDS in these two cohorts of pregnant black women. Among black women enrolled in Project ACCESS, each increment on the racial discrimination scale conferred a 48% higher odds of EDS. This finding is consistent with other studies among pregnant women [17] and nonpregnant black women [14], and reflects the larger body of literature that finds worse mental health among individuals reporting diverse types of discrimination, including racial discrimination [16,21,24,48,49]. In contrast, among black women enrolled in Project Viva, we observed no increased risk of EDS associated with racial discrimination. These findings suggest that experience of racial discrimination may be a particularly salient social stressor among disadvantaged black women, heightening the risk of depression during pregnancy.
To date, few studies of the relation between discrimination and mental health have examined how this association may vary according to sociodemographic characteristics [19,49,50], although one study found that self-report of lifetime major discrimination increased the risk of depression particularly among men and women with low education and low income [24]. One possible explanation for the findings in our study of lower self-reported racial discrimination, but a greater estimated effect of racial discrimination on depressive symptoms among women with fewer socioeconomic resources, is as follows: self-report measures of racial discrimination by definition reflect what individuals are both willing and able to report [18,19,21–23,28,29,49–51]. If individuals with relatively less power (indicated by lower levels of education and income) were less willing or able to affirm that they had experienced racial discrimination, as has been hypothesized [18,19,21–23,28,29,49–51], the severity of the discrimination reported by persons with fewer resources might be greater. If this were the case, and if severity of discrimination were causally associated with health status, we would expect to observe a greater health impact for a given level of self-reported racial discrimination among the more disadvantaged Project ACCESS participants compared with the Project Viva participants. Additional possible explanations for the observed differences in the association between racial discrimination and EDS in these two cohorts include issues of study design (e.g., smaller sample size in Project Viva) and implementation (e.g., Project Viva enrollment was completed in 2002 and Project ACCESS in 2007), differential distributions of other relevant unmeasured confounders or effect modifiers (e.g., workplace conditions, additional psychosocial stressors, or buffers), ethnic density where participants lived, limitations of self-report measures of racial discrimination, and chance.
In both cohorts, women who spoke with others about their experiences of unfair treatment were least likely to experience EDS. If confirmed in future studies, our findings point to avenues for the prevention of prenatal depression among women who experience racial discrimination through activities to promote more active responses to discrimination, such as programs that encourage women to share their experiences of racial discrimination with others. These programs may be particularly important to vulnerable populations, such as socioeconomically disadvantaged women.
Interpretation of our results should be considered in light of this study’s limitations. As a cross-sectional study, we cannot directly test causal processes. Although it is our hypothesis that racial discrimination leads to prenatal depression, and longitudinal studies provide evidence that self-reported discrimination precedes adverse mental health [16,52], we cannot rule out the possibility that depressed mood may influence reporting of racial discrimination. The use of a validated scale to assess self-reported racial discrimination is a strength of this study, but we are limited in understanding frequency and timing over the lifecourse. In the modified version of EOD used in these cohorts, respondents reported the number of settings in which they experienced discrimination but not the frequency within each setting. However, other research using the frequency questions in EOD has found similar associations even when taking into account frequency [27]. Project Viva and Project ACCESS were designed to be similar and complementary; however, there were some differences in covariates selected and the timing of data collected between the two studies. Because all covariates used in the final models were measured in the same way, it seems unlikely that these covariate differences contributed to our findings. Data for Viva and ACCESS were collected over several years, and it is possible that self-reported EODs may have changed during this period. Future investigations of the association between exposure to racial discrimination and risk of prenatal depression, including possible effect modification by social context, will benefit from careful consideration of the complex issues affecting measurement and interpretation of self-report data on discrimination [18,21–23,48–51]. One potential promising avenue may be to supplement self-reported measures with either implicit measures of racial discrimination [22,51] or measures of brain reactivity to racist stimuli [50].
Notwithstanding these study limitations, this investigation adds to the literature in several important ways. As one of the few studies to examine racial discrimination and prenatal depressive symptoms, we found that the experience of racial discrimination may confer elevated risk of prenatal depressive symptoms among U.S. black women. Owing to the parallel designs of Project ACCESS and Project Viva, we were able to examine associations in two cohorts. Together, these cohorts include awide range of social and economic predictors of prenatal depression, allowing us to examine whether the association of racial discrimination and EDS varied across sociodemographic predictors. This study is among the first to report that response to unfair treatment is associated with EDS in pregnant black women. We used a measure of depressive symptoms validated for the use during pregnancy and a validated measure of racial discrimination [27]. Finally, we performed multiple imputation, which allowed inclusion of all participants and reduces concerns about bias due to missing data [37].
In summary, self-reported racial discrimination was associated with elevated prenatal depressive symptoms during pregnancy among black women in a cohort that enrolled chiefly low-income women, but this association was not evident in a cohort that enrolled more affluent women. In both cohorts, black women who talked with others about their experiences of unfair treatment tended to be less likely to experience prenatal EDS. If replicated, these findings offer a novel intervention approach to reduce the risk of prenatal depression among vulnerable populations by targeting how black women respond to racial discrimination.
References
- 1.Bennett H, Einarson A, Taddio A, Koren G, Einarson TR. Prevalence of depression during pregnancy: systematic review. Obstet Gynecol. 2004;103(4):698–709. doi: 10.1097/01.AOG.0000116689.75396.5f. [DOI] [PubMed] [Google Scholar]
- 2.Gavin N, Gaynes B, Lohr K, Meltzer-Brody S, Gartlehner G, Swinson T. Perinatal depression: a systematic review of prevalence and incidence. Obstet Gynecol. 2005;106(5):1071–83. doi: 10.1097/01.AOG.0000183597.31630.db. [DOI] [PubMed] [Google Scholar]
- 3.Rich-Edwards J, Kleinman K, Abrams A, Harlow BL, McLaughlin TJ, Joffe H, et al. Sociodemographic predictors of antenatal and postpartum depressive symptoms among women in a medical group practice. J Epidemiol Community Health. 2006;60:221–7. doi: 10.1136/jech.2005.039370. [DOI] [PMC free article] [PubMed] [Google Scholar]
- 4.Da Costa D, Larouche J, Dritsa M, Brender W. Psychosocial correlates of prepartum and postpartum depressed mood. J Affect Disord. 2000;59:31–40. doi: 10.1016/s0165-0327(99)00128-7. [DOI] [PubMed] [Google Scholar]
- 5.Hobfoll S, Ritter C, Lavin J, Hulsizer MR, Cameron RP. Depression prevalence and incidence among inner-city pregnant and postpartum women. J Consult Clin Psychol. 1995;63(3):445–53. doi: 10.1037//0022-006x.63.3.445. [DOI] [PubMed] [Google Scholar]
- 6.Field T, Diego M, Hernandez-Reif M. Prenatal depression effects on the fetus and newborn: a review. Infant Behav Dev. 2006;29:445–55. doi: 10.1016/j.infbeh.2006.03.003. [DOI] [PubMed] [Google Scholar]
- 7.Bonari L, Pinto N, Ahn E, Einarson A, Steiner M, Koren G. Perinatal risks of untreated depression during pregnancy. Can J Psychiatry. 2004;49:726–35. doi: 10.1177/070674370404901103. [DOI] [PubMed] [Google Scholar]
- 8.Ertel K, Koenen KC, Rich-Edwards JW, Gillman MW. Antenatal and postpartum depressive symptoms are differentially associated with early childhood weight and adiposity. Paediatr Perinat Epidemiol. 2010;24:179–89. doi: 10.1111/j.1365-3016.2010.01098.x. [DOI] [PMC free article] [PubMed] [Google Scholar]
- 9.Grote N, Bridge JA, Gavin AR, Melville JL, Iyengar S, Katon WJ. A meta-analysis of depression during pregnancy and the risk of preterm birth, low birth weight, and intrauterine growth restriction. Arch Gen Psychiatry. 2010;67(10):1012–24. doi: 10.1001/archgenpsychiatry.2010.111. [DOI] [PMC free article] [PubMed] [Google Scholar]
- 10.Melville J, Gavin A, Guo Y, Fan M, Katon WJ. Depressive disorders during pregnancy: prevalence and risk factors in a large urban sample. Obstet Gynecol. 2010;116(5):1064–70. doi: 10.1097/AOG.0b013e3181f60b0a. [DOI] [PMC free article] [PubMed] [Google Scholar]
- 11.Yonkers K, Wisner KL, Stewart DE, Oberlander TF, Dell DL, Stotland N, et al. The management of depression during pregnancy: a report from the American Psychiatric Association and the American College of Obstetricians and Gynecologists. Obstet Gynecol. 2009;114(3):703–13. doi: 10.1097/AOG.0b013e3181ba0632. [DOI] [PMC free article] [PubMed] [Google Scholar]
- 12.Witt W, DeLeire T, Hagen EW, Wichmann MA, Wisk LE, Spear HA, et al. The prevalence and determinants of antepartum mental health problems among women in the USA: a nationally representative population-based study. Arch Womens Ment Health. 2010;13:425–37. doi: 10.1007/s00737-010-0176-0. [DOI] [PMC free article] [PubMed] [Google Scholar]
- 13.Westdahl C, Milan S, Magriples U, Kershaw TS, Rising SS, Ickovicks JR. Social support and social conflict as predictors of prenatal depression. Obstet Gynecol. 2007;110(1):134–40. doi: 10.1097/01.AOG.0000265352.61822.1b. [DOI] [PMC free article] [PubMed] [Google Scholar]
- 14.McLaughlin K, Hatzenbeuhler ML, Keyes KM. Responses to discrimination and psychiatric disorders among black, Hispanic, and lesbian, gay, and bisexual individuals. Am J Public Health. 2010;100:1477–84. doi: 10.2105/AJPH.2009.181586. [DOI] [PMC free article] [PubMed] [Google Scholar]
- 15.Banks K, Kohn-Wood LP, Spencer M. An examination of the African American experience of everyday discrimination and symptoms of psychological distress. Community Ment Health J. 2006;42(6):555–70. doi: 10.1007/s10597-006-9052-9. [DOI] [PubMed] [Google Scholar]
- 16.Schulz A, Gravlee CC, Williams DR, Israel B, Mentz G, Rowe Z. Discrimination, sypmtoms of depression, and self-rated health among African American women in Detriot: results from a longitudinal analysis. Am J Public Health. 2006;96(7):1265–70. doi: 10.2105/AJPH.2005.064543. [DOI] [PMC free article] [PubMed] [Google Scholar]
- 17.Canady R, Bullen BL, Holzman C, Broman C, Tian Y. Discrimination and symptoms of depression in pregnancy among African American and white women. Womens Health Issues. 2008;18:292–300. doi: 10.1016/j.whi.2008.04.003. [DOI] [PMC free article] [PubMed] [Google Scholar]
- 18.Krieger N. Methods for the scientific study of discrimination and health: from societal injustice to embodied inequality—an ecosocial approach. Am J Public Health. 2012;102:936–45. doi: 10.2105/AJPH.2011.300544. [DOI] [PMC free article] [PubMed] [Google Scholar]
- 19.Brondolo E, ver Halent NB, Pencille M, Beatty D, Contrada RJ. Coping with racism: a selective review of the literature and a theoretical and methodological critique. J Behav Med. 2009;32:64–88. doi: 10.1007/s10865-008-9193-0. [DOI] [PMC free article] [PubMed] [Google Scholar]
- 20.Noh S, Kaspar V. Perceived discrimination and depression: moderating effects of coping, acculturation, and ethnic support. Am J Public Health. 2003;93(2):232–8. doi: 10.2105/ajph.93.2.232. [DOI] [PMC free article] [PubMed] [Google Scholar]
- 21.Paradies Y. A systematic review of empirical research on self-reported racism and health. Int J Epidemiol. 2006;35:888–901. doi: 10.1093/ije/dyl056. [DOI] [PubMed] [Google Scholar]
- 22.Krieger N, Waterman PD, Kosheleva A, Chen JT, Carney DR, Smith KW, et al. Exposing racial discrimination: implicit & explicit measures—the My Body, My Story study of 1005 US-born black & white community health center members. PLoS One. 2011;6(11):e27636. doi: 10.1371/journal.pone.0027636. http://dx.doi.org/10.1371/journal.pone.0027636. [DOI] [PMC free article] [PubMed] [Google Scholar]
- 23.Blank RM, Dabady M, Citro C, editors. Measuring racial discrimination. Washington, DC: National Academy Press; 2004. [Google Scholar]
- 24.Kessler R, Mickelson KD, Williams DR. The prevalence, distribution, and mental health correlates of perceived discrimination in the United States. J Health Soc Behav. 1999;40(3):208–30. [PubMed] [Google Scholar]
- 25.Wright R, Franco Suglia S, Levy JI, Fortun K, Shields A, Subramanian SV, et al. Transdisciplinary research strategies for understanding socially patterned disease: the Asthma Coalition on Community Environment and Social Stress (ACCESS) project as a case study. Cien Saude Colet. 2008;13(6):1729–42. doi: 10.1590/s1413-81232008000600008. [DOI] [PMC free article] [PubMed] [Google Scholar]
- 26.Gillman MW, Rich-Edwards J, Rifas-Shiman SL, Lieberman ES, Kleinman KP, Lipshultz SE. Maternal age and other predictors of newborn blood pressure. J Pediatr. 2004;144:240–5. doi: 10.1016/j.jpeds.2003.10.064. [DOI] [PubMed] [Google Scholar]
- 27.Krieger N, Smith K, Naishadham D, Hartman C, Barbeau EM. Experiences of discrimination: validity and reliability of a self report measure for population health research on racism and health. Soc Sci Med. 2005;61:1576–96. doi: 10.1016/j.socscimed.2005.03.006. [DOI] [PubMed] [Google Scholar]
- 28.Krieger N, Sidney S. Racial discrimination and blood pressure: the CARDIA study of young black and white adults. Am J Public Health. 1996;86:1370–8. doi: 10.2105/ajph.86.10.1370. [DOI] [PMC free article] [PubMed] [Google Scholar]
- 29.Krieger N. Racial and gender discrimination: risk factors for high blood pressure? Soc Sci Med. 1990;30:1273–81. doi: 10.1016/0277-9536(90)90307-e. [DOI] [PubMed] [Google Scholar]
- 30.Cox J, Holden HM, Sagovsky R. Detection of postnatal depression: development of the 10-item Edinburgh Postnatal Depression Scale. Br J Psychiatry. 1987;150:782–6. doi: 10.1192/bjp.150.6.782. [DOI] [PubMed] [Google Scholar]
- 31.Murray D, Cox JL. Screening for depression during pregnancy with the Edinburgh Depression Scale (EPDS) J Reprod Infant Psychol. 1990;8:99–107. [Google Scholar]
- 32.Ertel K, Koenen KC, Rich-Edwards JW, Gillman MW. Maternal depressive symptoms not associated with reduced height in young children in a US prospective cohort study. PLoS One. 2010;5(10):e13656. doi: 10.1371/journal.pone.0013656. [DOI] [PMC free article] [PubMed] [Google Scholar]
- 33.Matthey S, Henshaw C, Elliott S, Barnett B. Variability in use of cut-off scores and formats on the Edinburgh Postnatal Depression Scale—implications for clinical and research practice. Arch Womens Ment Health. 2006;9:309–15. doi: 10.1007/s00737-006-0152-x. [DOI] [PubMed] [Google Scholar]
- 34.Turner R, Grindstaff CF, Phillips N. Social support and outcome in teenage pregnancy. J Health Soc Behav. 1990;31:43–57. [PubMed] [Google Scholar]
- 35.Phinney J. The multigroup ethnic identity measure: a new scale for use with adolescents and youth adults from diverse groups. J Adolesc Res. 1992;7:156–76. [Google Scholar]
- 36.Roberts R, Phinney JS, Masse LC, Chen YR, Roberts CR, Romero A. The structure of ethnic identity of young adolescents from diverse ethnocultural groups. J Early Adolesc. 1999;19(3):301–22. [Google Scholar]
- 37.Little R, Rubin DB. Statistical analysis with missing data. 2nd. New York, NY: John Wiley; 2002. [Google Scholar]
- 38.Rubin D. Inference and missing data. Biometrika. 1976;63:581–90. [Google Scholar]
- 39.Rubin D. Multiple imputation after 18+ years. J Am Stat Assoc. 1996;91:473–89. [Google Scholar]
- 40.Raghunathan T, Solenberger PW, Van Hoewyk J. IVEware: imputation and variance estimation software installation instruction and user guide. Ann Arbor, MI: University of Michigan; 2000. [Google Scholar]
- 41.Raghunathan T, Lepkowskie JM, Van Hoewyk J, Solenberger P. A multivariate technique for multiply imputing missing values using a sequence of regression models. Survey Methodology. 2001;27(1):85–95. [Google Scholar]
- 42.Collins L, Schafer JL, Kam CM. A comparison of inclusive and restrictive strategies in modern missing data procedures. Psychol Methods. 2001;6(4):330–51. [PubMed] [Google Scholar]
- 43.Sterne J, White IR, Carlin JB, Spratt M, Royston P, Kenward MG, et al. Multiple imputation for missing data in epidemiological and clinical research: potential and pitfalls. Br Med J. 2009;338:b2393. doi: 10.1136/bmj.b2393. [DOI] [PMC free article] [PubMed] [Google Scholar]
- 44.Collins K, Westra HA, Dozois DJ. Gaps in accessing treatment for anxiety and depression: challenges for the delivery of care. Clin Psychol Rev. 2004;24(5):583–616. doi: 10.1016/j.cpr.2004.06.001. [DOI] [PubMed] [Google Scholar]
- 45.Bennett I, Culhane JF, Webb DA, Coyne JC, Hogan V, Mathew L, et al. Perceived discrimination and depressive symptoms, smoking, and recent alcohol use in pregnancy. Birth. 2010;37(2):90–7. doi: 10.1111/j.1523-536X.2010.00388.x. [DOI] [PMC free article] [PubMed] [Google Scholar]
- 46.Gotlib I, Whiffen VE, Mount JH, Milne K, Cordy NI. Prevalence rates and demographic characteristics associated with depression in pregnancy and the postpartum. J Consult Clin Psychol. 1989;57(2):269–74. doi: 10.1037//0022-006x.57.2.269. [DOI] [PubMed] [Google Scholar]
- 47.Evans J, Heron J, Francomb H, Oke S, Golding J, ALSPAC Study Team Cohort study of depressed mood during pregnancy and after childbirth. Br Med J. 2001;323:257–60. doi: 10.1136/bmj.323.7307.257. [DOI] [PMC free article] [PubMed] [Google Scholar]
- 48.Pascoe E, Richman LS. Perceived discrimination and health: a meta-analytic review. Psychol Bull. 2009;135(4):531–54. doi: 10.1037/a0016059. [DOI] [PMC free article] [PubMed] [Google Scholar]
- 49.Williams D, Mohammed SA. Discrimination and racial disparities in health: evidence and needed research. J Behav Med. 2009;32:20–47. doi: 10.1007/s10865-008-9185-0. [DOI] [PMC free article] [PubMed] [Google Scholar]
- 50.Mays VM, Cochran S, Barnes NW. Race, race-based discrimination, and health outcomes among African Americans. Annu Rev Psychol. 2007;58:201–25. doi: 10.1146/annurev.psych.57.102904.190212. [DOI] [PMC free article] [PubMed] [Google Scholar]
- 51.Carney D, Banaji MR, Krieger N. Implicit measures reveal evidence of personal discrimination. Self Identity. 2010;9:162–76. [Google Scholar]
- 52.Brown T, Williams DR, Jackson JS, Neighbors HW, Torres M, Sellers SL, et al. “Being black and feeling blue”: the mental health consequences of racial discrimination. RaceSoc. 2000;2:117–31. [Google Scholar]