Abstract
Subcutaneous administration of biologics is highly desirable; however, incomplete bioavailability after sc administration remains a major challenge. In this work we investigated the effects of excipient dependent hyper-osmolarity on lymphatic uptake and plasma exposure of rituximab as a model protein. Using Swiss Webster (SW) mice as our animal model, we compared the effects of NaCl, mannitol and, O-Phospho-L-Serine (OPLS) on plasma concentration of rituximab over 5 days after sc administration. We observed an increase in plasma concentrations in animals administered rituximab in hypertonic buffer solutions, as compared to isotonic buffer. Bioavailability, as estimated by our pharmacokinetic model, increased from 29% in isotonic buffer to 54% in hypertonic buffer containing NaCl, to almost complete bioavailability in hypertonic buffers containing high dose OPLS or mannitol. This improvement in plasma exposure is due to improved lymphatic trafficking as evident from the increase in the fraction of dose trafficked through the lymph node in the presence of hypertonic buffers. The fraction of the dose trafficked through the lymphatic, as estimated by the model, increased from 0.05 % in isotonic buffer to 13% in hyper-tonic buffer containing NaCl to about 30% for hypertonic buffers containing high dose OPLS and mannitol. Our data suggests that hypertonic solutions may be a viable option to improve sc bioavailability.
Keywords: Biologics, O-Phospho-L-Serine (OPLS), mannitol, osmolarity, lymphatic uptake
1. Introduction
Incomplete bioavailability of large biologics after subcutaneous (sc) administration is a major challenge. Incomplete bioavailability can be attributed to: i) restrictive movement of macromolecules through the extracellular matrix [1]. ii) pre-systemic degradation by proteiolytic enzymes in the extracellular matrix [2, 3], and iii) saturable uptake by active transporters such as FcRn in the case of monoclonal antibodies (mABs) [3–6]. Improving lymphatic uptake of biologics after sc administration can help resolve some of these issues. Rapid and effective trafficking of the drug by the lymphatic system can reduce its residence time, which in turn reduces pre-systemic degradation. Also, siphoning the drug through the lymphatic’s can alleviate the pressure on active transporters, such as FcRn.
Factors that influence lymphatic uptake include formulation properties, which have been recognized and reviewed elsewhere [2, 7]. Exploiting those properties to improve lymphatic uptake, however, has not been explored enough. In 1986 Bocci et al reported on the use of albumin to improve lymphatic uptake of recombinant human interferon-α2 as well as interferon-β after sc administration [8, 9]. Albumin was proposed to act as a “volume expander”. By altering the oncotic pressure in the extracellular matrix, it can prevent fluid reabsorption at the post capillary beds increasing the interstitial volume [8–10]. This results in increased lymph flow [1, 10–12]. Similarly, we hypothesize that hypertonic buffers could help improve the lymphatic uptake of biologics after sc administration by acting as volume expanders in the extracellular matrix.
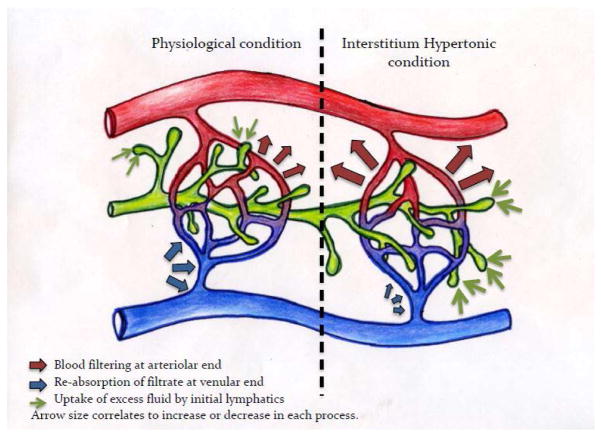
Hypertonicity is expected to alter the osmotic, rather than the oncotic, conditions in the interstitial milieu. This prevents fluid reabsorption from the sc space[10]. In pathological condition this can cause edema. Under healthy conditions, however, edema is prevented by active and passive controls that maintain fluid homeostasis in the interstitium. For example, shear stress generated by volume expansion will trigger Nitric Oxide release by glycocalyx matrix which improves permeability [10]. The physical coupling of the initial lymphatics to the extracellular matrix, on the other hand, ensures the expansion of the initial lymphatics, in response to volume expansion, to improve drainage [10, 12]. The drainage of the excess fluid volume by the lymphatic system increases the bulk movement of the fluids through the extra cellular matrix. This facilitates the convective movement of the biologics through the matrix. This is especially important for biologics in the size range of 10 – 200 kDa [13]. In this size range it is believed that convection dominates the movement of solute in the sc space[13]. Figure 1 illustrates the interstitium fluid formation and drainage at physiological conditions as well as the proposed changes due to hypertonic buffers.
Figure 1.
Illustration of the proposed physiological changes in the sc space in response to hypertonic buffers. Left side represents normal physiological conditions. Oncotic/osmotic forces in the sc space favor blood filtration at the arteriolar end of the capillary bed (red arrows), as blood flows to the venular end of the capillary bed, oncotic forces within the blood capillaries favors reabsorption of filtrate (blue arrows). Excess fluid will be taken up by the initial lymphatic to maintain fluid homeostasis. Right side represents the proposed changes to this process in response to hypertonic buffers. The increased interstitial osmolarity will result in increased blood filtration at the arteriolar end (large red arrows) while hindering reabsorption at the venular end (small blue arrow). The excess volume will be removed by the initial lymphatic (large green arrow) to maintain fluid homeostasis in the intestinal space.
We propose that the effects of hypertonic buffers, as described above dependent on the buffer composition with excipients that are cleared rapidly from the injection site being less effective. To test this hypothesis, we generated hypertonic buffer systems using three different excipients: NaCl, mannitol and O-Phospho-L-Serine (OPLS). NaCl was chosen as a generic salt to manipulate osmolarity. Mannitol is a common GRAS (Generally Regarded as Safe) excipient used in protein formulations. OPLS is the head group of the immune-modulatory lipid Phosphatidylserine (PS). OPLS has been studied extensively in our laboratory and shows promise as a novel adjuvant that can reduce the immunogenicity of biologics such as FVIII in our in vivo model systems [14–16]. All three excipients are highly soluble in aqueous media. We tested the effects of these buffers on rituximab pharmacokinetics after sc administration in Swiss Webster mice. Our data suggest that hypertonic buffers improved lymph node uptake. Furthermore, OPLS and mannitol performed better that osmolarity-matched buffer containing NaCl only. This translated to increase in plasma exposure of rituximab compared to isotonic buffer as well as osmolarity-matched buffer containing NaCl only.
2. Material and Methods
2.1 Animals
Swiss Webster mice (19–22 g) (SW) were from Charles River Laboratories (Wilmington, MA). All animal experiments were conducted in accordance with guidelines established by Institutional Animal Care and Use Care Committee (IACUC) at the University at Buffalo, State University of New York.
2.2 Materials
Commercial preparation of rituximab (RXT) was gift from Dr. Steven Bernstein of the University of Rochester Medical Center. Rat anti-rituximab antibody was purchased from AbD Serotec (Raleigh, NC). Goat anti-mouse FC-specific HRP conjugated antibody, 3,3′5,5′ tetramethyl benzidine (TMB) substrate system, Bovine serum albumin (BSA), O-Phospho-L-Serine (OPLS) and mannitol were purchased from Sigma (St. Louis, MO). All other solvents and buffer salts were obtained from Fisher Scientific (Fairlawn, NJ) or from Sigma (St. Louis, MO).
2.3 Preparation and characterization of injection buffers
One isotonic and six different hypertonic TRIS buffers were prepared to investigate the effects of hypertonicity and buffer composition on rituximab lymphatic uptake and plasma exposure (table 1.). Isotonic TRIS buffer was prepared using 25 mM TRIS and 150 mM NaCl (buffer A). Hypertonic (600 mmol/kg) TRIS buffers were prepared with 25 mM of TRIS containing 300 mM NaCl (buffer B). Buffers “C” and “E” contained NaCl as well as 20 mM of OPLS or Mannitol. To further delineate the effects of buffer composition on lymphatic uptake, we prepared two buffers at 600 mmol/kg with a 270 mM of OPLS (Buffer D) or mannitol (Buffer F). Since osmolarity of these buffers is the same as buffers “C” and “E”, any changes in lymphatic uptake will be attributed to increase in OPLS and mannitol concentrations. pH was adjusted to 7.5. Osmolarity was measured using a 5500 Vapor Pressure Osmometer (Wescore Inc. Logen UT, USA) according to manufacture’s instruction.
Table 1.
Composition of the six hypertonic TRIS buffer systems used in the study.
| Buffer | Composition
|
|||||
|---|---|---|---|---|---|---|
| Tris mM | NaCl mM | OPLS mM | mannitol mM | pH | Osmolarity mmol/kg | |
| A | 25 | 150 | - | - | 7.5 | 300 |
| B | 25 | 300 | - | - | 7.5 | 600 |
| C | 25 | 300 | 20 | - | 7.5 | 600 |
| D | 25 | 300 | - | 20 | 7.5 | 600 |
| E | 25 | 150 | 270 | - | 7.5 | 600 |
| F | 25 | 150 | - | 270 | 7.5 | 600 |
2.4 Rituximab pharmacokinetics studies
126 male SW mice were divided into 7 groups. Each group consisted of 18 animals, three for each time point of the PK profile. Each animal was given 1ug/g RXT formulated in one of the formulations described above (table 1). All sc injections were in the abdominal region equidistant from the inguinal lymph node. Since absorption is expected to be complete by day 5, the following preset time points 1, 5, 15, 24, 48, and 120 hr were chosen for sacrifice and sample collection. Total blood and both inguinal lymph nodes were collected. The disposition of RXT will be determined from the iv PK profile. Rituximab disposition will be and convoluted with the absorption data generated from the sc studies. For iv PK study, animals were given 1ug/g RXT in base buffer (buffer A) via the penile vein. Total blood was collected at the following times points: 0.5, 2, 15, 24, 48, and 120 hr. Blood was centrifuged at 7500 rpm for 5 min at 4 degrees Celsius. All samples were stored at −80 degrees Celsius until analyses. The inguinal lymph nodes were homogenized in 300 μl of PBS on ice immediately before analysis.
2.5 Analysis of RXT in plasma and lymph node samples
Analysis of plasma and lymph node samples from PK studies was done with a standard ELISA. Briefly Nunc-Maxisorb 96-well plates were coated overnight at 4°C with 100 μl/well of 1 μg/ml anti-RXT antibody (AbD Serotec Raleigh, NC). Plates were then washed and blocked with 1% bovine serum albumin (blocking buffer). Samples were diluted as needed to a final dilution of 1:100 or 1:1000 in blocking buffer and added to the plate. A serial dilution of RXT in blocking buffer also added to the plate for the standard (calibration) curve, which was fitted to four-parameter logistic equation. 100 μl of goat anti-human-HRP conjugate antibody at a 5ug/ml was used as a detection anti-body. Color was developed for 20 min with 100 μl of TMB solution. 50 ul of 2 N H2SO4 was used to stop the reaction. Optical density at 450 nm was measured using a plate reader. The working range of the assay was between 0.25 and 62.5 ng/mL.
2.6 Compartmental analysis and pharmacokinetic modeling
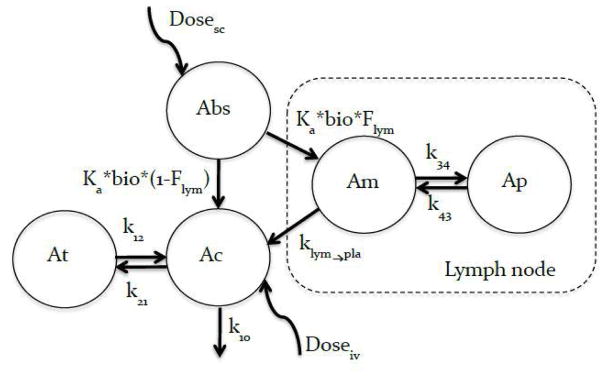
Due to the buffering capacity of the blood, we do not expect hyper-tonicity of the injection buffer to effect the disposition of rituximab after iv administration, hence iv data was obtained for the base buffer only (buffer A). Furthermore, we expect rituximab, administered sc, in different hypertonic buffers to have the same disposition as rituximab administered iv in base buffer once the drug reaches systemic circulation. Based on this we used the disposition data from iv studies to inform the disposition of rituximab after sc administration. This allowed us to estimate the following parameter using our model: i) rate of uptake ka, ii) fraction of dose entering the lymphatic (Flym), iii) fraction of dose entering systemic circulation (1− Flym) and iv) bioavailability (bio) based on the model shown in figure 2.
Figure 2.
Pharmacokinetic model for rituximab after sc and iv administration. A 2-compartment model was used to fit the iv data. Vc, k10, k12, and k21, are the volume of the central compartment, elimination rate constant from the central compartment and first-order distribution rate constant between the central and peripheral compartments respectively. The sc data was modeled with an absorption compartment (Abs) representing the injection site, the drug exits the absorption compartment at a rate ka, a faction of the dose (Flym) enters trough the inguinal lymph node while the remainder (1 − Flym) enters directly into systemic circulation. Bioavailability (bio) acts on the drug in the absorption compartment. The lymph node is modeled as a 2-compartment model to account for the retention capacity of the lymph node; Vlym, klym→pla, k34, and k43 are the volume of the main lymph compartment, elimination rate constant from the main lymph compartment to the central compartment, and first-order distribution rate constant between the main and second compartments respectively. The retention capacity of the lymph node is reduced (resistance to flow is reduced) as the volume of afferent lymph increase. This was captured by using 2 different values for K43 one for buffers B and C and a different value for buffer D, E and F. The disposition of rituximab once the drug reaches systemic circulation is informed by the iv data.
First, iv data was fitted to a 2-compartment model, which generated parameter estimates for volume of the central compartment (V), rate of elimination K10, and first-order distribution rate constants k12 and k21. Following are the differential equations used to model the iv data:
To model the sc data, an absorption compartment (Abs) was used to deposit the dose, bioavailability acts on this compartment, and the rate of release from this compartment is Ka. The fraction of the drug delivered to systemic circulation via the lymphatic system is determined by (Flym), while the fraction entering systemic circulation directly is given by (1− Flym) similar approaches have been used to estimate the lymph node uptake of fluorescently labeled antibodies after sc administration in mice [17]. To account for the expansion and retention ability of the lymph node, a second compartment is added to the main lymph node compartment.
Initially all disposition parameters were fixed to the values obtained from iv fitting. Once absorption parameters were reasonably estimated, all model parameters were estimated. The new disposition parameters obtained from the simultaneous iv and sc fitting were then fixed along with lymph node disposition parameters (Vlym, klym→pla, k34, and k43) and final estimates for ka, bio, and Flym were obtained. Figure 2 is the schematic representation of the model, differential equation are presented below:
Modeling was done using Phoenix WinNonlin 6.1 software (Pharsight Corporation, Mountain View, CA). Table 2 provides definitions for all terms used in the modeling equations.
Table 2.
List of all terms used in modeling the data and their meanings
| Term | Description |
|---|---|
| Bio | Bioavailability |
| Flym | Fraction of the dose trafficked through the lymph node |
| 1−Flym | Remained of the dose entering via direct uptake |
| ka | First order rate of loss from the absorption compartment |
| k10 | First order elimination rate constant |
| k12 | First order inter-compartmental clearance (distribution from central compartment to second compartment) |
| k21 | First order inter compartmental clearance (distribution from second compartment to central compartment) |
| Vc | Volume of the central compartment |
| Vlym | Volume of the main lymph node compartment |
| K34 | First order distribution rate to the secondary lymph node compartment |
| k43 | First order distribution rate back to the main lymph node compartment. |
| klym→pla | First order elimination rate constant from the main lymph compartment to the central compartment |
3. Results
3.1 Pharmacokinetics of rituximab in SW mice after iv and sc administration
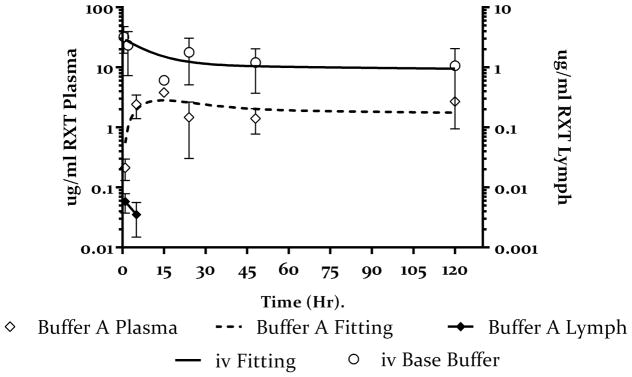
The plasma concentration-time profile of rituximab after iv and sc administration of a 1ug/g dose in isotonic buffer A is shown in figure 3. Data was fitted to the model shown in figure 2. Table 3 shows estimates of pharmacokinetic parameters obtained from fitting the data. Disposition parameters were well estimated from the iv data as shown in the table. Based on model estimates the sc bioavailability of rituximab in Buffer A is 0.29 (29%). The fraction of the dose taken up by the lymph nodes is estimated at 0.05 (5% of the total absorbed dose)
Figure 3.
Plasma (open symbols) and lymph node (closed symbols) concentration-time profile of rituximab after iv (open circles) and sc (open diamonds) administration in SW mice. 1ug/g rituximab was injected sc or iv and the plasma concentrations were monitored for 120 hours. The sold line represents the fitting of the iv data to a 2 compartment model and the dashed line represent the fitting of the sc data to the PK model in figure 2. The closed diamonds represents inguinal lymph node concentration of rituximab after sc administration. Values presented as mean ± SD.
Table 3.
Pharmacokinetic parameters obtained by model fitting. Disposition obtained from iv data was first estimated for all data sets and then fixed. Every other parameter was estimated. %CV represents the confidence in parameter estimate.
| Parameter | sc | iv | |||||||||||||
|---|---|---|---|---|---|---|---|---|---|---|---|---|---|---|---|
| A | B | C | D | E | F | A | |||||||||
| mean | %cv | mean | %cv | mean | %cv | mean | %cv | mean | %cv | mean | %cv | mean | %cv | ||
| Bio | - | 0.29 | 41 | 0.54 | 18 | 0.81 | 23 | 0.99 | 17 | 0.99 | 21 | 0.99 | 17 | NA | |
| Flym | - | 0.05 | 78 | 0.13 | 19 | 0.11 | 19 | 0.28 | 17 | 0.32 | 17 | 0.31 | 17 | ||
| ka | hr−1 | 0.03 | 49 | 0.06 | 27 | 0.03 | 30 | 0.07 | 28 | 0.03 | 26 | 0.08 | 27 | ||
| k10 | hr−1 | Fixed to iv value | 0.0031 | 66 | |||||||||||
| k12 | hr−1 | 0.06 | 16 | ||||||||||||
| k21 | hr−1 | 0.04 | 21 | ||||||||||||
| Vc | ml/g | 0.04 | 8 | ||||||||||||
| Vlym | ml/g | 0.57 (%cv = 15) | NA | ||||||||||||
| k34 | hr−1 | 0.14 (%cv = 32) | |||||||||||||
| k43 | hr−1 | 0.015 (%cv = 68) | 0.12 (%cv = 73) | ||||||||||||
| klym→pla | hr−1 | 0.025 (%cv = 23) | |||||||||||||
3.2 Effect of hypertonic buffer composition on lymphatic uptake of rituximab
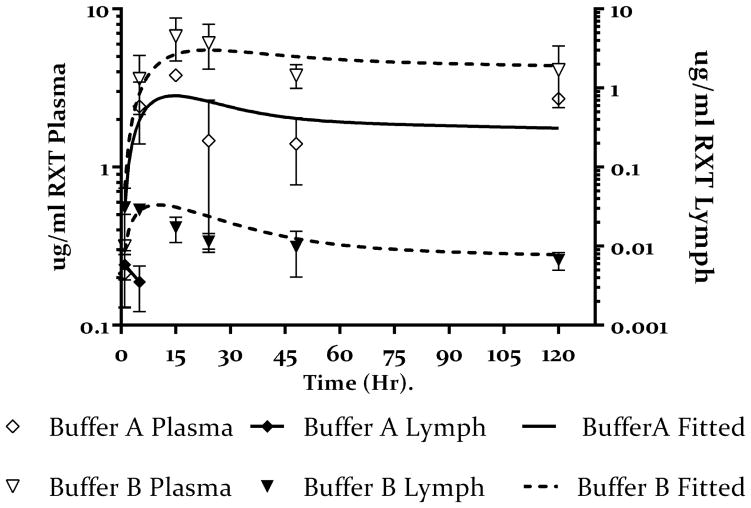
Hypertonic buffers are expected to alter the osmolarity of sc space resulting in increased interstitial fluid formation; the excess fluid is then drained by the initial lymphatics resulting in increased bulk movement of the administered drug. We proposed that this is dependent on buffer composition. To elucidate the effects of hypertonic buffer on lymphatic uptake we compared the concentration of rituximab in excised inguinal lymph nodes after sc administration of 1ug/g of rituximab in isotonic buffer (Buffer A) and hypertonic buffer (Buffer B) in SW mice. As shown in figure 4, we observed an increase in lymph node concentration of rituximab administered in the hypertonic buffer B as compared to Buffer A. rituximab was recovered from the lymph nodes of animals in the first 2 time points in Buffer A group. The amount of rituximab in the lymph nodes of animals in the remaining time points was below the limit of detection of our ELISA. However, all animals in buffer B group had rituximab in their lymph nodes over the entire course of the study. Fitting the data to our PK model gave an estimate of the fraction of the dose trafficked through the lymph node showing an increase from 0.05 in buffer A to 0.13 for buffer B (Table 3).
Figure 4.
Plasma (open symbols) and lymph node (closed symbols) concentration-time profile of rituximab administered sc in isotonic buffer (buffer A open diamonds) and hypertonic buffer (buffer B open inverted triangle). Lymph node concentration of rituximab administered sc in isotonic buffer (buffer A closed diamonds) and hypertonic buffer (buffer B closed inverted triangles). Values presented as mean ± SD. The solid lines represent the fitting of the data to the model shown in figure 2. This data show increase plasma and lymph node exposure after sc administration of rituximab in hypertonic buffer as compared to isotonic buffer.
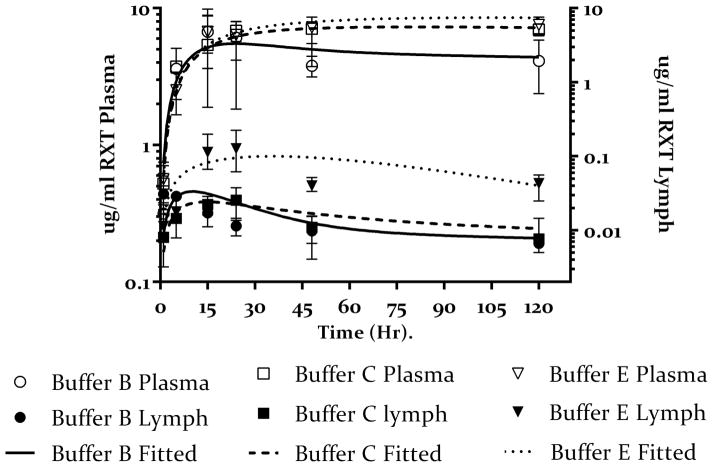
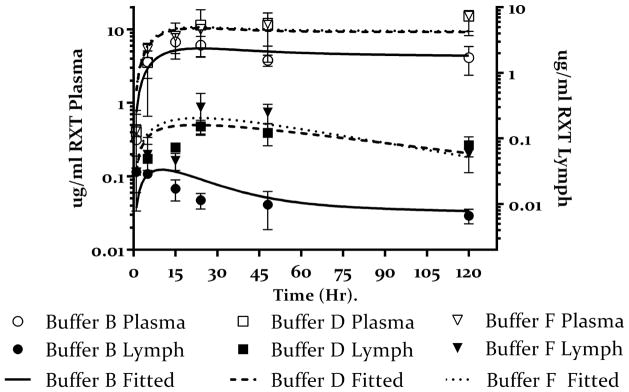
To further delineate the effect of hypertonic buffer composition on lymphatic uptake, we compared lymph-node concentration of rituximab administered in the remaining 5 buffers in table 1 to the results obtained from buffer B. As shown in Figure 5A there is no substantial increase in lymph node concentration of rituximab administered in 20 mM OPLS hypertonic buffer (buffer C) as compared to buffer B, however, 270 mM OPLS (buffer E) resulted in an increase in lymph node concentration as compared to buffers B and C. The PK model estimated that both buffers B and C had comparable Flym values (0.13 and 0.11 respectively), which was lower than the Flym value estimated for buffer E (0.28) (Table 3). Since the osmolarity in all three buffers is the same (600 mOsmol) the resulting increase in the fraction of the dose taken up by the lymph nodes, and the resulting increase in lymph node concentration, could be attributed to increased OPLS concentration in buffer E vs B and C.
Figure 5.
Plasma (open symbols) and lymph node (closed symbols) concentration-time profile of rituximab administered sc in different hypertonic buffers.
5.A Buffers C and E represent low and high dose of OPLS (20 mM open box) and 270 mM (open inverted triangle) as compared to hypertonic buffer containing NaCl only (buffer B open circles), with corresponding lymph node concentrations of rituximab for buffers C and E (closed box and closed inverted triangle respectively) as compared to hypertonic buffer containing NaCl only (buffer B closed circles). Values presented as mean ± SD. The solid lines represent the fitting of the data to the model shown in figure 2. The data shows increase plasma concentration for rituximab administered with OPLS in a dose depended manner. This also corresponds to increase lymph node exposure especially for buffer E. Model predicts almost complete bioavailability for buffer E.
5.B Buffers D and F represent low and high dose of mannitol (20 mM open box) and 270 mM (open inverted triangle) as compared to hypertonic buffer containing NaCl only (buffer B open circles) with corresponding lymph node concentrations of rituximab for buffers D and F (closed box and closed inverted triangle respectively) as compared to hypertonic buffer containing NaCl only (buffer B closed circles). Values presented as mean ± SD. The solid lines represent the fitting of the data to the model shown in figure 2. The data shows increase plasma concentration for rituximab administered with Mannitol. This also corresponds to increase lymph node exposure. Model predicts almost complete bioavailability for buffers D and F.
Interestingly, when mannitol was used (buffers D and F), we observed an increase in lymph node concentration of rituximab administered in either mannitol-containing buffer as compared to mannitol-free buffer B (figure 5B). Unlike OPLS, this increase was independent of manntiol dose. The model estimated the fraction of the dose taken up by the lymph nodes to be comparable in both buffers D and F (0.32 and 0.31 respectively)(table 3); this was also comparable to the estimate obtained for the high dose OPLS (buffer E). This data further supports the notion that buffer composition plays a role in lymph node uptake since osmolarity was held constant in all three buffers.
Another interesting observation is the need for 2 unique k43 values for the disposition of lymph node data depending on the buffers. The ability of the lymph node to expand and retain excess volume was model with a secondary compartment, The volume of the main compartment (Vlym), rate of clearance from the main compartment into systemic circulation klym→pla and the first-order rate of distribution into the second lymph node compartment k34 are the same for all buffers, however, the rate of distribution from the second lymph node compartment to the main lymph node compartmented k43 was unique for each buffer. This is justified since the ability of the lymph node to resist flow (retain volume) changes as a function of efferent lymph flow (see discussion). Interestingly, the model estimated a k43 value that was comparable for both buffer B and C (0.015 and 0.016 respectively), and similarly for buffer D, E and F the k43 values were comparable (0.12, 0.11 and 0.20 respectively). As a result in the final model we found only 2 “k43” values are needed, one to describe the data from buffers B and C and another to describe the data form buffers D, E and F.
3.4 Effect of hypertonic buffer composition on rituximab plasma concentrations and bioavailability
To investigate whether improved lymphatic uptake would translate to improved bioavailability of rituximab, plasma samples were analyzed to determine rituximab concentrations and then modeled as above. As shown in figure 3, we observed an increase in the plasma concentration of rituximab administered in the hypertonic buffer B as compared to the isotonic buffer A. The mode estimated the bioavailability of rituximab after sc administration in buffer B at 0.54 (54%) compared to 0.29 for buffer A (table 3). Next we compared the effect of buffer composition on bioavailability and plasma exposure by comparing plasma concentration time profile of rituximab administered in the remaining 5 buffers to that of buffer B. Figure 5A shows the results obtained from OPLS-containing buffers (C and E). The data shows increased rituximab plasma concentration for both buffers as compared to buffer B especially at later time points. The model estimated the bioavailability of rituximab in buffer C and E at 0.81 and 0.99 respectively (table 3). Similarly, mannitol-containing buffers D and F resulted in higher rituximab plasma concentration as compared to buffer B. Model estimated almost complete bioavailability of rituximab in buffers D and E (table 3).
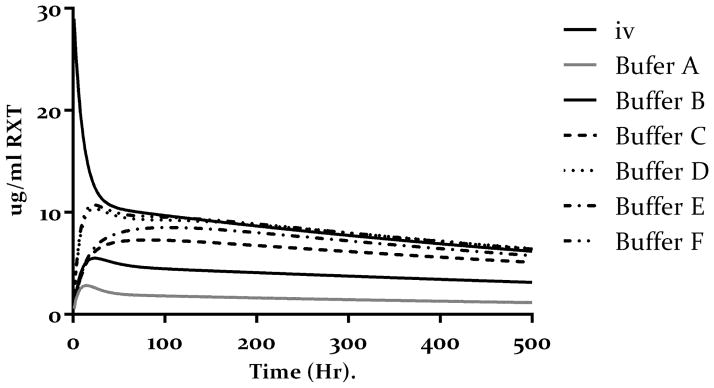
Bioavailability of rituximab was also calculated from the ratio of AUCs. Using the PK parameters obtained from simultaneous fitting of all the data as reported in table 2. We simulated the 20-day sc PK profiles of 1ug/g dose of rituximab in each buffer and compared it to the AUC obtained from a simulated 20-day iv profile of 1 ug/g rituximab. Results are reposted in table 4. Overall hypertonic buffers resulted in higher rituximab bioavailability as compared to the isotonic buffer. Furthermore, the buffer composition affected the bioavailability of rituximab with mannitol showing superior performance as compared to other hypertonic buffers.
Table 4.
Comparison between bioavailability obtained by model fitting as reported in table 3 and bioavailability obtained from ratio of AUC generated by simulating 1ug/g dose of rituximab in each of the 6 buffers using the model estimates reported in table 1.
| Buffer | ||||||
|---|---|---|---|---|---|---|
| Bio | A | B | C | D | E | F |
| Model estimate | 0.29 | 0.54 | 0.81 | 0.99 | 0.99 | 0.99 |
| Ratio of AUC | 0.18 | 0.46 | 0.72 | 0.95 | 0.83 | 0.96 |
4. Discussion
In this work we investigated the effects of hypertonic buffers and their composition on lymphatic uptake and plasma exposure of rituximab after sc administration. Our data shows that lymphatic uptake was improved when rituximab was administered in hypertonic (600 mmol/Kg) buffers. Furthermore, the composition of the buffer played a role in lymphatic uptake. Mannitol and OPLS performed better than osmolarity-matched buffers containing NaCl alone. The improved lymphatic uptake was closely correlated with improved plasma exposure and improved bioavailability of rituximab as shown by model fitting (Table 3). As the fraction of the dose taken up by the lymph nodes increased from 0.05 for buffer A to >0.28 for buffers D, E and F, the bioavailability also increased from 0.29 (buffer A) to almost complete for Buffer D, E and F.
We propose that hypertonic buffers in the sc space could alter the environment in the interstitial milieu. This environment is the driving force behind the formation of interstitial fluid. Under normal conditions the blood filters through the arteriolar end of the capillary bed[10], a process driven by the increased hydrostatic pressure[11] at that end as compared to the venular end of the capillaries[10]. Downstream of the capillaries, the increased oncotic pressure within the blood capillaries, favors the re-absorption of the filtrate back into blood carrying with it waste and byproducts from the tissue[10]. Hyper-osmolarity in the interstitium, caused by hypertonic buffers, is expected to alter the osmotic conditions in the interstitial milieu increasing the interstitial volume and resulting in increased lymphatic drainage.
Based on this physiology, we expect the effects of volume expansion by hypertonic buffers in the sc space to last until osmolarity is restored. This could depend on the composition of the buffer. Indeed, our data shows a clear advantage to mannitol and high dose OPLS over NaCl alone. This can be attributed to the rapid redistribution of sodium and chloride ions after injection as compared to mannitol and OPLS. Ions such as sodium and chloride diffuse rapidly down their electrochemical gradient[18]. Ion channels are 105 times faster than the fastest transporter, this allows 100 million ions to pass through a single channel in one second[18]. This redistribution of ions can rapidly neutralize their osmolarity effects. However, mannitol and OPLS are non-permeable, and depend on transporters, if any, to redistribute into surrounding cells. This is a slow process as compared to ion uptake. Their prolonged presence in the extra-cellular matrix should force an increase in interstitium fluid formation and an increase in lymph drainage until isotonicity is reached.
Despite the similar proposed mode of action of mannitol and OPLS, we observed differences in the lymph node profile of rituximab in the presence of 20 mM mannitol vs. 20 mM OPLS (Figures 5 A and B). Rituximab had higher lymph exposure in the presence of mannitol as compared to OPLS (Table 3). Furthermore, the overall shape of the curve was different. In the presence of OPLS, rituximab lymph concentration peaked at 24 hours, while this peak was not seen with Mannitol. A more continuous uptake with a less pronounced peak was observed instead.
The observed differences in lymphatic uptake and bioavailability between OPLS and mannitol containing buffers at equal concentration (20 mM, buffers C and D) could be an effect of charge. OPLS carries negative charge at physiological pH [19]. This can create electrostatic repulsion with the negative charge in the interstitial space, which is maintained by glycosaminoglycans [1, 10]. This can enhance the clearance of OPLS from sc space restoring physiological osmolarity and neutralizing the effects of OPLS faster than Mannitol, which is neutral at physiological pH [20]. Mannitol is expected to clear slower than OPLS, due to its neutrality, thus exerting its effects longer in the extracellular space. This type of charge-charge interaction has been reported elsewhere: for example, liposomes containing phosphatidylserine (PS), the parent compound of OPLS, have been reported to reach the afferent lymph node faster than neutral phosphatidylcholine (PC) containing liposomes [21].
Finally the model’s tendency to estimate 2 different values of k43 for buffers B and C vs buffers D, E and F can be explained by the tendency of the lymph node to lose its retention capacity in response to increase afferent volume flow. Physiologically, the lymph nodes present high resistance to flow [22–24]. This results in the retention of fluid in the lymph node; this is predicted by the PK model for buffers B and C as evident from the low K43 values for those 2 buffers (table 2). As the lymph node swells to accommodate further increase in afferent lymph flow it will lose its resistance to flow (ie loses retention capacity) [22–24]. This is captured by the increase in the value of k43 for buffers D, E and F. The estimated k43 for those buffers was one fold higher than the value estimated for buffers B and C.
Taken together, our data and model fitting suggests that hyper-osmolarity can improve bioavailability of rituximab by improving lymphatic trafficking. Furthermore, non-permeable excipients such as mannitol and OPLS are superior to ions and can be a viable method to improve sc absorption of larger biologics. This underlying mechanism of volume expansion and the resulting enhanced lymph drainage should be injection site independent. However, other aspects of injection site, such as the difference in the density of initial lymphatic or cyclical motion of the surrounding tissue, which are known to alter the lymph flow, could play a role in enhancing or dampening the effects of the hypertonic buffers. This should be be investigated further.
Limiting factors for the application of this method would be regulatory and patient comfort related. However, to our knowledge, no FDA recommendation for upper limit of osmolality of sc formulation exists. Furthermore, literature reports injecting hyperosmolar solutions up to 1100 mmol/Kg im [25] and sc [26] in human subjects with minimal pain and discomfort [25, 26]. Others have reported sc tissue damage occurring in animal models only when injected with super hyper-osmolar solution (1300 mmol/kg) [27]. In our own experience, we did not observed obvious sings of edema or rash at the injection site of animals used for this study. Furthermore, in a separate study, 28 daily administrations of 250 mM OPLS injected sc in mice did not result in any tissue damage based on histological examination of the injection site tissue at the end of the study (data to be published as part of a comprehensive toxicological study of OPLS in mice). Finally, some marketed biologics for sc and im administration such as Hizentra (sc), Vivaglobin (sc) and PENTAVAC (im) are hyper-osmolar (380 mmol/kg, 445 mmol/kg and, 850 mmol/kg respectively)[28]. This indicates that a hyper-osmolar sc formulation is feasible both from regulatory and patient comfort standpoint.
One caveat, however, is that increased lymphatic trafficking could lead to increased immunological exposure. The lymphatics are rich in professional antigen presenting cells such as macrophages and lymph node resident dendritic cells [29, 30]. For this reason we argue that OPLS may be superior to mannitol as an excipient. Published data generated in our lab [14–16] shows that OPLS may have the added benefits of reducing immunogenicity toward biologics such as FVIII. This makes OPLS a multifunctional excipient that can address two of the major issues facing sc administration of biologics, poor bioavailability and increased risk of immunogenicity.
Conclusion
Non-permeable soluble excipients such as mannitol and OPLS can improve lymphatic uptake of sc-injected protein therapeutics. This can translate to improved bioavailability and increased plasma exposure as predicted by our PK model. The mode of action is thought to be interstitial volume expansion in the sc space. We argue that OPLS may be a superior excipient to mannitol due to its immunomodulatory properties discussed elsewhere [14–16].
Figure 6.
Simulation of plasma profile of 1ug/g dose of rituximab iv or sc after 20 days in each of the six buffer in table 1. The simulated is based on the model presented in figure 2 and the model parameter in table 3.
Acknowledgments
This work was supported by a grant from the National Institutes of Health (R01 HL-70227) to Dr. Balu-Iyer. The authors thank Pharmaceutical Sciences Instrumentation facility, University at Buffalo, State University of New York, for the use of the shared microplate reader.
References
- 1.Swartz MA. The physiology of the lymphatic system. Advanced Drug Delivery Reviews. 2001;50:3–20. doi: 10.1016/s0169-409x(01)00150-8. http://dx.doi.org/10.1016/S0169-409X(01)00150-8. [DOI] [PubMed] [Google Scholar]
- 2.Richter WF, Bhansali SG, Morris ME. Mechanistic determinants of biotherapeutics absorption following SC administration. Aaps J. 2012;14:559–70. doi: 10.1208/s12248-012-9367-0. [DOI] [PMC free article] [PubMed] [Google Scholar]
- 3.Kagan L, Turner MR, Balu-Iyer SV, Mager DE. Subcutaneous absorption of monoclonal antibodies: role of dose, site of injection, and injection volume on rituximab pharmacokinetics in rats. Pharm Res. 2012;29:9. doi: 10.1007/s11095-011-0578-3. [DOI] [PubMed] [Google Scholar]
- 4.Wang W, Wang EQ, Balthasar JP. Monoclonal antibody pharmacokinetics and pharmacodynamics. Clinical pharmacology and therapeutics. 2008;84:548–58. doi: 10.1038/clpt.2008.170. [DOI] [PubMed] [Google Scholar]
- 5.Deng R, Loyet KM, Lien S, Iyer S, DeForge LE, Theil FP, Lowman HB, Fielder PJ, Prabhu S. Pharmacokinetics of humanized monoclonal anti-tumor necrosis factor-{alpha} antibody and its neonatal Fc receptor variants in mice and cynomolgus monkeys. Drug metabolism and disposition: the biological fate of chemicals. 2010;38:600–5. doi: 10.1124/dmd.109.031310. [DOI] [PubMed] [Google Scholar]
- 6.Deng R, Meng YG, Hoyte K, Lutman J, Lu Y, Iyer S, DeForge LE, Theil FP, Fielder PJ, Prabhu S. Subcutaneous bioavailability of therapeutic antibodies as a function of FcRn binding affinity in mice. mAbs. 2012;4:101–9. doi: 10.4161/mabs.4.1.18543. [DOI] [PMC free article] [PubMed] [Google Scholar]
- 7.Porter CJ, Edwards GA, Charman SA. Lymphatic transport of proteins after s.c. injection: implications of animal model selection. Adv Drug Deliv Rev. 2001;50:157–71. doi: 10.1016/s0169-409x(01)00153-3. [DOI] [PubMed] [Google Scholar]
- 8.Bocci V, Muscettola M, Grasso G, Magyar Z, Naldini A, Szabo G. The lymphatic route 1) Albumin and hyaluronidase modify the normal distribution of interferon in lymph and plasma. Experientia. 1986;42:432–3. doi: 10.1007/BF02118644. [DOI] [PubMed] [Google Scholar]
- 9.Bocci V, Muscettola M, Naldini A. The lymphatic route--III. Pharmacokinetics of human natural interferon-beta injected with albumin as a retarder in rabbits. General pharmacology. 1986;17:445–8. doi: 10.1016/0306-3623(86)90189-8. [DOI] [PubMed] [Google Scholar]
- 10.Yuan SYRR. Regulation of Endothelial Barrier Function. Morgan & Claypool Life Sciences; San Rafael: 2010. Structure and Function of Exchange. [PubMed] [Google Scholar]
- 11.Negrini D, Moriondo A. Lymphatic anatomy and biomechanics. J Physiol. 2011;589:2927–34. doi: 10.1113/jphysiol.2011.206672. [DOI] [PMC free article] [PubMed] [Google Scholar]
- 12.Schmid-Schonbein GW. Microlymphatics and lymph flow. Physiological reviews. 1990;70:987–1028. doi: 10.1152/physrev.1990.70.4.987. [DOI] [PubMed] [Google Scholar]
- 13.Swabb EA, Wei J, Gullino PM. Diffusion and convection in normal and neoplastic tissues. Cancer Res. 1974;34:2814–22. [PubMed] [Google Scholar]
- 14.Miclea RD, Purohit VS, Balu-Iyer SV. O-phospho-L-serine, multi-functional excipient for B domain deleted recombinant factor VIII. Aaps J. 2007;9:E251–9. doi: 10.1208/aapsj0902028. [DOI] [PMC free article] [PubMed] [Google Scholar]
- 15.Purohit VS, Ramani K, Sarkar R, Kazazian HH, Jr, Balasubramanian SV. Lower inhibitor development in hemophilia A mice following administration of recombinant factor VIII-O-phospho-L-serine complex. J Biol Chem. 2005;280:17593–600. doi: 10.1074/jbc.M500163200. M500163200 [pii] [DOI] [PMC free article] [PubMed] [Google Scholar]
- 16.Fathallah AM, R Ramakrishnan, Balu-Iyer SV. O-Phospho-L-Serine mediates hyporesponsiveness towards FVIII in hemophilia A-murine model by inducing tolerogenic properties in dendritic cells. J Pharm Sci. 2014 doi: 10.1002/jps.24173. Forthcoming. [DOI] [PubMed] [Google Scholar]
- 17.Wu F, Tamhane M, Morris ME. Pharmacokinetics, lymph node uptake, and mechanistic PK model of near-infrared dye-labeled bevacizumab after IV and SC administration in mice. Aaps j. 2012;14:252–61. doi: 10.1208/s12248-012-9342-9. [DOI] [PMC free article] [PubMed] [Google Scholar]
- 18.Albert B, Johnson A, Lewis J. Molecuar biology of the cell. Gerland Science; New York: 2002. Ion Channels and the Electrical Properties of Membranes. [Google Scholar]
- 19.Smiechowski M. Theoretical pKa prediction of O-phosphoserine in aqueous solution. Chemical Physics Letters. 2010;501:123–129. http://dx.doi.org/10.1016/j.cplett.2010.10.063. [Google Scholar]
- 20.Randolph GJ. Dendritic cell migration to lymph nodes: cytokines, chemokines, and lipid mediators. Semin Immunol. 2001;13:267–74. doi: 10.1006/smim.2001.0322. [DOI] [PubMed] [Google Scholar]
- 21.Oussoren C, Zuidema J, Crommelin DJ, Storm G. Lymphatic uptake and biodistribution of liposomes after subcutaneous injection. II. Influence of liposomal size, lipid compostion and lipid dose. Biochim Biophys Acta. 1997;1328:261–72. doi: 10.1016/s0005-2736(97)00122-3. [DOI] [PubMed] [Google Scholar]
- 22.Margaris KN, Black RA. Modelling the lymphatic system: challenges and opportunities. J R Soc Interface. 2012;9:601–12. doi: 10.1098/rsif.2011.0751. [DOI] [PMC free article] [PubMed] [Google Scholar]
- 23.Browse NL, Doig RL, Sizeland D. The resistance of a lymph node to lymph flow. The British journal of surgery. 1984;71:192–6. doi: 10.1002/bjs.1800710308. [DOI] [PubMed] [Google Scholar]
- 24.Papp M, Makara GB, Hajtman B. The resistance of in situ perfused lymph trunks and lymph nodes to flow. Experientia. 1971;27:391–2. doi: 10.1007/BF02137266. [DOI] [PubMed] [Google Scholar]
- 25.Nony P, Girard P, Chabaud S, Hessel L, Thébault C, Boissel JP. Impact of osmolality on burning sensations during and immediately after intramuscular injection of 0. 5 ml of vaccine suspensions in healthy adults. Vaccine. 2001;19:3645–3651. doi: 10.1016/s0264-410x(01)00098-6. http://dx.doi.org/10.1016/S0264-410X(01)00098-6. [DOI] [PubMed] [Google Scholar]
- 26.Momm J, Wallny HJ. Google Patents. 2010. Antibody formulation. [Google Scholar]
- 27.Liu J, Shire SJ. Reduced-viscosity concentrated protein formulations. Google Patents. 2002 [Google Scholar]
- 28.Immune globulin subcutaneous (human), 20% liquid. P & T : a peer-reviewed journal for formulary management. 2010;35:2–4. [PMC free article] [PubMed] [Google Scholar]
- 29.Randolph GJ, Angeli V, Swartz MA. Dendritic-cell trafficking to lymph nodes through lymphatic vessels. Nat Rev Immunol. 2005;5:617–28. doi: 10.1038/nri1670. nri1670 [pii] [DOI] [PubMed] [Google Scholar]
- 30.Fathallah AM, Bankert RB, Balu-Iyer SV. Immunogenicity of Subcutaneously Administered Therapeutic Proteins-a Mechanistic Perspective. Aaps J. 2013 doi: 10.1208/s12248-013-9510-6. [DOI] [PMC free article] [PubMed] [Google Scholar]


