

Correlation of ongoing neural dynamics reveals the various carrier frequencies of cortico-tectal functional interaction.
Keywords: superior colliculus, corticotectal, ongoing neural dynamics, oscillations, high gamma
Abstract
In the absence of sensory stimulation or motor output, the brain exhibits complex spatiotemporal patterns of intrinsically generated neural activity. Analysis of ongoing brain dynamics has identified the prevailing modes of cortico-cortical interaction; however, little is known about how such patterns of intrinsically generated activity are correlated between cortical and subcortical brain areas. We investigate the correlation structure of ongoing cortical and superior colliculus (SC) activity across multiple spatial and temporal scales. Ongoing cortico-tectal interaction was characterized by correlated fluctuations in the amplitude of delta, spindle, low gamma, and high-frequency oscillations (>100 Hz). Of these identified coupling modes, topographical patterns of high-frequency coupling were the most consistent with patterns of anatomical connectivity, reflecting synchronized spiking within cortico-tectal networks. Cortico-tectal coupling at high frequencies was temporally parcellated by the phase of slow cortical oscillations and was strongest for SC-cortex channel pairs that displayed overlapping visual spatial receptive fields. Despite displaying a high degree of spatial specificity, cortico-tectal coupling in lower-frequency bands did not match patterns of cortex-to-SC anatomical connectivity. Collectively, our findings demonstrate that neural activity is spontaneously coupled between cortex and SC, with high- and low-frequency modes of coupling reflecting direct and indirect cortico-tectal interactions, respectively.
INTRODUCTION
Rather than remaining entirely inactive in the absence of sensory stimuli or motor output, the brain displays complex spatiotemporal activation patterns that are more generally described as “ongoing activity” (1–3). For a long time, ongoing activity was thought of as a form of neural noise, which was the net product of random fluctuations in neural networks. However, more recent studies have shown that the dynamics of spontaneously generated neural activity can be informative about the functional organization of large-scale brain networks (4–6), revealing intrinsically generated “coupling modes” at multiple spatial and temporal scales (2, 3). Converging evidence from both noninvasive and invasive approaches has led to the identification of the most prominent spectral features of ongoing large-scale functional interaction (3, 4, 7–9). However, for the most part, the study of ongoing brain dynamics has been heavily limited to measures of cortico-cortical functional coupling (5, 10, 11). Whether the result of an overly corticocentric focus of the field (12), or because of technical limitations of commonly used experimental procedures, there have been relatively few studies on the role that subcortical structures play in the generation of intrinsically organized large-scale neural dynamics.
The superior colliculus (SC) presents itself as an interesting model to study the ongoing dynamics of cortical-subcortical functional interaction because it receives dense inputs from a wide range of sensory and motor cortical areas (13). In addition, the SC is indirectly connected to the cortex via other subcortical structures such as the pulvinar and lateral geniculate nucleus (14–17). Here, we hypothesize that neural activity in the cortex and SC is intrinsically coupled and that functional interaction along bottom-up (SC-to-cortex) and top-down (cortex-to-SC) pathways is conveyed through distinct physiological frequency bands. To test this hypothesis, we recorded spiking activity and local field potentials (LFPs) from all layers of the SC and visual cortex while simultaneously sampling LFPs from the entire posterior cortex using a custom-designed microelectrode array (μECoG; Fig. 1). We identified cortico-tectal functional coupling modes spanning several physiological carrier frequencies. High-frequency amplitude envelope correlation was strongly related to the correlated spiking activity of SC and cortex neurons, and mirrored patterns of anatomical connectivity, whereas lower-frequency coupling appeared less related to structural connectivity. Cortico-tectal functional interaction in the high-frequency band was parcellated by the phase of slow cortical oscillations, reflecting the subcortical entrainment of ongoing activity to cortical “up” and “down” states. As the first demonstration of the large-scale correlation structure of ongoing cortico-tectal neural activity, these findings highlight that the functional architecture of large-scale networks in the brain can be resolved through the correlation analysis of ongoing neural dynamics.
Fig. 1. Experimental setup.
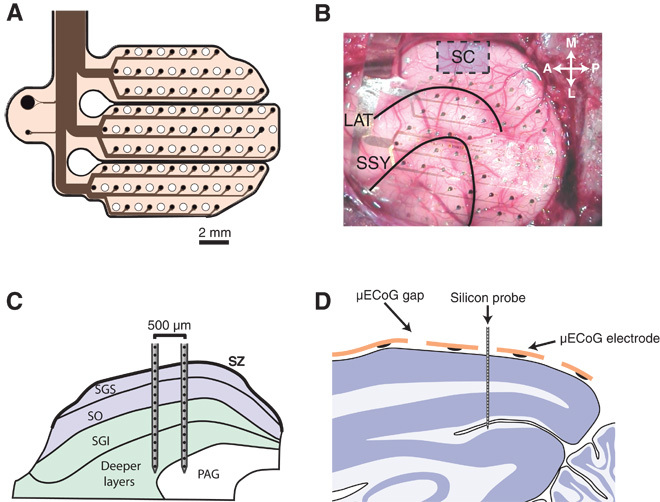
(A) Schematic diagram of the custom-designed μECoG array. Sixty-four electrodes of 250-μm diameter were distributed across three separate polyimide fingers and arranged in a hexagonal grid (1.5-mm inter-electrode spacing). Holes were cut into the polyimide foils in the space between electrodes to allow for the placement of linear silicon probes. (B) A photo from the surgical implantation of the μECoG array. The general area for SC penetrations is shown by a blue box. Black lines indicate the lateral sulcus (LAT) and the suprasylvian sulcus (SSY). (C) Schematic diagram illustrating the placement of dual-shank 32-channel silicon probes in the SC. Probes were placed such that neural data could be acquired from both superficial (blue) and deep (green) layers of the SC simultaneously. (D) Schematic illustration of the placement of linear silicon probes in the visual cortex. Single-shank 32-channel probes (100-μm inter-electrode spacing) were advanced into the cortex through small holes in the μECoG array. Probes were advanced until the most superficial contacts were just above the pial surface, such that we recorded, in a single penetration, from superficial and deep visual cortex simultaneously. SZ, stratum zonale; SGS, stratum griseum superficiale; SO, stratum opticum; SGI, stratum griseum intermediale; PAG, periaqueductal gray.
RESULTS
Large-scale correlation structure of cortico-cortical and cortico-tectal interactions
Before assessing the dynamics of simultaneously recorded SC and cortical activity, we first wanted to identify the spectral signatures that define cortico-cortical functional connectivity under isoflurane anesthesia (for average ongoing power spectra of SC, intracortical, and μECoG recording sites, see fig. S1). To this end, we computed the correlation of band-limited signal amplitudes between all possible combinations of μECoG recording contacts. Figure 2A illustrates the strength of amplitude correlation for each carrier frequency as a function of μECoG inter-electrode distance. Amplitude envelopes of oscillations in the slow (~0.7 Hz), delta (~3 Hz), and spindle (~11 Hz) frequencies were correlated over large distances in the cortex. For frequencies above 30 Hz, amplitude envelope correlation gradually decreased with increasing frequency such that μECoG signal frequencies above 120 Hz displayed minimal inter-electrode amplitude envelope correlation, suggesting that such high-frequency μECoG signal components reflect neural activity at a more local scale. To validate the cortico-cortical functional connectivity findings from μECoG LFPs, we repeated the same amplitude envelope correlation analysis between intracortical recording sites and μECoG contacts (Fig. 2A). Indeed, intracortical-μECoG amplitude envelope correlation displayed the same spectral characteristics, with spontaneous amplitude fluctuations strongly correlated for slow (~0.7 Hz), delta (~3 Hz), and spindle (~11 Hz) frequencies over larger distances.
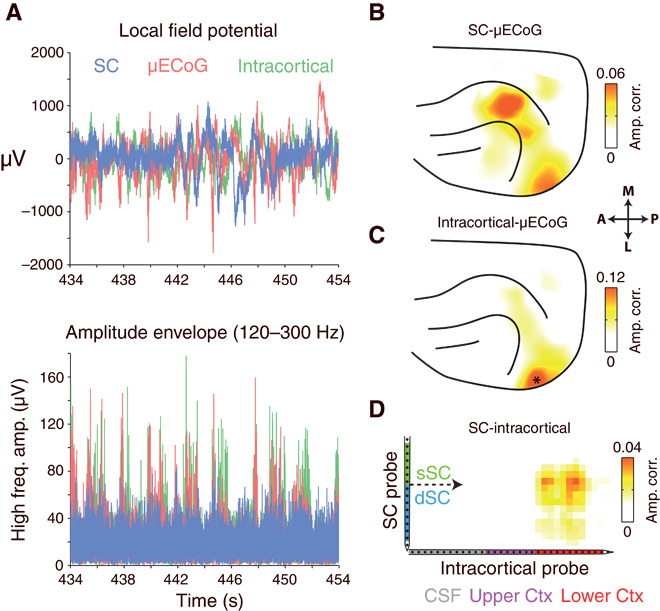
Fig. 2. Dynamics and large-scale topography of cortico-cortical and cortico-tectal amplitude envelope correlation.

(A) Top: Population-averaged amplitude envelope correlation computed between μECoG contact pairs separated by varying distances. Note that correlations are widely distributed in slow (~0.7 Hz), delta (~3 Hz), and spindle (8 to 15 Hz) frequency ranges and that amplitude envelopes are minimally correlated for frequencies above 120 Hz. Middle: Population-averaged amplitude envelope correlation computed between intracortical and μECoG recording sites. Bottom: Population-averaged cortico-tectal amplitude envelope correlation computed for SC recording contacts located in superficial (blue) and deep (red) SC layers. Note the peaks in cortico-tectal amplitude correlation for delta, spindle, and gamma frequencies. (B) Average cortical topography of cortico-tectal amplitude correlation for delta, spindle, and gamma (30 to 45 Hz) carrier frequencies. Maps are plotted for both superficial and deep SC layers. To compare functional coupling to anatomy, we plotted the density of tectally projecting neurons across the cortical surface. Anatomical data were adapted with permission from Fig. 1 in (13). (C) Spatial correlation of anatomical connectivity (B, bottom) and functional coupling topographies across all frequencies. The z score of correlation coefficients was estimated by computing the spatial correlation of randomly scrambled amplitude correlation topographies and anatomical data. Analyses for superficial and deep layers are plotted in blue and red, respectively.
Because the origin of cortical afferent inputs varies between superficial and deep SC layers (18), we used current source density analysis to separate SC recording contacts into superficial and deep zones (fig. S2) for cortico-tectal functional connectivity analysis (19). Reflecting cortico-cortical amplitude correlation spectra, global cortico-tectal amplitude envelope correlation was characterized by peaks in the delta, spindle, and low gamma (30 to 45 Hz) frequencies (Fig. 2A, bottom). Cortico-tectal coupling in the delta range displayed a patchy cortical topography, whereas spindle coupling was widespread with a peak in parietal cortical areas (Fig. 2B). Coupling in the low gamma band displayed a more spatially specific cortical topography, with a clear peak in parietal areas (Fig. 2B). Given that anatomical connectivity defines the structural framework upon which neural dynamics is superimposed, functional connectivity measures reflecting direct cortico-tectal interaction should overlap with patterns of monosynaptic anatomical connectivity. To test this, we computed the spatial correlation of cortico-tectal coupling topographies with the distribution of SC-projecting neurons across the cortex (Fig. 2C). Cortico-tectal anatomical connectivity data were adapted with permission from Manger et al. (13). To estimate the significance of anatomy/physiology spatial correlation, we randomly scrambled amplitude correlation topographies 50 times to generate a surrogate correlation distribution, and then expressed true spatial correlation across all frequencies in terms of SD of the surrogate distribution (z score). None of the identified delta (sSC z-scored correlation = −0.92; dSC z-scored correlation = −1.12), spindle (sSC z-scored correlation = 0.11; dSC z-scored correlation = −1.02), or gamma (sSC z-scored correlation = −1.37; dSC z-scored correlation = −1.72) frequency bands displayed coupling profiles that matched anatomical connectivity patterns. However, despite displaying quantitatively weaker amplitude envelope correlation, coupling in frequencies above 100 Hz mirrored anatomical connectivity for both superficial (z-scored correlation = 1.92, P = 0.055) and deep (z-scored correlation = 2.97, P = 0.003) SC layers (Fig. 2C). These results suggest that coupling in the identified delta, spindle, and gamma frequency bands reflects indirect modes of cortico-tectal functional interaction, whereas coupling in high frequencies likely reveals direct cortico-tectal communication.
Correlated fluctuations in high-frequency LFPs reflect cortico-tectal structural connectivity
We next investigated the dynamic relationship between simultaneously recorded high-frequency (>120 Hz) LFP components in the SC and cortex. Figure 3A displays a short epoch of co-recorded SC, intracortical, and μECoG data from an example experiment. Amplitude envelopes of high-frequency signals displayed spontaneous bursting-like activity patterns that appeared to occur synchronously between the SC and the cortex. To visualize the cortical topography of SC-μECoG interactions, we selected a seed channel in the SC and plotted the strength of amplitude correlation with all μECoG recording contacts as a heat map on the cortex (Fig. 3B). The example SC recording contact shown in Fig. 3 displays spatially specific amplitude correlation with two separate clusters of μECoG channels over the lateral visual cortex and the suprasylvian gyrus. Cortico-tectal amplitude correlation topographies measured using high frequencies were consistent when computed across nonoverlapping time periods (fig. S4). In contrast to the SC, high-frequency signals that are recorded intracortically only display amplitude-envelope correlation with immediately surrounding μECoG electrodes in the lateral visual cortex (Fig. 3C). In this example recording, the cortical topography of SC-μECoG and the intracortical-μECoG amplitude correlation display considerable overlap in the lateral visual cortex (lower blob in Fig. 3, B and C). Reflecting this overlap, we also observed amplitude envelope correlation between a cluster of SC and intracortical channel pairs (Fig. 3D).
Fig. 3. High-frequency LFP amplitude envelopes are correlated between cortex and SC.
(A) Simultaneously recorded SC, intracortical, and μECoG signals from one example recording session. No relationship between signals is immediately visible upon inspection of LFPs (top). However, high-frequency amplitude envelopes display burst-like fluctuations that appeared to occur synchronously. (B) Cortical topography of high-frequency amplitude envelope correlation for the seed SC electrode displayed in (A). Note the region-specific amplitude correlation for lateral visual and suprasylvian cortical areas. (C) Cortical topography of high-frequency amplitude envelope correlation for the intracortical recording site displayed in (A). Note the presence of correlated high-frequency activity in cortical regions immediately surrounding the position of the intracortical recording site (marked as *). (D) Strength of high-frequency amplitude correlation between all SC and intracortical channel pairs. Note the presence of a cluster of correlated channels in the center of the SC probe and the lower third of the intracortical probe.
We next computed the correlation of high-frequency LFP amplitude envelopes between all possible combinations of SC-μECoG and SC-intracortical recording sites. Figure 4 displays the average cortical topography of high-frequency LFP amplitude correlations from superficial SC to μECoG (Fig. 4A, left) and deep SC to μECoG channel pairs (Fig. 4A, middle). Superficial SC recording sites were correlated with μECoG contacts distributed over the entire visual cortex, with strongest correlation in cortical area 18 (amplitude correlation = 0.021 ± 0.003 SEM), slightly weaker correlation in higher visual (SSY: suprasylvian area, 0.014 ± 0.003) and posterior parietal areas (PPc: 0.012 ± 0.002), and almost no correlation in auditory cortical areas (0.005 ± 0.002) (Fig. 4B, left). In contrast, deep SC layers displayed amplitude correlation effects with a wider range of cortical areas, with strongest correlation to visual area 21 (0.022 ± 0.004 SEM) and posterior parietal areas (PPc = 0.021 ± 0.003, PPr = 0.022 ± 0.003) (Fig. 4B, middle). The cortical topography of deep SC to μECoG high-frequency correlation extended from early visual areas, through higher visual and multisensory areas along the suprasylvian gyrus toward somatosensory cortex, and reflecting the data presented in Fig. 2C, was significantly correlated with the topography of cortico-tectal anatomical connectivity (Fig. 4A, right; P = 0.003).
Fig. 4. Large-scale topography of high-frequency cortico-tectal amplitude envelope correlation.

(A) Left: Average cortical topography of LFP amplitude correlation between superficial SC and μECoG array. Note the strongest amplitude correlation over posterior visual cortex. Middle: Average cortical topography of deep SC to μECoG LFP amplitude correlation. Note the presence of strong amplitude correlation in visual and suprasylvian cortical areas. Amplitude correlation effects extend anterior-medially along the suprasylvian gyrus toward a separate cluster of strong correlation in suprasylvian cortex. Right: Plot of the density of tectally projecting neurons across the cortical surface. Data were adapted with permission from (13). (B) Population-averaged (±SEM) strength of superficial SC-μECoG (left) and deep SC-μECoG (middle) high-frequency amplitude envelope correlation for different cortical areas. A map of the areal parcellation used in this analysis is shown on the right. Note the presence of strong correlation in early visual cortical areas for superficial SC-μECoG channel pairs. In contrast, deep SC-μECoG amplitude correlation was more widespread, encompassing visual, suprasylvian, and posterior parietal areas. (C) Left: Incidence of significant SC-μECoG high-frequency amplitude correlation as a function of SC depth. Right: Population-averaged spike/noise ratio in response to visual flash stimulation (flash onset at 0 s). Note that significant amplitude correlation with cortex was most prominent in intermediate/deep SC layers.
To assess cortico-tectal amplitude correlation effects systematically across SC layers, we aligned all penetrations to the current source density inflection depth (see fig. S2) and then computed the percentage of recording sites that were significantly correlated with cortex at each depth (Fig. 4C). Cortico-tectal amplitude correlation effects displayed a clear depth dependency in the SC, with correlation being lower in upper superficial layers and gradually increasing with depth to peak in intermediate layers, before fading again in the deepest layers (for cortical depth profile, see fig. S5).
High-frequency LFP amplitude correlation reflects correlated cortico-tectal spiking activity
We reasoned that correlated fluctuations of high-frequency extracellular fields between SC and cortex might reflect, to a large extent, the synchronous spiking activity of neurons across cortico-tectal networks. To test whether SC spiking occurred synchronously with fluctuations in high-frequency μECoG amplitude, we computed SC spike-triggered average (STA) spectrograms based on μECoG signals. Figure 5A displays an example recording, with SC STA spectra shown for μECoG contacts that displayed both weak and strong high-frequency amplitude envelope correlation, respectively. There was little observable change in μECoG signal power locked to the timing of SC spikes for the channel pair that displayed weak amplitude correlation. In contrast, the SC-μECoG channel pair that displayed strong amplitude correlation showed a broadband increase in the power of μECoG frequencies above 10 Hz locked to the timing of SC spiking activity (Fig. 5A). Generalizing from the example shown in Fig. 5A, SC-μECoG channel pairs displaying significant high-frequency coupling showed increased STA μECoG power in frequencies above 10 Hz locked to the timing of SC spikes (Fig. 5B). In addition, the magnitude of cortico-tectal amplitude correlation was tightly coupled to the STA power of high-frequency cortical signals across all SC-μECoG channel pairs (r = 0.77, P < 0.0001), indicating that spontaneous fluctuations of high-frequency μECoG signal amplitude occur synchronously with spiking activity in the SC (Fig. 5C).
Fig. 5. High-frequency amplitude envelope correlation reflects synchronized cortico-tectal spiking activity.

(A) SC STA spectrograms for two different μECoG contacts from an example recording session. The location of the contacts is shown in the panel on the left. Both spectrograms were computed using spiking data from the same SC seed contact. The strength of cortico-tectal amplitude correlation for the SC seed electrode is displayed as a heat map. Note the presence of an increase of μECoG signal power for frequencies above 20 Hz time-locked to SC spiking activity for the channel pair that showed strong power correlation (right, bottom panel). In contrast, the weakly correlated channel pair displayed no spike-triggered change in signal power (right, top panel). (B) Population mean (±SD) STA spectrograms. SC-μECoG channel pairs displaying significant high-frequency amplitude correlation are plotted in blue, whereas all others are plotted in red. (C) Correlation of amplitude envelope coupling and STA power for all frequency-frequency combinations. Note that high-frequency coupling is correlated to the strength of STA signals in frequencies above ~3 Hz. (D) Example spike cross-correlation histograms for SC-intracortical channel pairs that displayed strong (blue) and weak (red) high-frequency amplitude envelope correlation, respectively. Note the large peak around ~0 ms for the correlated channel pair and the lack of structure for the uncorrelated channel pair. (E) Scatter plot of the strength of amplitude correlation plotted against the probability of synchronous spiking for all SC-intracortical channel pairs. The correlation coefficient and related P value are shown as an inset. (F) Correlation of amplitude envelope coupling and synchronized spiking activity as a function of frequency (±SD). Note that coupling in high LFP frequencies specifically correlates with synchronized cortico-tectal spiking activity.
To confirm the neurophysiological origin of high-frequency cortico-tectal amplitude correlation, we next investigated the relationship between LFP amplitude envelope correlation and cortico-tectal spike-spike correlations. Figure 5D displays spike cross-correlation histograms for two SC-intracortical channel pairs that display strong and weak amplitude correlation, respectively. The correlated channel pair shows a large peak centered at 0 ms in the cross-correlation histogram, indicating that these neurons fire synchronously. In contrast, the uncorrelated channel pair showed little or no structure in the spike cross-correlation histogram, indicating that these co-recorded neurons fire independently. Across all SC-intracortical channel pairs, the strength of high-frequency amplitude correlation was significantly correlated with the probability of synchronized cortico-tectal spiking (r = 0.57, P < 0.0001; Fig. 5E). To test whether this effect was specific for high-frequency coupling, we repeated the same analysis across all frequencies (Fig. 5F). Indeed, this analysis confirmed that high-frequency amplitude envelope correlation specifically tracks the synchronized spiking activity of co-recorded neuron populations, with coupling at frequencies below about 100 Hz displaying weak correlation with coordinated spiking activity.
High-frequency LFP amplitude correlation during sustained visual stimulation
To investigate how patterns of cortico-tectal LFP amplitude correlation change after the application of an external driving force (that is, sensory stimulation), we performed amplitude correlation analysis on neural activity induced by drifting grating stimulation. To ensure that we analyzed only sustained activity throughout stimulation, high-frequency amplitude correlation was computed in the time window from 100 ms after grating onset, up until the offset of stimulation. In the SC, drifting gratings typically evoked large power increases in frequencies above 80 Hz (Fig. 6A), whereas μECoG responses displayed power increases in a broader range of frequencies above 40 Hz (Fig. 6A). Across all SC-μECoG electrode pairs, there was a strong correlation between the strength of spontaneous and stimulus-driven high-frequency (>120 Hz) amplitude correlation (r = 0.49, P < 0.001), indicating that patterns of cortico-tectal functional connectivity were generally preserved across spontaneous and stimulus-driven conditions. However, the strength of amplitude correlation during visual stimulation was significantly weaker than spontaneous correlation (Fig. 6A; number of data points below 1:1 dotted line, P < 0.001, sign test). This result suggests that dynamic fluctuations of SC neural activity are more dependent on cortical inputs during ongoing activity, whereas bottom-up retinal inputs and intrinsic network properties may play a larger role in shaping the dynamics of SC activity during visual stimulation.
Fig. 6. Comparison of spontaneous and stimulus-induced high-frequency neural dynamics.

(A) Drifting grating induced power changes for representative SC (left) and μECoG (middle) recording sites. The gray bar above each spectrogram indicates the duration of drifting grating stimulation. Note the broadband increase in high-frequency power for both SC and μECoG recording sites. Right: A scatter plot of the strength of spontaneous SC-μECoG versus drifting grating-induced SC-μECoG high-frequency amplitude correlation. Note that most data points lie below the 1:1 line, indicating that SC-μECoG channel pairs display stronger amplitude correlation during spontaneous activity. (B) Left: μECoG and SC visual spatial receptive fields from one example recording session. Note that this SC-μECoG channel pair displayed considerable visual spatial receptive field overlap as well as strong high-frequency amplitude envelope correlation during spontaneous activity. Right: Histogram displaying the distribution of visual receptive field correlation for SC-μECoG channel pairs that displayed significant high-frequency amplitude correlation (blue) and insignificant correlation (red). *P < 0.01.
Correlated cortico-tectal recording sites display similar visual spatial receptive fields
We next tested whether SC-μECoG channel pairs identified through high-frequency LFP amplitude envelope correlation analysis displayed similar visual spatial receptive fields. Because previous anatomical studies have shown that visual cortical neurons project to areas of the SC with corresponding retinotopic representations (20), we reasoned that spontaneously correlated cortico-tectal recording sites should display similar spatial receptive fields. Figure 6B displays SC and μECoG visual spatial receptive fields from an example channel pair that exhibited significant high-frequency amplitude envelope correlation. Despite the SC receptive field being smaller than the μECoG receptive field, both recording sites responded to stimuli in similar locations in the visual field. To quantify the similarity of SC and μECoG spatial receptive fields (RF), we computed the correlation coefficient between the two-dimensional visual spatial response matrices (Fig. 6B). Spontaneously coupled SC-μECoG channel pairs showed significantly stronger similarity of visual spatial receptive fields (amplitude correlated: mean RF correlation = 0.46 ± 0.22 SD, amplitude uncorrelated: mean RF correlation = 0.27 ± 0.25 SD, P < 0.0001; Fig. 6B). These results confirm that functionally coupled cortico-tectal recording sites display similar visual receptive fields, as predicted by anatomical connectivity.
Correlated cortico-tectal activity is temporally coordinated by slow oscillations
To further investigate the temporal dynamics of cortico-tectal functional connectivity, we computed the phase-locking value (PLV) of SC spiking activity to cortical oscillations. In general, SC spiking activity was strongly modulated by the phase of cortical oscillations at a frequency of about 0.8 Hz (Fig. 7A, left), matching the reported frequency of the slow cortical oscillation (21, 22). However, functionally coupled SC-μECoG channel pairs displayed significantly stronger phase locking to slow cortical oscillations than did uncorrelated channel pairs (correlated: PLV = 0.09 ± 0.002 SEM, uncorrelated: PLV = 0.05 ± 0.001, P < 0.01). Cortico-tectal slow oscillatory spike-phase locking was specific for endogenous cortical slow oscillations and displayed no temporal dependency to the frequency of artificial ventilation (fig. S6). In contrast to cortico-tectal spike-phase locking, SC spiking activity displayed significant phase locking to local oscillations at a frequency of about 10 Hz (PLV = 0.055 ± 0.002 SEM, P < 0.01) (Fig. 7A, right).
Fig. 7. The dynamics of spontaneous SC neural activity are dominated by the phase of slow and spindle oscillations.

(A) Population-averaged (±SEM) SC spike PLVs calculated using the phase of cortical (left) and local SC oscillations (right). The dashed line in each plot illustrates the level of significance (P < 0.01). For SC-μECoG channel pairs, significantly correlated and uncorrelated channel pairs are plotted separately. The black bar at the bottom of the SC-μECoG plot indicates the area in which correlated and uncorrelated curves are significantly different (P < 0.01). Note that spiking in amplitude-correlated channel pairs is more strongly locked to the phase of slow cortical oscillations. In addition, SC spiking activity is locked to the phase of local oscillations at the spindle frequency (~10 Hz). (B) Population-averaged cross-frequency phase-amplitude spectrograms calculated using the phase of μECoG oscillations and the amplitude of SC signals. Significantly correlated SC-μECoG channel pairs are shown on the left, uncorrelated channel pairs in the middle, and the difference between correlated and uncorrelated on the right. Note that SC-μECoG channel pairs that display strong high-frequency amplitude correlation also show significantly stronger coupling of SC oscillations above 8 Hz to the phase of slow cortical oscillations.
To quantify the relationship between SC and cortical oscillations by an additional coupling measure that takes phase into account, we computed the cross-frequency phase-amplitude coupling between SC and μECoG recording sites (see fig. S7). This measure quantifies the strength with which the amplitude of SC LFP oscillations is modulated by the phase of μECoG signals across all possible frequency-frequency combinations. Figure 7B displays population-averaged cross-frequency phase-amplitude spectrograms for SC-μECoG channel pairs that display significant (left) and insignificant (middle) high-frequency amplitude correlation, respectively. Cross-frequency coupling for correlated SC-μECoG channel pairs was characterized by the strong modulation of SC activity above 8 Hz by the phase of slow cortical oscillations. In contrast, uncorrelated SC-μECoG channel pairs displayed comparatively weak cross-frequency coupling (Fig. 7B, middle). The difference in cross-frequency spectra between significantly correlated and uncorrelated SC-μECoG channel pairs reveals that the phase of slow cortical oscillations specifically modulates the amplitude of SC oscillations for functionally coupled cortico-tectal recording sites (Fig. 7B, right; P < 0.01, Bonferroni-corrected).
To illustrate the dependency of SC activity on cortical slow oscillation phase in raw data, Fig. 8A displays a raster plot of spontaneous SC spiking activity plotted with a simultaneously recorded μECoG signal band-pass filtered in the slow oscillatory frequency range (0.5 to 1.2 Hz). In this short epoch, SC spiking activity across several layers appears to group on the downward phase of the slow cortical oscillation. Despite most channels being locked to the phase of the slow oscillation, closer visual inspection of the raster plot reveals that recording sites at different depths within the SC are locked to slightly different phases of the cortical oscillation. Indeed, spike-phase histograms shown in Fig. 8B exhibit slightly different distributions, with spiking activity from the more superficial recording contact centered on a slightly later μECoG slow oscillation phase than the deeper recording contact. We next quantified the preference of SC spiking activity to slow cortical oscillation phase by computing spike-phase histograms across all SC layers. Slow oscillation spike-phase histograms were centered on the phase of cortical up states, which were defined as the slow oscillation phase where high-frequency activity was strongest on μECoG contacts. Spiking activity across all SC layers showed a preference for the slow oscillatory phase corresponding to cortical up states, with the strongest phase dependency detected in intermediate SC layers, 300 μm below the presumed superficial/deep border (Fig. 8C). In addition to displaying stronger modulation by slow cortical oscillations, spiking activity in intermediate layers also occurred at an earlier phase than did recording sites located both dorsally in superficial layers and ventrally in the deep SC (relative phase at distance to inflection depth: 16° at +200 μm, −22° at −500 μm, and −11° at −1000 μm). These findings demonstrate that whereas all SC layers are entrained during cortical up states, intermediate SC layers are entrained first, before activity gradually propagates in both superficial and deep directions.
Fig. 8. The dependency of SC spiking activity to the phase of cortical slow oscillations.

(A) Example of μECoG signal filtered at the slow oscillation frequency with a raster plot containing spiking data from several SC channels. Note that the bursting behavior of SC neurons appears to be phase-locked to the trough of the filtered slow wave. (B) Spike-phase histograms for the two channels marked (blue and green) in (A). Note that neurons from the more superficial recording contact prefer a slightly earlier phase than the deeper recording contact. (C) Population-averaged spike-phase histogram as a function of SC depth. Histograms were compiled using SC spiking activity and the phase of μECoG slow oscillations, and centered on the slow oscillatory phase corresponding to cortical up states, where a relative phase of 0 indicates the center of the up state located close to the trough of cortical slow oscillations. The strength with which average spike-phase histograms across each SC depth deviate from a uniform circular distribution is shown as a bar plot to the right, where the color of each bar indicates the preferred phase at each depth. Note that spike-phase locking is strongest and occurs at the earliest phase in intermediate SC layers. From intermediate layers, both the strength of phase locking and phase lag decrease gradually with increasing distance in dorsal and ventral directions.
DISCUSSION
This study reveals the complex spatiotemporal structure of correlated cortico-tectal neural activity. We identified several distinct cortico-tectal coupling modes spanning different carrier frequencies, with amplitude envelope correlation in low gamma and high frequencies likely reflecting modes of indirect and direct communication, respectively. Patterns of high-frequency amplitude correlation specifically matched the topography of anatomical connectivity. We demonstrated that such coincident fluctuations in high-frequency LFPs tracked the synchronized spiking activity of SC and cortical neurons. Correlated cortico-tectal neural activity was temporally coordinated by the phase of slow cortical oscillations, reflecting the subcortical propagation of cortically generated up states. Together, these findings reveal the multiple temporal and spatial scales of cortico-tectal functional interaction, and highlight the rich information content of high-frequency LFPs measured by electrocorticogram.
Cortico-tectal coupling modes
Reflecting the multiple temporal scales of cortico-cortical functional interaction, our results confirm the existence of several cortico-tectal coupling modes with distinct carrier frequencies. From these identified coupling modes, amplitude envelope correlation in the low gamma and high frequencies displayed the most spatially specific cortico-tectal interaction, with peaks in parietal and visual/suprasylvian cortical areas, respectively. Indeed, reflecting the inherent link between structural connectivity and functional interaction, we found that the spatial topography of cortico-tectal high-frequency amplitude correlation is in agreement with previously identified patterns of anatomical connectivity (13), with superficial layers receiving mostly visual cortical inputs, whereas deep layers receive inputs from a wider range of cortical areas (18). The strong correspondence between anatomical connectivity and amplitude correlation topographies suggests that high-frequency coupling reflects direct cortex-to-SC communication. In contrast to high frequencies, functional interaction in delta, spindle, and low gamma frequencies displayed spatial topographies that were inconsistent with direct cortico-tectal anatomical connectivity. Because the SC is highly interconnected with other subcortical structures such as the substantia nigra (23, 24), pulvinar (14, 16, 17), ventral lateral geniculate nucleus (15, 25), and lateral posterior nucleus (26), it is likely that coupling measured in these frequency bands reflects indirect cortico-tectal interaction mediated via other subcortical structures. In line with this, the observed disparity in cortico-tectal interaction across different carrier frequencies may more generally reflect the varying biophysical time constants of mono- and multisynaptic modes of transmission in the brain (27). Low-frequency amplitude correlation exhibits a longer temporal window of integration and can therefore integrate information spanning several synapses along indirect cortico-tectal pathways (28, 29), explaining the divergence from maps of monosynaptic anatomical connectivity. In contrast, high-frequency amplitude correlation more likely represents rapid fluctuations transmitted across short synaptic distances (27–29) and therefore adheres to patterns of direct cortico-tectal anatomical connectivity. Studies in primates have identified an alternative ascending visual pathway that passes from the retina, through superficial layers of the SC to the pulvinar, and terminates in dorsal visual stream areas MT and V3 (14, 30). Functionally, this pathway is believed to mediate the phenomenon of blindsight, because it remains intact after early-life primary visual cortex lesions (31). Therefore, unlike high-frequency modes of direct cortex-to-SC communication, amplitude envelope coupling in lower-frequency bands may reflect the intrinsic network dynamics of an extrageniculate ascending visual pathway. Alternatively, low-frequency cortico-tectal coupling may reflect a more general, brain-wide form of coordinated activity, similar to resting-state networks identified in human studies (4). Nevertheless, the topological disparity between low- and high-frequency cortico-tectal coupling modes suggests that independent and complementary information about functional interaction is conveyed through different physiological carrier frequencies.
Comparison with other species
The interaction between the SC and cortex, or optic tectum and cortex in nonmammalian species, has been extensively studied in the past few decades (32–34). Although the tectum is highly conserved across vertebrate species, its relative size and precise functionality change dramatically across phylogeny. For example, the optic tectum represents one of the largest and most important visual structures in the avian brain (35), whereas in primates, the cortex has subsumed many of the tectum’s previous functions, with the SC only occupying a small fraction of the brain’s entire volume (36). Despite such anatomical and functional variance across species, our findings on cortico-tectal interaction in the ferret have some interesting parallels with previous work in owls and pigeons. Marín et al. (33) showed in pigeons that the optic tectum and entopallidum (extrastriate cortex) were synchronized in the low gamma band and that synchrony was selectively routed to cortex via the rotundum (pulvinar) in a bottom-up attention network. These findings in pigeons place the observed envelope coupling between SC and parietal cortex in the low gamma band into a broader and more functionally relevant context. Indeed, the dense reciprocal connectivity between SC and pulvinar provides the anatomical substrate for such indirect cortico-tectal interaction in the low gamma band (13, 14, 16, 17), indicating that such a bottom-up attention network might also involve the SC in mammalian species. Similar to our findings, previous studies have reported gamma activity in the intermediate layers of the optic tectum in barn owls, chicks, and pigeons (37–39). These studies demonstrated that the intermediate layer 10 is the likely source of gamma activity, which is then propagated to superficial and deep layers, displaying a striking resemblance to depth patterns of high gamma activity reported here (Fig. 8C). Therefore, despite displaying immense phylogenic variation, it appears that many spectral signatures of tectal function are highly conserved between mammalian and avian species.
Uncovering networks through analysis of ongoing activity
To our knowledge, this study represents the first attempt at investigating the large-scale spatiotemporal structure of spontaneous cortico-tectal interaction; therefore, to place our results into context, we must look to previous studies investigating different brain areas. Our results are most similar to a study performed by Fukushima and colleagues (40), which showed that high-frequency μECoG signals in awake monkey auditory cortex display spatial covariations in a manner that is reflective of the underlying tonotopic map of the auditory cortex. Revealing a similar functional organization of the primary visual cortex of the cat, Kenet and co-workers (41) showed using voltage imaging that the spatiotemporal structure of spontaneous neural activity was highly correlated to the underlying orientation map. Aside from reflecting the functional organization or brain regions, large-scale spatiotemporal fluctuations of spontaneous neural activity have also been shown to explain a large degree of trial-to-trial variability of sensory-evoked responses in primary visual cortex (1). However, unlike the abovementioned studies, which report the correlation structure of indirect measures of neural activity (that is, surface potentials and voltage-sensitive dye), we report here a direct link between the spontaneous correlation structure of high-frequency extracellular fields and the synchronized spiking activity of widely distributed neurons. Similar to our findings, Nir and co-workers showed that time-to-time variations in neuronal firing rate are strongly correlated to power modulations of high-frequency extracellular fields (40 to 100 Hz) between interhemispheric recording sites in the human auditory cortex (10). Other groups have investigated the correlation structure of intrinsically generated brain activity using functional magnetic resonance imaging (fMRI), which tracks the slow modulations of blood oxygen level–dependent (BOLD) signals throughout the brain (42). Similar to our findings, Vincent and co-workers showed that spontaneous BOLD fluctuations in the anesthetized monkey brain are correlated between anatomically connected cortical regions (43). Because BOLD signals track slower hemodynamic responses of brain regions (an indirect measure of neural activity), together, these studies reveal that functional brain organization can be delineated at both very slow and very fast temporal scales. Collectively, amplitude correlations in neural activity measured electrophysiologically or through fMRI can be more generally described as envelope intrinsic coupling modes (3). Although only demonstrated in cortico-tectal networks here, we propose the correlation analysis of spontaneous high-frequency amplitude envelopes as a useful tool for elucidating direct functional connectivity in high-throughput invasive recording paradigms.
SC activity couples to cortical slow and thalamic spindle oscillations
As shown here, the cortical slow oscillation temporally regulates correlated cortico-tectal activity under anesthesia. Slow cortical oscillations are generated locally within cortical layer 5 and subsequently propagate to other granular and supragranular cortical layers (21, 44, 45). Under normal physiological circumstances, slow cortical oscillations are the defining feature of slow wave sleep (46); however, they are also present under anesthesia, with the emergence of slow cortical oscillations representing the strongest physiological correlate of the loss of consciousness after the induction of propofol anesthesia (47). Because projection neurons in cortical layer 5 are strongly activated during up states of the slow oscillation (45, 48, 49), it is perhaps unsurprising that the downstream target neurons of these cells fire preferentially during cortical up states. Previous studies have also shown that neural activities in the basal ganglia (50), thalamus (51), cerebellum (52), and brainstem (53) are locked to the phase of the slow cortical oscillation during slow wave sleep and anesthesia. Indeed, these results highlight the strong entrainment capacity of slow cortical oscillation up states on downstream subcortical networks. However, local spindle-like activity in the SC was also locked to the phase of cortical slow waves, displaying a strikingly similar cross-frequency phase-amplitude relationship as thalamically generated spindles (21, 22, 44). Together, the entrainment of SC activity to thalamocortically coordinated sleep oscillations may suggest that the SC plays some role in regulation of neural activity during sleep (54). Alternatively, coupling in slow and spindle oscillatory frequencies may be induced by isoflurane anesthesia, which, through its action on GABAA (γ-aminobutyric acid type A) receptors, greatly enhances cortical slow oscillations (55). Further studies in chronically implanted animals are needed to fully elucidate any sleep function of the SC.
High-frequency LFP components
Despite the transmembrane potential being one of the most informative neurophysiological signals in the brain, limitations of large-scale electrophysiological recording techniques have required that investigators infer intracellular processes from the less informative extracellular field, as measured by LFPs. The reason that there has been an expanding interest in higher-frequency components of extracellular fields is that these signals have been shown to track the spiking activity of neurons (56–58) and the trial-to-trial behavioral performance of ECoG-implanted epilepsy patients (59). Indeed, a recent study by Khodagholy et al. (60) showed that the spiking activity of individual superficial cortical neurons can be detected by recording cortical surface potentials with sufficiently small electrodes (10 × 10 μm2). In addition to reflecting Na+ action potentials, high-frequency cortical surface potentials result from the superposition of several ionic processes that coincide with neuronal firing, such as synaptic currents, calcium spikes, spike afterhyperpolarizations, and intrinsic currents and resonances (58, 61). Thus, although spiking activity correlates with high-frequency μECoG activity, the relative contribution of the abovementioned ionic processes to the composition of high-frequency LFP signals reported in this study remains unclear. Nevertheless, our results extend on previous work by illustrating that coincident fluctuations in high-frequency signals between areas reflect the synchronized spiking activity of widely distributed neuronal populations. Indeed, this finding has strong implications for human ECoG studies in particular, by enabling the inference of spiking processes without penetrating the cortical surface.
In conclusion, we present a novel approach for investigating large-scale cortico-subcortical functional interaction through simultaneous depth and μECoG recordings. This approach enabled us to identify multiple ongoing cortico-tectal coupling modes spanning different carrier frequency bands. High-frequency amplitude envelope correlations conveyed the most information about direct cortex-to-SC communication and acted as a proxy for detecting coordinated spiking activity. Our results speak toward scaling down the dimensions of ECoG grids used in human studies in favor of high-density and small-diameter electrode designs (60), which would enable the tracking of spiking activity with high spatial resolution over vast areas of cortex and improve the accuracy of detecting pathologically altered neural activity and abnormal modes of neural communication.
MATERIALS AND METHODS
Data presented in this study were collected from nine adult female ferrets (Mustela putorius). All experiments were approved by the Hamburg state authority for animal welfare (BUG-Hamburg) and were performed in accordance with the guidelines of the German Animal Protection Law.
Custom μECoG design
For large-scale recordings of cortical LFPs, we used a polyimide-based micro-electrocorticographic electrode array (μECoG) (62), with a thickness of 10 μm, which was developed to optimally fit to the posterior cortex of the ferret. The custom μECoG array consisted of three “fingers,” each containing three rows of electrodes such that the polyimide foil can bend and conform to the curved surface of the ferret brain. The μECoG array had 64 platinum thin-film electrodes with a diameter of 250 μm. Electrodes were arranged in a hexagonal formation with an inter-electrode distance of 1.5 mm. Figure 1A displays a schematic diagram of the μECoG layout. To allow for simultaneous recording of μECoG signals and intracortical activity, small holes of 500-μm diameter were cut into the polyimide foil in the space between electrodes to allow for the placement of multichannel linear probes.
Surgery
Animals were initially anesthetized with an injection of ketamine (15 mg/kg). A glass tube was placed in the trachea to allow artificial ventilation of the animal and supply isoflurane anesthesia (0.5 to 1%, 1:1 NO-O2 mix, 0.8- to 1-Hz ventilation frequency). To prevent dehydration of the animal throughout experiments, a cannula was inserted into the femoral vein to deliver a continuous infusion of 0.9% NaCl, 0.5% NaHCO3, and pancuronium bromide (60 μg/kg per hour). Physiological parameters such as the electrocardiogram, rectal temperature, and end-tidal CO2 concentration were monitored throughout experiments to maintain the state of the animal. A large craniotomy was then performed over the entire left posterior cortex. After carefully removing the dura, the μECoG array was gently placed on the surface of the cortex. A small hole was drilled in the removed piece of scull over the area corresponding to the visual cortex, and then the piece of bone was fixed back in place with silicone elastomer (World Precision Instruments). All recordings were carried out in a dark, sound-attenuated chamber.
Electrophysiology
Neural activity in the SC was obtained with 2 × 16–channel dual-shank silicon probes (NeuroNexus Technologies, 100-μm electrode spacing, 500-μm inter-shank distance). Intracortical activity was obtained with linear 1 × 32–channel (100-μm electrode spacing, NeuroNexus Technologies) probes that were inserted into the visual cortex through small holes in the μECoG (Fig. 1). All silicon probe contacts had a surface area of 413 μm2. Broadband signals from silicon probes were digitized at 22,321.4 Hz (0.1-Hz high-pass and 6000-Hz low-pass filters), whereas μECoG signals were digitized at 1395.1 Hz (0.1-Hz high-pass and 357-Hz low-pass filters). Broadband data from silicon probes and μECoG were sampled simultaneously with a 128-channel AlphaLab SnR recording system (Alpha Omega Engineering). Unless otherwise stated, LFP signals were not re-referenced. Functional connectivity analysis was performed on spontaneous recordings of neural activity of about 10 min in length and the sustained period of drifting grating stimulation.
Visual stimulation
Visual stimuli consisted of flashes and drifting gratings presented on an LCD monitor (Samsung SyncMaster 2233, 60-Hz refresh rate) placed 28.5 cm in front of the animal. Stimuli were generated using the Matlab Psychophysics Toolbox (The MathWorks Inc.). Very large (40°) flashes were used for probing visual responses, whereas smaller flashes (8°) were used for quantifying visual spatial receptive fields. To provide more sustained visual stimulation, drifting gratings of 1-s duration were presented in 12 different directions spanning 360°.
Alignment of μECoG and SC electrode placement across animals
For each animal, the position of the μECoG over the posterior cortex was recorded by taking photographs through a Zeiss OPMI pico microscope. The approximate position of all 64 μECoG electrodes was then projected onto a scaled illustration of a model ferret brain. The cortical topography of amplitude correlation measures was then interpolated to fill the space between μECoG electrodes. Finally, cortical topographies for all SC-μECoG recording penetrations were averaged to obtain the mean amplitude correlation topography. SC penetrations were aligned using the flash current source density inflection depth (19, 63). For more details on SC-depth realignment, see fig. S2.
Data analysis
All offline data analyses of neural signals were performed using custom software in Matlab (The MathWorks Inc.). To extract multiunit spiking activity from broadband extracellular recordings, we high-pass–filtered signals at 500 Hz and detected spikes with a positive and negative threshold (64). LFPs were obtained by low-pass filtering broadband signals at 300 Hz. LFPs were filtered in both the forward and reverse direction to ensure zero phase shift. Finally, LFPs were downsampled by a factor of 16 to a sample rate of 1395.1 Hz. A notch filter was then applied at the respiratory rate frequency. We computed spectral estimates of LFPs using a series of 80 Morlet wavelets that were logarithmically spaced from 0.1 to 300 Hz (FieldTrip, width = 7 cycles), with increments of 5 ms (65).
Amplitude correlation
To track the waxing and waning of neural signals over time, we computed time-resolved estimates of the LFP signal amplitudes. To avoid the detection of spurious amplitude correlation due to the effects of shared noise or volume conduction, we orthogonalized pairs of signals before the computation of amplitude envelope time series (4). This crucial step removes zero phase–lagged components shared between simultaneously recorded signals, and ensures that only nonzero phase–lagged signal components are considered for amplitude envelope correlation analysis. After orthogonalization, amplitude envelopes were computed by taking the absolute value of time-frequency analysis in the time domain. The strength of amplitude correlation was then defined as the linear correlation coefficient of orthogonalized amplitude envelope time series. Significant SC-μECoG amplitude correlation channel pairs were defined as those that exceeded the mean plus two times the SD of the global SC-μECoG amplitude correlation matrix (P < 0.05).
Spike-phase locking
To estimate the influence of the phase of cortical oscillations on spiking activity in the SC, we calculated spike-LFP PLVs using spikes recorded from the SC and the phase of μECoG signals (66). For each SC-μECoG channel pair, spike PLVs were calculated from 1000 randomly drawn spikes. This process was repeated 100 times to get an estimate of the mean spike PLV. Channels where less than 1000 spikes were detected in the entire recording were eliminated from spike-phase locking analysis. The level of significance for spike PLVs was determined by the Rayleigh statistic (67).
Cross-frequency coupling
We quantified cross-frequency phase-amplitude coupling using methods previously described by Canolty et al. (68). Briefly, for each SC-μECoG channel pair, the phase of cortical signals and the amplitude of SC signals were combined to construct composite time series. The magnitude of the mean of composite signals provides an indication of the strength of phase-amplitude coupling. To estimate the SD of cross-frequency coupling measures, this analysis was repeated 20 times with randomly shifted SC-amplitude time series. Finally, the modulation index was defined as the mean of composite time-frequency signals expressed in terms of the SD of randomly shifted data.
Supplementary Material
Acknowledgments
We would like to thank D. Bystron for assistance throughout experiments. Funding: This research was supported by funding from the German Research Foundation (DFG) (GRK 1246/1-2; SFB 936/A2; SPP 1665/EN/533/13-1; A.K.E.). Author contributions: I.S. and A.K.E. conceived and designed experiments. I.S. and F.P. performed experiments. I.S. and E.G.-L. analyzed data. G.E. wrote animal ethics permission. E.F. and T.S. designed and developed μECoG arrays. I.S., E.G.-L., and A.K.E. prepared the manuscript. Competing interests: The authors declare that they have no competing interests.
SUPPLEMENTARY MATERIALS
Supplementary material for this article is available at http://advances.sciencemag.org/cgi/content/full/1/7/e1500229/DC1
Fig. S1. Population average power spectra of μECoG, SC, and intracortical recording sites.
Fig. S2. SC current source density analysis.
Fig. S3. Large-scale structure of envelope coupling modes.
Fig. S4. Temporal variability of cortico-tectal high-frequency amplitude envelope correlation.
Fig. S5. Cortical depth profile.
Fig. S6. Effects of breathing on coordinated neural activity.
Fig. S7. Cross-frequency coupling spectra and locally re-referenced signals.
Fig. S8. Spatial maps of slow oscillation coherence.
REFERENCES AND NOTES
- 1.Arieli A., Sterkin A., Grinvald A., Aertsen A., Dynamics of ongoing activity: Explanation of the large variability in evoked cortical responses. Science 273, 1868–1871 (1996). [DOI] [PubMed] [Google Scholar]
- 2.Deco G., Corbetta M., The dynamical balance of the brain at rest. Neuroscientist. 17, 107–123 (2011). [DOI] [PMC free article] [PubMed] [Google Scholar]
- 3.Engel A. K., Gerloff C., Hilgetag C. C., Nolte G., Intrinsic coupling modes: Multiscale interactions in ongoing brain activity. Neuron 80, 867–886 (2013). [DOI] [PubMed] [Google Scholar]
- 4.Hipp J. F., Hawellek D. J., Corbetta M., Siegel M., Engel A. K., Large-scale cortical correlation structure of spontaneous oscillatory activity. Nat. Neurosci. 15, 884–890 (2012). [DOI] [PMC free article] [PubMed] [Google Scholar]
- 5.He B. J., Snyder A. Z., Zempel J. M., Smyth M. D., Raichle M. E., Electrophysiological correlates of the brain’s intrinsic large-scale functional architecture. Proc. Natl. Acad. Sci. U.S.A. 105, 16039–16044 (2008). [DOI] [PMC free article] [PubMed] [Google Scholar]
- 6.Fox M. D., Snyder A. Z., Vincent J. L., Corbetta M., Van Essen D. C., Raichle M. E., The human brain is intrinsically organized into dynamic, anticorrelated functional networks. Proc. Natl. Acad. Sci. U.S.A. 102, 9673–9678 (2005). [DOI] [PMC free article] [PubMed] [Google Scholar]
- 7.Betti V., Della Penna S., de Pasquale F., Mantini D., Marzetti L., Romani G. L., Corbetta M., Natural scenes viewing alters the dynamics of functional connectivity in the human brain. Neuron 79, 782–797 (2013). [DOI] [PMC free article] [PubMed] [Google Scholar]
- 8.Phillips J. M., Vinck M., Everling S., Womelsdorf T., A long-range fronto-parietal 5- to 10-Hz network predicts “top-down” controlled guidance in a task-switch paradigm. Cereb. Cortex 24, 1996–2008 (2014). [DOI] [PMC free article] [PubMed] [Google Scholar]
- 9.Watrous A. J., Tandon N., Conner C. R., Pieters T., Ekstrom A. D., Frequency-specific network connectivity increases underlie accurate spatiotemporal memory retrieval. Nat. Neurosci. 16, 349–356 (2013). [DOI] [PMC free article] [PubMed] [Google Scholar]
- 10.Nir Y., Mukamel R., Dinstein I., Privman E., Harel M., Fisch L., Gelbard-Sagiv H., Kipervasser S., Andelman F., Neufeld M. Y., Kramer U., Arieli A., Fried I., Malach R., Interhemispheric correlations of slow spontaneous neuronal fluctuations revealed in human sensory cortex. Nat. Neurosci. 11, 1100–1108 (2008). [DOI] [PMC free article] [PubMed] [Google Scholar]
- 11.Bruns A., Eckhorn R., Task-related coupling from high- to low-frequency signals among visual cortical areas in human subdural recordings. Int. J. Psychophysiol. 51, 97–116 (2004). [DOI] [PubMed] [Google Scholar]
- 12.Parvizi J., Corticocentric myopia: Old bias in new cognitive sciences. Trends Cogn. Sci. 13, 354–359 (2009). [DOI] [PubMed] [Google Scholar]
- 13.Manger P. R., Restrepo C. E., Innocenti G. M., The superior colliculus of the ferret: Cortical afferents and efferent connections to dorsal thalamus. Brain Res. 1353, 74–85 (2010). [DOI] [PubMed] [Google Scholar]
- 14.Berman R. A., Wurtz R. H., Signals conveyed in the pulvinar pathway from superior colliculus to cortical area MT. J. Neurosci. 31, 373–384 (2011). [DOI] [PMC free article] [PubMed] [Google Scholar]
- 15.Nakamura H., Itoh K., Cytoarchitectonic and connectional organization of the ventral lateral geniculate nucleus in the cat. J. Comp. Neurol. 473, 439–462 (2004). [DOI] [PubMed] [Google Scholar]
- 16.Abramson B. P., Chalupa L. M., Multiple pathways from the superior colliculus to the extrageniculate visual thalamus of the cat. J. Comp. Neurol. 271, 397–418 (1988). [DOI] [PubMed] [Google Scholar]
- 17.Baldwin M. K. L., Wong P., Reed J. L., Kaas J. H., Superior colliculus connections with visual thalamus in gray squirrels (Sciurus carolinensis): Evidence for four subdivisions within the pulvinar complex. J. Comp. Neurol. 519, 1071–1094 (2011). [DOI] [PMC free article] [PubMed] [Google Scholar]
- 18.Harting J. K., Updyke B. V., Van Lieshout D. P., Corticotectal projections in the cat: Anterograde transport studies of twenty-five cortical areas. J. Comp. Neurol. 379414, 14998–15008 (1992). [DOI] [PubMed] [Google Scholar]
- 19.Stitt I., Galindo-Leon E., Pieper F., Engler G., Engel A. K., Laminar profile of visual response properties in ferret superior colliculus. J. Neurophysiol. 110, 1333–1345 (2013). [DOI] [PubMed] [Google Scholar]
- 20.Berson D., Retinal and cortical inputs to cat superior colliculus: Convergence and laminar specificity. Prog. Brain Res. 75, 17–26 (1988). [DOI] [PubMed] [Google Scholar]
- 21.Steriade M., Nuñez A., Amzica F., A novel slow (< 1 Hz) oscillation of neocortical neurons in vivo: Depolarizing and hyperpolarizing components. J. Neurosci. 73, 3252–3265 (1993). [DOI] [PMC free article] [PubMed] [Google Scholar]
- 22.Crunelli V., Hughes S. W., The slow (<1 Hz) rhythm of non-REM sleep: A dialogue between three cardinal oscillators. Nat. Neurosci. 13, 9–17 (2010). [DOI] [PMC free article] [PubMed] [Google Scholar]
- 23.Harting J. K., Huerta M. F., Hashikawa T., Weber J. T., Van Lieshout D. P., Neuroanatomical studies of the nigrotectal projection in the cat. J. Comp. Neurol. 278, 615–631 (1988). [DOI] [PubMed] [Google Scholar]
- 24.Kemel M. L., Desban M., Gauchy C., Glowinski J., Besson M. J., Topographical organization of efferent projections from the cat substantia nigra pars reticulata. Brain Res. 455, 307–323 (1988). [DOI] [PubMed] [Google Scholar]
- 25.Conley M., Friedekich-Ecsy B., Functional organization of the ventral lateral geniculate complex of the tree shrew (Tupaia belangeri): II. Connections with the cortex, thalamus, and brainstem. J. Comp. Neurol. 328, 21–42 (1993). [DOI] [PubMed] [Google Scholar]
- 26.Lugo-Garcia N., Kicliter E., Superior colliculus efferents to five subcortical visual system structures in the ground squirrel. Brain Res. 426, 131–141 (1987). [DOI] [PubMed] [Google Scholar]
- 27.G. Buzsàki, Rhythms of the Brain (Oxford Univ. Press, New York, 2006). [Google Scholar]
- 28.Penttonen M., Buzsáki G., Natural logarithmic relationship between brain oscillators. Thalamus Relat. Syst. 2, 145–152 (2003). [Google Scholar]
- 29.Von Stein A., Chiang C., König P., Top-down processing mediated by interareal synchronization. Proc. Natl. Acad. Sci. U.S.A. 97, 14748–14753 (2000). [DOI] [PMC free article] [PubMed] [Google Scholar]
- 30.Lyon D. C., Nassi J. J., Callaway E. M., A disynaptic relay from superior colliculus to dorsal stream visual cortex in macaque monkey. Neuron 65, 270–279 (2010). [DOI] [PMC free article] [PubMed] [Google Scholar]
- 31.Warner C. E., Kwan W. C., Wright D., Johnston L. A., Egan G. F., Bourne J. A., Preservation of vision by the pulvinar following early-life primary visual cortex lesions. Curr. Biol. 25, 424–434 (2015). [DOI] [PubMed] [Google Scholar]
- 32.Brecht M., Singer W., Engel A. K., Correlation analysis of corticotectal interactions in the cat visual system. J. Neurophysiol. 79, 2394–2407 (1998). [DOI] [PubMed] [Google Scholar]
- 33.Marín G. J., Duran E., Morales C., Gonzalez-Cabrera C., Sentis E., Mpodozis J., Letelier J. C., Attentional capture? Synchronized feedback signals from the isthmi boost retinal signals to higher visual areas. J. Neurosci. 32, 1110–1122 (2012). [DOI] [PMC free article] [PubMed] [Google Scholar]
- 34.Wallace M. T., Meredith M. A., Stein B. E., Converging influences from visual, auditory, and somatosensory cortices onto output neurons of the superior colliculus. J. Neurophysiol. 69, 1797–1809 (1993). [DOI] [PubMed] [Google Scholar]
- 35.Luksch H., Cytoarchitecture of the avian optic tectum: Neuronal substrate for cellular computation. Rev. Neurosci. 14, 85–106 (2003). [DOI] [PubMed] [Google Scholar]
- 36.Collins C. E., Leitch D. B., Wong P., Kaas J. H., Herculano-Houzel S., Faster scaling of visual neurons in cortical areas relative to subcortical structures in non-human primate brains. Brain Struct. Funct. 218, 805–816 (2013). [DOI] [PMC free article] [PubMed] [Google Scholar]
- 37.Sridharan D., Boahen K., Knudsen E. I., Space coding by gamma oscillations in the barn owl optic tectum. J. Neurophysiol. 105, 2005–2017 (2011). [DOI] [PMC free article] [PubMed] [Google Scholar]
- 38.Goddard C. A., Sridharan D., Huguenard J. R., Knudsen E. I., Gamma oscillations are generated locally in an attention-related midbrain network. Neuron 73, 567–580 (2012). [DOI] [PMC free article] [PubMed] [Google Scholar]
- 39.Neuenschwander S., Singer W., Long-range synchronization of oscillatory light responses in the cat retina and lateral geniculate nucleus. Nature 379, 728–732 (1996). [DOI] [PubMed] [Google Scholar]
- 40.Fukushima M., Saunders R. C., Leopold D. A., Mishkin M., Averbeck B. B., Spontaneous high-gamma band activity reflects functional organization of auditory cortex in the awake macaque. Neuron 74, 899–910 (2012). [DOI] [PMC free article] [PubMed] [Google Scholar]
- 41.Kenet T., Bibitchkov D., Tsodyks M., Grinvald A., Arieli A., Spontaneously emerging cortical representations of visual attributes. Nature 425, 954–956 (2003). [DOI] [PubMed] [Google Scholar]
- 42.Hutchison R. M., Womelsdorf T., Allen E. A., Bandettini P. A., Calhoun V. D., Corbetta M., Della Penna S., Duyn J. H., Glover G. H., Gonzalez-Castillo J., Handwerker D. A., Keilholz S., Kiviniemi V., Leopold D. A., de Pasquale F., Sporns O., Walter M., Chang C., Dynamic functional connectivity: Promise, issues, and interpretations. Neuroimage 80, 360–378 (2013). [DOI] [PMC free article] [PubMed] [Google Scholar]
- 43.Vincent J. L., Patel G. H., Fox M. D., Snyder A. Z., Baker J. T., Van Essen D. C., Zempel J. M., Snyder L. H., Corbetta M., Raichle M. E., Intrinsic functional architecture in the anaesthetized monkey brain. Nature 447, 83–86 (2007). [DOI] [PubMed] [Google Scholar]
- 44.Steriade M., Nuñez A., Amzica F., Intracellular analysis of relations between the slow (< 1 Hz) neocortical oscillation and other sleep rhythms of the electroencephalogram. J. Neurosci. 13, 3266–3283 (1993). [DOI] [PMC free article] [PubMed] [Google Scholar]
- 45.Sanchez-Vives M. V., McCormick D. A., Cellular and network mechanisms of rhythmic recurrent activity in neocortex. Nat. Neurosci. 3, 1027–1034 (2000). [DOI] [PubMed] [Google Scholar]
- 46.Mölle M., Born J., Slow oscillations orchestrating fast oscillations and memory consolidation. Prog. Brain Res. 193, 93–110 (2011). [DOI] [PubMed] [Google Scholar]
- 47.Lewis L., Weiner V., Mukamel E., Donoghue J., Eskandar E., Madsen J., Anderson W., Hochberg L., Cash S., Brown E., Purdon P., Rapid fragmentation of neuronal networks at the onset of propofol-induced unconsciousness. Proc. Natl. Acad. Sci. U.S.A. 109, 3377–3386 (2012). [DOI] [PMC free article] [PubMed] [Google Scholar]
- 48.Contreras D., Steriade M., Cellular basis of EEG slow rhythms: A study of dynamic corticothalamic relationships. J. Neurosci. 15, 604–622 (1995). [DOI] [PMC free article] [PubMed] [Google Scholar]
- 49.Cowan R. L., Wilson C. J., Spontaneous firing patterns and axonal projections of single corticostriatal neurons in the rat medial agranular cortex. J. Neurophysiol. 71, 17–32 (1994). [DOI] [PubMed] [Google Scholar]
- 50.Magill P. J., Bolam J. P., Bevan M. D., Relationship of activity in the subthalamic nucleus–globus pallidus network to cortical electroencephalogram. J. Neurosci. 20, 820–833 (2000). [DOI] [PMC free article] [PubMed] [Google Scholar]
- 51.Timofeev I., Steriade M., Low-frequency rhythms in the thalamus of intact-cortex and decorticated cats. J. Neurophysiol. 76, 4152–4168 (1996). [DOI] [PubMed] [Google Scholar]
- 52.Ros H., Sachdev R. N., Yu Y., Sestan N., McCormick D. A., Neocortical networks entrain neuronal circuits in cerebellar cortex. J. Neurosci. 29, 10309–10320 (2009). [DOI] [PMC free article] [PubMed] [Google Scholar]
- 53.Mena-Segovia J., Sims H. M., Magill P. J., Bolam J. P., Cholinergic brainstem neurons modulate cortical gamma activity during slow oscillations. J. Physiol. 586, 2947–2960 (2008). [DOI] [PMC free article] [PubMed] [Google Scholar]
- 54.Miller A. M., Obermeyer W. H., Behan M., Benca R. M., The superior colliculus–pretectum mediates the direct effects of light on sleep. Proc. Natl. Acad. Sci. U.S.A. 95, 8957–8962 (1998). [DOI] [PMC free article] [PubMed] [Google Scholar]
- 55.Ferron J.-F., Kroeger D., Chever O., Amzica F., Cortical inhibition during burst suppression induced with isoflurane anesthesia. J. Neurosci. 29, 9850–9860 (2009). [DOI] [PMC free article] [PubMed] [Google Scholar]
- 56.Ray S., Maunsell J. H. R., Different origins of gamma rhythm and high-gamma activity in macaque visual cortex. PLOS Biol. 9, e1000610 (2011). [DOI] [PMC free article] [PubMed] [Google Scholar]
- 57.Manning J. R., Jacobs J., Fried I., Kahana M. J., Broadband shifts in local field potential power spectra are correlated with single-neuron spiking in humans. J. Neurosci. 29, 13613–13620 (2009). [DOI] [PMC free article] [PubMed] [Google Scholar]
- 58.Buzsáki G., Anastassiou C. A., Koch C., The origin of extracellular fields and currents—EEG, ECoG, LFP and spikes. Nat. Rev. Neurosci. 13, 407–420 (2012). [DOI] [PMC free article] [PubMed] [Google Scholar]
- 59.Szczepanski S. M., Crone N. E., Kuperman R. A., Auguste K. I., Parvizi J., Knight R. T., Dynamic changes in phase-amplitude coupling facilitate spatial attention control in fronto-parietal cortex. PLOS Biol. 12, e1001936 (2014). [DOI] [PMC free article] [PubMed] [Google Scholar]
- 60.Khodagholy D., Gelinas J. N., Thesen T., Doyle W., Devinsky O., Malliaras G. G., Buzsáki G., NeuroGrid: Recording action potentials from the surface of the brain. Nat. Neurosci. 18, 310–315 (2014). [DOI] [PMC free article] [PubMed] [Google Scholar]
- 61.Trevelyan A. J., The direct relationship between inhibitory currents and local field potentials. J. Neurosci. 29, 15299–15307 (2009). [DOI] [PMC free article] [PubMed] [Google Scholar]
- 62.Rubehn B., Bosman C., Oostenveld R., Fries P., Stieglitz T., A MEMS-based flexible multichannel ECoG-electrode array. J. Neural Eng. 6, 036003 (2009). [DOI] [PubMed] [Google Scholar]
- 63.Stitt I., Galindo-Leon E., Pieper F., Hollensteiner K. J., Engler G., Engel A. K., Auditory and visual interactions between the superior and inferior colliculi in the ferret. Eur. J. Neurosci. 41, 1311–1320 (2015). [DOI] [PubMed] [Google Scholar]
- 64.Quiroga R. Q., Nadasdy Z., Ben-Shaul Y., Unsupervised spike detection and sorting with wavelets and superparamagnetic clustering. Neural Comput. 16, 1661–1687 (2004). [DOI] [PubMed] [Google Scholar]
- 65.Oostenveld R., Fries P., Maris E., Schoffelen J.-M., FieldTrip: Open source software for advanced analysis of MEG, EEG, and invasive electrophysiological data. Comput. Intell. Neurosci. 2011, 156869 (2011). [DOI] [PMC free article] [PubMed] [Google Scholar]
- 66.Lachaux J. P., Rodriguez E., Martinerie J., Varela F. J., Measuring phase synchrony in brain signals. Hum. Brain Mapp. 8, 194–208 (1999). [DOI] [PMC free article] [PubMed] [Google Scholar]
- 67.N. I. Fisher, Statistical Analysis of Circular Data (Cambridge Univ. Press, Cambridge, UK, 1995). [Google Scholar]
- 68.Canolty R. T., Edwards E., Dalal S. S., Soltani M., Nagarajan S. S., Kirsch H. E., Berger M. S., Barbaro N. M., Knight R. T., High gamma power is phase-locked to theta oscillations in human neocortex. Science 313, 1626–1628 (2006). [DOI] [PMC free article] [PubMed] [Google Scholar]
Associated Data
This section collects any data citations, data availability statements, or supplementary materials included in this article.
Supplementary Materials
Supplementary material for this article is available at http://advances.sciencemag.org/cgi/content/full/1/7/e1500229/DC1
Fig. S1. Population average power spectra of μECoG, SC, and intracortical recording sites.
Fig. S2. SC current source density analysis.
Fig. S3. Large-scale structure of envelope coupling modes.
Fig. S4. Temporal variability of cortico-tectal high-frequency amplitude envelope correlation.
Fig. S5. Cortical depth profile.
Fig. S6. Effects of breathing on coordinated neural activity.
Fig. S7. Cross-frequency coupling spectra and locally re-referenced signals.
Fig. S8. Spatial maps of slow oscillation coherence.