

Abstract
Statistical regularities in the causal structure of the environment enable us to predict the probable outcomes of our actions. Environments differ in the extent to which action-outcome contingencies are stable or volatile. Difficulty in being able to use this information to optimally update outcome predictions might contribute to the decision-making difficulties seen in anxiety. We tested this using an aversive learning task manipulating environmental volatility. Low trait anxious human participants matched updating of their outcome predictions to the volatility of the current environment, as predicted by a Bayesian model. High trait anxious individuals showed less ability to adjust updating of outcome expectancies between stable and volatile environments. This was linked to reduced sensitivity of the pupil dilatory response to volatility, potentially indicative of altered norepinephrinergic responsivity to changes in this aspect of environmental information.
From what to eat, which task to prioritize, whether to call a friend, go on a date or book a family holiday, the decisions we take are guided by what we expect the outcomes of those decisions to be. Sometimes it can seem extremely difficult to work out which course of action is least likely to result in a feared outcome, whether avoiding being the one made redundant or preventing an argument turning into a breakup. Individuals who suffer from anxiety focus disproportionately on the potential occurrence of future negative outcomes and whether or not they can be averted. Attempts to understand this have led to suggestions that anxiety may be linked to difficulty in estimating the probability or severity of future negative events or in combining these estimates when choosing between actions1–3. Advances in computational modeling provide us with the tools to investigate which of the mechanisms involved in decision-making are disrupted in anxious individuals.
There are often times when the correct course of action seems unclear – and indeed our best choice of what to do leads unexpectedly to an aversive outcome. This may in turn lead to the next decision being harder still – should one switch behavioral patterns or stay one’s course? Anxious individuals are reported to be highly intolerant of situations characterized by uncertainty as to what will happen or which course of action should be followed4,5. They are more likely to endorse finding such situations distressing, leading to a sense of immobilization4,5. One possible explanation for this is that individuals prone to anxiety may have difficulty estimating outcome likelihood when there are sources of uncertainty complicating the action-outcome relationship.
In the context of decision-making models, a number of alternate forms of uncertainty are recognized6–8. Here, we focus upon two types. One source of uncertainty is produced by noise in the relationship between actions and outcomes, such as occurs if an action only leads to a given outcome on a proportion of the occasions it is performed. A second source of uncertainty is produced when the underlying causal structure is non-stationary, or volatile, for example when action-outcome contingencies switch and an action that was primarily associated with a given outcome becomes predominantly associated with another. If unexpected or ‘surprising’ outcomes are caused by noise, then current action choices are optimally determined by averaging over the outcomes of many previous actions. In contrast, if surprising outcomes are caused by a change in action-outcome contingencies within a volatile environment, then only the most recent events should be used to guide action choice6. In terms of formal reinforcement accounts of learning9,10, a higher learning rate should be implemented when the environment is volatile than when it is stable. Computational studies of decision-making reveal that healthy volunteers do indeed adapt their learning rate in response to changes in environmental volatility8,11. Specifically, the behavior of participants is consistent with faster updating of action-outcome contingencies in volatile than in stable environments. This change in learning behavior occurs even when changes in environmental volatility are not explicitly cued and has been shown to closely track an optimal Bayesian decision-making strategy8,11.
Individuals prone to anxiety might either show a general deficit in updating action-outcome estimates following unexpected aversive outcomes or a specific problem with adjusting the speed of updating (i.e. learning rate) to reflect the stability or volatility of the current environment. Recent Pavlovian fear conditioning findings indicate that trait anxious individuals struggle to adjust fear down-regulation to reflect changes in stimulus-stimulus contingencies between contexts12. If individuals prone to anxiety have a particular difficulty in processing contingencies that change over time or between contexts, we might predict that they will show a deficit in using changes in environmental volatility to infer whether or not action-outcome contingencies have changed, and to alter their behavioral choices accordingly. Such a deficit would mean difficulty in differentiating contexts or periods of time in which unexpected aversive outcomes should be ignored as chance events and those where unexpected aversive outcomes are likely to signal a change in action-outcome contingencies and as such should lead to a change in action. This could potentially explain why individuals at trait risk for anxiety show intolerance of uncertainty, hesitation and poor decision-making in real-life settings where the relationship between alternate courses of actions and avoidance of future negative events is often uncertain.
Our primary hypothesis was hence that, when attempting to avoid aversive outcomes, high trait anxious individuals would be less able than low trait anxious individuals to adjust their updating of action-outcome contingencies in response to changes in environmental volatility. We focused on individual differences in trait anxiety in order to investigate mechanisms that might convey vulnerability to anxiety disorders, without the confounding effects of psychotropic medication or chronic illness. We used an aversive learning task that consisted of two blocks - in one the relationship between participants’ actions and the outcomes of those actions was stable, in the other this relationship was volatile, repeatedly changing over time. This was equivalent in design to a previously used task8 but with action choice to gain financial reward replaced by action choice to avoid bursts of electrical stimulation. The difference in participants’ learning rate between the stable and volatile task blocks provided a measure of participants’ ability to adapt their learning to changes in environmental volatility. We predicted that the difference in learning rate between stable and volatile task blocks would be reduced in high trait anxious individuals.
Recent findings indicate that pupil dilation may track important changes in the causal statistics of the environment including changes in environmental volatility13,14. This adds to accounts arguing that pupil diameter may reflect, among other influences, activity of the locus coeruleus norepinephrine system15–17 and models proposing norepinephrinergic control over the learning of environmental uncertainty6. Given these findings, and established reports of altered norepinephrinergic function in anxiety18,19, we additionally hypothesized that trait anxiety-related deficits in differential learning between volatile and stable task blocks would be accompanied by a reduced pupil dilatory response to environmental volatility.
In line with our predictions, high trait anxious individuals showed a specific deficit in adjusting learning rate in response to changes in environmental volatility within our aversive learning task. This was associated with a reduced pupil response to trial-wise estimates of environmental volatility. These results provide evidence that trait vulnerability to anxiety is associated with impoverished use of environmental statistics, especially that pertaining to environmental volatility, to determine the extent to which to update action-outcome contingencies when attempting to avoid aversive outcomes. This may represent a core deficit underlying impoverished decision-making in individuals at elevated risk of developing anxiety disorders.
Results
Thirty one participants (22 females) screened to have a range of scores on the Spielberger State-Trait Anxiety Inventory (STAI20) trait subscale completed an isoluminant version of a two-armed bandit learning task8 in which outcomes were moderately painful electrical shocks. Before participants completed the task, the intensity of the electrical shocks were calibrated, so that the maximum level administered had a subjective pain level of 7/10 on a scale of 1 (minimal pain) to 10 (worst possible pain), see online Methods and Fig. S1.
On each trial, participants had to choose one of two shaped, isoluminant, gabor patches - either of which might result in the delivery of an electrical shock (Fig 1a). In the stable task block, one of the two shapes consistently predicted shock delivery with a probability of 75%, the other shape resulting in shock delivery on the remaining trials. In the volatile task block, the shape most predictive of shock delivery reversed on five occasions within the block (Fig 1b). On each trial, each shape was associated with a specific magnitude of electrical shock that would be delivered if the shape was chosen and if it resulted in shock administration on that trial. This magnitude was displayed in the centre of each shape. Magnitude values were scaled between 1 and 99, where 1 equated to a subjective pain level of 1, and 99 to a subjective pain level of 7. The trial-wise magnitudes of the shocks for each shape were chosen from independent random distributions (see online Methods). To perform the task optimally participants had to integrate the information about shock magnitude and shock probability, the latter needing to be inferred from the outcome of previous trials. The shape chosen and time taken to select it was recorded. Pupil dilatory responses were also measured. Due to equipment failure, behavioral and pupil data were lost from one participant (excluded) and pupil data from two further participants.
Figure 1. Task Structure.
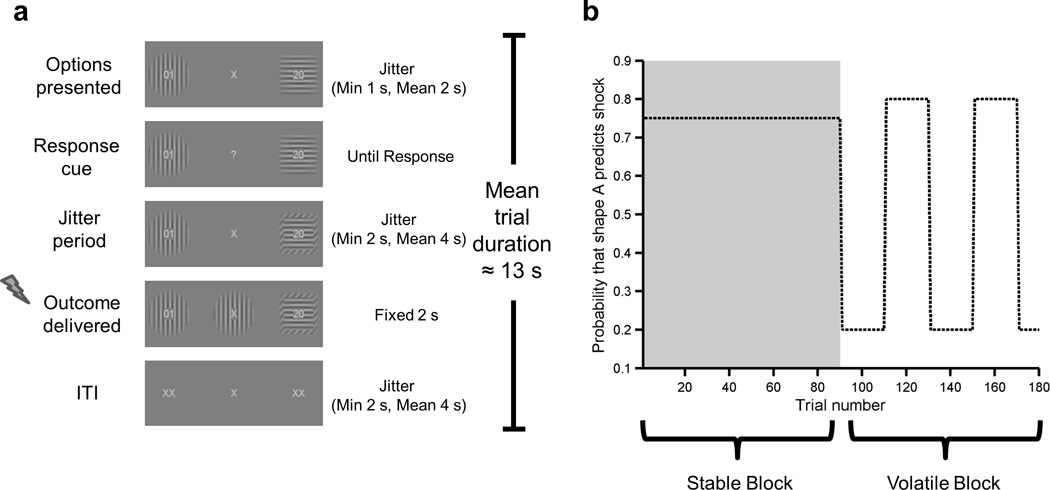
a) Example trial. Participants had to choose one of two shaped Gabor patches. Each shape contained a two digit number which indicated the magnitude of electrical shock that might be received should that shape be chosen. Following option presentation, onset of a response cue indicated that participants could make their choice. After response, a variable interval was followed by outcome delivery. The shape associated with the electrical shock for that trial was displayed in the centre of the screen for 2s. If the participant had chosen this shape, an electrical shock of the indicated magnitude was delivered at the onset of the outcome period. b) Outcome probabilities across the course of the task. The task comprised two blocks. In the stable block (shaded), one shape (for example, the circle) had a 75% probability of resulting in an electrical shock being delivered, if it was chosen; the other shape (e.g. a square) has a 25% probability of resulting in shock delivery. In the volatile block (unshaded) the probability that choice of a given shape would result in shock delivery switched every 20 trials between 80% and 20%. Participants were randomly assigned to complete the task with the stable block first (as shown), or with the volatile block first.
Effect of Environmental Volatility on Learning Rate
Learning rate ‘α’ reflects the extent to which participants’ choice behaviour is guided by the outcomes of recent actions versus those further back in the individual’s experience. At high learning rates, choice behaviour is strongly controlled by the outcomes of recent actions. More precisely, the difference between the expected and actual outcome on a given trial has a large impact on change in outcome expectancy and hence subsequent choice behaviour. In contrast, at low learning rates, surprising outcomes lead to little change in outcome expectancy and behaviour. In the current study, we estimated participants’ learning rates in the stable and volatile task blocks by fitting a simple Rescorla Wagner learning model to their choices in each task block (see online Methods and Supplementary Modeling Note). We assessed whether participants, as a group, adapted their learning rate in response to the change in environmental volatility between the stable and volatile blocks. Consistent with prior findings for reward8, which we replicated (Fig S2a), participants’ learning rates were higher in the volatile than stable blocks of our aversive learning task, F(1,28)=16.3, p<0.001 (Fig 2a), regardless of the order in which the two blocks were completed, F(1,28)=1.0, p=0.3.
Figure 2. Estimates of Participants’ Learning Rates.
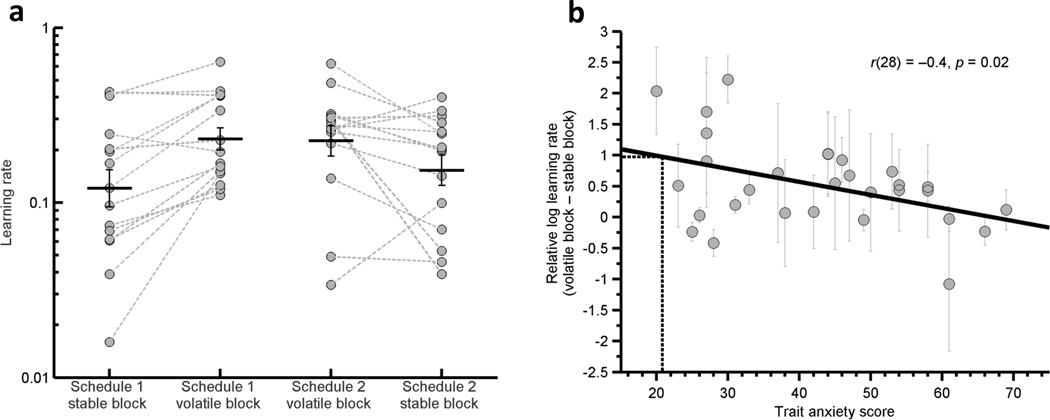
a) Participants’ choices during the stable and volatile blocks of the aversive learning task were fitted with a Rescorla Wagner learning model in which learning rate was allowed to vary. Estimates of individual participants’ learning rates are displayed (circles) separately for the stable and volatile blocks for the two task schedules (Schedule 1= stable task block first, n=15, Schedule 2 = volatile task block first, n=15). A logarithmic scale is used. Black lines display mean (+−SEM) of participant learning rates, grey dotted lines link the learning rates in volatile and stable blocks for each participant. Participants showed higher learning rates in the volatile versus stable blocks regardless of the order in which they were completed, F(1,28)=16.3, p<0.001. b) The relative log learning rate for the volatile versus the stable blocks (i.e. log (LR in volatile block) – log (LR in stable block)) was negatively correlated with participant trait anxiety, r(28)=−0.42, p= 0.02. The black dotted line indicates the degree to which the model of an optimal Bayesian learner (as described by Behrens and colleagues8) adjusted its learning rate. As can be seen, low trait anxious participants altered their learning rates to a similar degree to the Bayesian Learner, with high trait anxious participants showing a reduced adaptation of learning rate between the volatile and stable blocks of the task. Error bars represent the standard deviation of the estimated parameters from the behavioral model for each subject.
In addition to updating their expectancies or ‘beliefs’ to reflect current action-outcome contingencies, participants needed to transform these beliefs into action choices. We formally described this process using a softmax action selector model which contains two free parameters: a risk preference term which controls the relative weight of outcome probability versus shock magnitude used in the calculation of expected value (i.e. whether a given participant tends to prefer low probability high magnitude shocks over high probability low magnitude shocks), and an inverse decision temperature term - an estimate of the extent to which calculations of expected value influence choice8 (see Supplementary Modeling Note for evaluation of model fit and comparison with alternate models). Across participants, there was no effect of block volatility, block order or their interaction upon either of these parameters, ps > 0. 1. This indicates that the effect of the task volatility manipulation was confined to participants’ learning rates, in line with expectations given previous findings8. An additional illustration of the effect of the volatility manipulation on participant choice behavior that complements the learning rate analyses presented above (Fig 2a) can be found in Figure S3a. This figure shows how the impact of recent outcomes (n–1 to n–5) on current shape choice differed between blocks in line with predictions from learning theory (i.e. greater weight being given to information about recent outcomes when the environment was volatile than when it was stable).
Trait anxiety is linked to reduced adaptation of learning rate
In line with our predictions, elevated trait anxiety was associated with a reduced change in learning rate between blocks, r(28)=−0.42, p= 0.02, Fig 2b. The effect of anxiety was only seen upon the change in learning rate between stable and volatile blocks; there was no significant relationship between anxiety and mean learning rate across blocks, r(28)=0.1, p=0.6, or with learning rate within each block, volatile block r(28)=−0.1, p=0.6, stable block r(28)=0.26, p=0.16. In other words, low trait anxious individuals were able to adjust their learning appropriately between blocks, learning (i.e. updating outcome estimates) fast when the world was fast-changing and slowly when the world was stable. By contrast, high trait anxious individuals were not able to learn in this flexible manner, instead learning similarly in both blocks. It is of note that mean learning rate was not modulated by trait anxiety. This suggests that high trait anxious individuals did succeed in updating outcome expectancies following surprising outcomes, but that they were unable to modulate this based on the volatility of the current environment.
The optimal adjustment of learning rate between stable and volatile conditions has previously been formally described within a Bayesian framework for a reward-based version of the task used here8. In this prior study, participants’ behavior closely tracked that of an ‘ideal Bayesian learner’. In the current study, we used the same Bayesian formalization to provide an estimate of the information available to participants during the aversive learning task and the degree to which learning rate should be adjusted between blocks (see online Methods and Supplementary Modeling Note). Participants with low levels of trait anxiety altered their learning rate between the stable and volatile blocks to an equivalent degree to the ideal Bayesian learner8. As trait anxiety levels increased, participants diverged increasingly from the optimal change in learning rate between stable and volatile blocks described by the Bayesian learner model (Fig. 2b), showing reduced adaptation of learning rate. Additional modeling revealed that even when multiple parameters, including a decay term, were allowed to compete for influence over a dynamic learning rate, trait anxiety was uniquely associated with a reduction in the influence of environmental volatility (see Supplementary Modeling Note and Figure S4.)
As outlined earlier, when learning rate is high, recent trial outcomes inform behavioral choice to a greater extent. Plots illustrating how prior trial outcomes impacted participants’ choice behavior as a function of block type (volatile or stable) and anxiety level can be found in Figure S3c,d. These plots illustrate that, in line with elevated trait anxiety being associated with reduced adaptation of learning rate, high trait anxious individuals showed less adjustment between volatile and stable blocks in their use of recent trial outcomes to inform choices than low trait anxious individuals.
An additional illustration of the consequences of non-optimal learning for actual choice behavior is provided by consideration of performance upon those trials where choice is hardest. Following previous work8, this was defined as those trials with a difference in expected value between the two alternatives of 5 or less. Trait anxiety was significantly positively associated with the number of shocks received on these trials, r(28)=0.37, p=0.02, 1-tailed, (Fig. S5a). Further, across participants, the number of shocks received on these ‘difficult’ trials was negatively correlated with extent of adaptation of learning rate between stable and volatile blocks, r(28)=−0.31, p=0.05, 1-tailed, (Fig. S5b).
For completeness, we additionally examined whether estimates of the risk preference and decision temperature parameters from the softmax action selector model varied as a function of participant trait anxiety levels. There was no significant relationship between trait anxiety and these parameter estimates across or within blocks, or as a function of block type, ps>.1 (Fig. S6). Further, the relationship between trait anxiety and change in learning rate between blocks remained significant when controlling for either change in decision temperature, rpartial(27)=−0.38, p= 0.04, or risk preference, rpartial(27)=−0.41, p= 0.03.
Responses to Surprising Outcomes are not modulated by Trait Anxiety
Adaptation to environmental volatility requires processing of the surprise value or unexpectedness of the chosen action’s outcome, and assessment as to whether or not there has been a change in action-outcome contingencies. This may be an implicit and not an explicit process. One possibility is that trait anxious individuals’ difficulty in adapting to changes in environmental volatility within our aversive learning task might arise secondarily to a more general deficit in processing the surprise value of outcomes. As outlined above, this seems unlikely given that there was no effect of trait anxiety upon mean learning rate across task blocks. To further investigate this, we examined whether trait anxiety modulated choice reaction time as a function of the surprise value of the previous trial’s outcome. Within the reinforcement learning literature, it has been reported that when an outcome is surprising, participants typically show slowed decision making on the subsequent trial21. In line with this we observed that, across participants, surprising outcomes were indeed associated with slowed choice reaction times on the subsequent trial (i.e. across participants, the beta weight of outcome surprise on trial n on individual participant’s reaction times on trial n+1 differed significantly from zero), t(29)=2.3, p=0.03 (see online methods). However, the effect of surprise on participants’ reaction times was not modulated by participant trait anxiety, r(28)=0.1, p=0.5. This finding is consistent with high trait anxious participants being specifically insensitive to changes in environmental volatility rather than simply unable to process surprising outcomes. In these analyses, trial-wise outcome surprise was calculated, using the Bayesian learner, by taking the negative logarithm of the conditional probability of the outcome observed given the prior estimated probability of (i.e. ‘belief’ in) that outcome22 (see online Methods and Supplementary Modeling Note). An alternate version of these analyses using a non-Bayesian measure of surprise produced similar results (Fig. S7a).
Pupil Dilation Tracks both Volatility and Surprise
Recent accounts describe an increase in pupil dilation in response to both environmental volatility and outcome surprise13,14,23. Prior to examining differences between high and low trait anxious individuals, we sought to establish, at a cross-group level, the pupil dilatory response to volatility and outcome surprise within our current study.
Trial-wise pupil responses to choice outcome were baseline corrected (see online Methods). The post-outcome period was sampled using 6000 1ms bins. Regression analyses were conducted for each of these bins to examine the extent to which trial-wise estimates of volatility and outcome surprise derived from the Bayesian learner predicted pupil dilation (controlling for outcome, i.e. shock or no shock, shock magnitude, and expected value of the chosen and unchosen shape). These regression analyses produced two timeseries of beta-weights - one for volatility and one for surprise. These timeseries were down-sampled to give beta estimates of the effects of surprise and volatility on pupil dilation for sequential one second time bins across the outcome period.
Group-level analyses revealed that trial volatility was significantly associated with an increase in pupil diameter following outcome delivery, F(1, 26)=9.8, p=0.004. Bonferroni corrected one sample t-tests, performed for each time bin, indicated that this effect was significant from 2–5s post outcome, Fig 3a. Outcome surprise was also positively associated with an increase in pupil diameter, F(1, 26)=9.2, p=0.005. The effect of surprise was observed slightly earlier than that of volatility, being significant from 1–3s post outcome, Fig 3b. For each individual, we additionally calculated single trial-wise summary measures of pupil responsivity to volatility and outcome surprise. These were estimated using the mean beta-weight of the surprise and volatility regressors across the whole 6 second post-outcome period. Correlational analyses using these summary measures revealed that participants’ mean pupil response to trial-wise volatility predicted the degree to which they adjusted their learning rate between the volatile and stable blocks of the task, r(26)=0.37, p=0.05, Fig 3c. Additionally, participants’ mean pupil response to outcome surprise predicted the extent to which they showed choice reaction time slowing as a function of the unexpectedness of the previous trial’s outcome, r(26)=0.44, p=0.02, Fig 3d. These pupil dilation parameters may reflect changes in activity within the locus coeruleus norepinephrine system, though additional dopaminergic or cholinergic influences cannot be ruled out. The current findings are in line with the existence of a functional relationship between the alterations in neurotransmission which underlie these pupilometry changes and the mechanisms which enable environmental statistics to be used to guide learning about the causal structure of the environment13–16.
Figure 3. Post Outcome Pupil Dilation Tracks Both Environmental Volatility and Outcome Surprise.
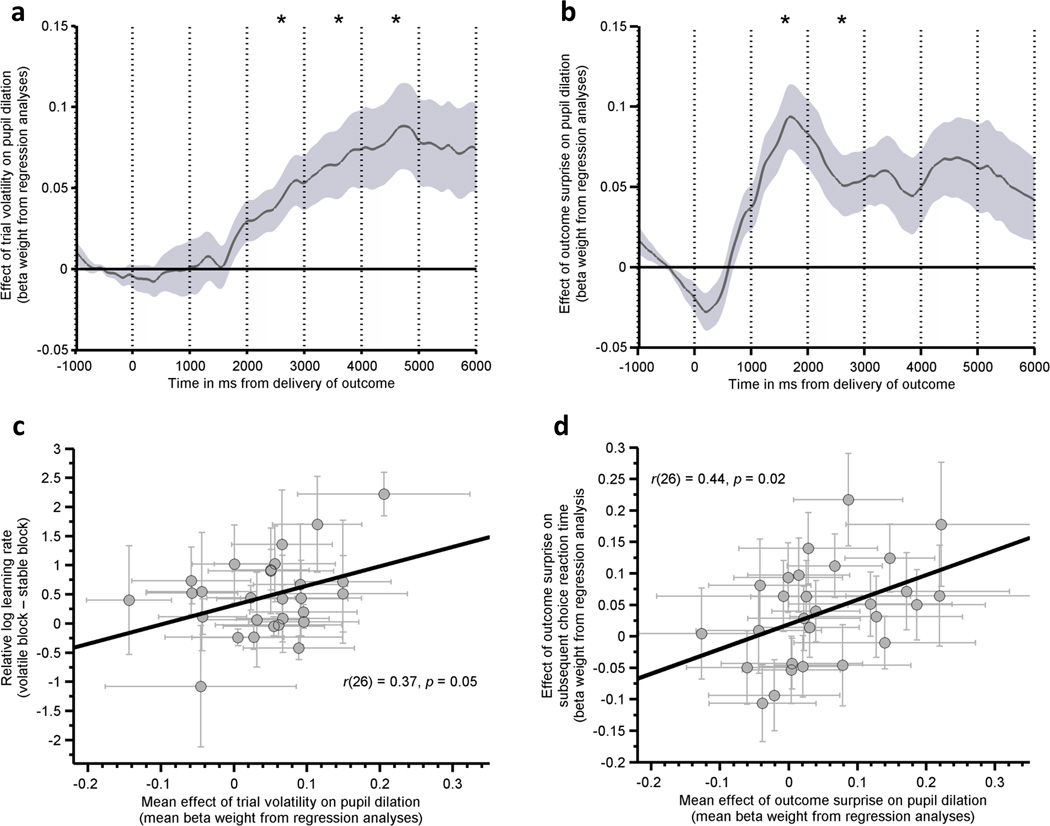
Time courses for the effect of trial-wise estimates of (a) volatility and (b) surprise on pupil dilation following presentation of the outcome. The graphs show the mean across participants (n=28) of the beta weights obtained by regressing post outcome pupil dilation against trial-wise estimates of environmental volatility and outcome surprise. Post outcome pupil dilation was greater for trials where environmental volatility was high, F(1,26)=9.8, p=0.004, and the outcome was surprising, F(1,26)=9.2, p=0.005. Asterisks indicate 1s time bins in which the effect of volatility or surprise on pupil dilation post outcome differed significantly from zero (bonferonni corrected for multiple comparisons, ps corrected <.05). The effect of trial-wise volatility was longer lasting and had a later onset than that of outcome surprise. (c) The degree to which an individual’s pupil tracked volatility (calculated as the mean beta weight across the 6 second post-outcome period) predicted change in learning rate between volatile and stable blocks, r(26)=0.37, p=0.05. (d) The degree to which an individual’s pupil tracked surprise predicted extent of surprise-related choice reaction time slowing on the subsequent trial, r(26)=0.44, p=0.02. Shaded regions in panels a and b represent the standard error of the mean. Error bars in panels c and d represent the standard deviations of the regression coefficients (beta weights) from the pupil analysis and the parameter estimates from the behavioral model for each subject.
Trait anxiety modulates pupil response to volatility
As reported above, we observed that high trait anxious individuals showed impoverished adjustment of learning rate between the stable and volatile blocks of the aversive learning task employed here, but did not show impoverished adjustment of choice reaction times following surprising outcomes. This is consistent with a specific deficit in the use of environmental volatility to adjust action-outcome updating and through this to guide decision-making. We were hence interested in whether high trait anxious participants would show a reduced pupil dilatory response to environmental volatility alone. This was indeed what we observed. Elevated trait anxiety was associated with a decreased mean pupil response to volatility, r(26)=−0.51, p=0.005, Fig 4a,b; see also Fig S8c,d. In contrast, there was no modulatory effect of trait anxiety on the mean pupil response to surprise, r(26)=−0.16, p =0.4, Fig. 4c,d; see also Fig S8e,f. Together with the absence of any significant relationship between trait anxiety and the behavioral response to surprise, this is consistent with trait anxiety being specifically associated with an impoverished ability to process, and adapt to, changes in environmental volatility.
Figure 4. The Relationship Between Trait Anxiety and Post Outcome Pupil Dilation as a function of trial-wise estimates of Volatility and Surprise.
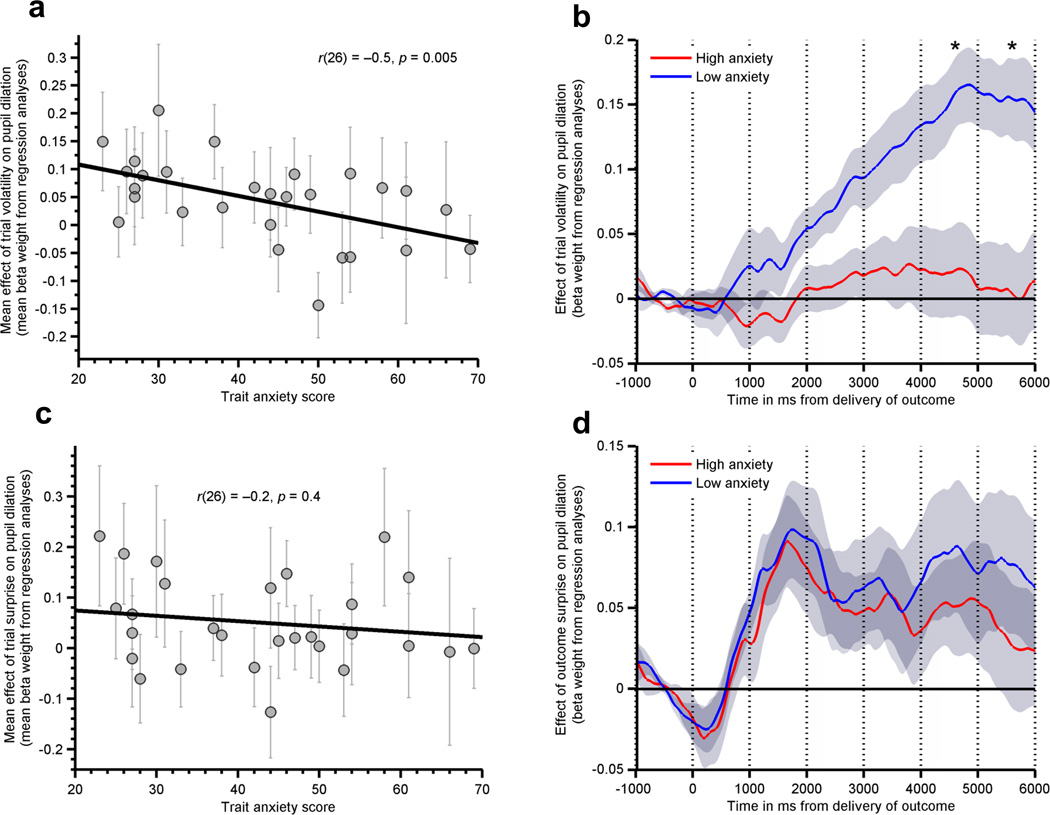
a) The degree to which participants’ pupil dilation, post outcome, tracked environmental volatility was negatively related to trait anxiety, r(26)=−0.51, p=0.005. b) Using a median split on participants’ trait anxiety scores, low anxious participants (n=15) showed a clear pupil response to environmental volatility whereas high anxious participants (n=13) did not (asterisks indicate 1s time bins in which Bonferonni corrected t-tests differed between the groups at p<.05 corrected, 2-tailed.) c) Pupil response to outcome surprise was not related to individual differences in trait anxiety (p=0.4), d) this is illustrated using a median split on trait anxiety. Error bars in panels a and c represent the standard deviations of the regression coefficients (beta weights) from the pupil analysis for each subject. Shaded regions in panels b and d represent the standard error of the mean.
In order to rule out the possibility that the effects of volatility on pupil dilation post outcome – or the modulation of this by anxiety - were due to changes in pupil reactivity with time on task, we reconducted the pupil analyses reported above with two additional control regressors which represented the trial number within each block. Following the addition of these control regressors, the post-outcome pupil response to volatility, F(1,26)=4.3, p=0.049, and surprise, F(1,26)=8.6, p=0.007, remained significant and the relationship between trait anxiety and the mean post outcome pupil response to volatility became, if anything, stronger, r(26)=−0.52, p=0.004 (see Fig S9). Similarly, inclusion of regressors representing the interaction of volatility by outcome (shock versus no shock; Fig. S10a), surprise by outcome (Fig. S10b) and the interaction between volatility and surprise (Fig. S11) also did not alter the relationship between trait anxiety and the post-outcome pupil response to volatility which remained robust in all cases, r(26)<=−0.49, p<=0.007. It is of note that the effect of volatility on post-outcome pupil dilation was not modulated by outcome type, Fig S10a, nor was the effect of surprise, Fig S10b.
We further addressed the possibility that high anxious individuals’ pupillary response does in fact track environmental volatility, but in a manner less like the Bayesian learner than low anxious participants, by conducting additional analyses using non-Bayesian estimates of environmental volatility and outcome surprise (Fig S7b,c). These additional analyses replicated the main findings of an inverse relationship between trait anxiety and the effect of volatility, but not surprise on the post outcome pupil response.
Finally, we investigated the relationship between adaptation of learning between task blocks and baseline, or tonic, pupil dilation. Electrophysiological studies have revealed that the locus coeruleus norepinephrine system displays two modes of activity: periods of reduced tonic activity associated with increased phasic responses to salient stimuli, and periods of increased tonic activity associated with reduced phasic responses17. Consistent with this observation and the suggested influence of norepinephrinergic activity on pupil dilation, a previous pupillometry study reported that reduced baseline measures of pupil size (argued to reflect, at least in part, tonic norepinephrinergic activity) was associated with increased phasic pupil responses16. As reported above (Figure 3), we observed a positive association between environmental volatility and the magnitude of the phasic post-outcome pupil response. We therefore tested whether there was also evidence for a reduction in tonic baseline pupil size during volatile periods and whether this predicted participant behavior and varied as a function of anxiety.
Following16, a measure of the degree to which tonic pupil size varied as a function of trialwise volatility was obtained by analyzing non-baseline corrected pupil data from the 1 second time bin before the outcome was presented (i.e. the baseline period). There was no relationship between mean baseline pupil size across the task and trait anxiety, r(26)=0.1, p=0.6. Across participants, periods of increased volatility were associated with reduced baseline pupil size, t(27)=2.5, p=0.0216. However, differences between participants in the magnitude of baseline pupil size suppression was not significantly correlated with differences in learning rate between volatile and stable task blocks, r(26)=−0.14, p=0.5, nor did it vary significantly as a function of trait anxiety r(26)=0.08, p=0.7. Thus, only the phasic outcome-yoked component of the pupillary response predicted participant behavior and correlated with trait anxiety.
Discussion
In real life, a given action rarely results in the same outcome one hundred percent of the time. Hence it is important to be able to gauge how likely our actions are to produce good or bad outcomes, and to be able to know when to update our estimates of action-outcome contingencies in response to new experiences. Knowing whether to write off an unexpected aversive outcome as a chance event depends upon whether we are in a quickly changing environment, where surprising outcomes should lead us to revise estimated contingencies rapidly, or a stable one - where unexpected outcomes are more likely to reflect noise in action-outcome relationships and we should revise our estimates more slowly6. The results of our study suggest that people are generally able to rationally adapt their learning about aversive outcomes based on whether action-outcome associations are volatile or stable. However, individuals with high trait anxiety show an impoverished ability to do this. This difficulty, in using information about the stability of action-outcome contingencies to correctly judge whether or not to repeat an action that has led to an unexpected aversive outcome, may well lead high trait anxious individuals to engage in poor decision making. It might also result in aversive outcomes being experienced as less predictable and less avoidable. This could in turn lead to an increase in anxiety-related symptomatology, and potentially even play a role in the onset, or maintenance, of anxiety disorders.
Non-luminance related changes in pupil size are argued to reflect, among other influences, activity of central arousal systems, including the locus coeruleus-norepinephrine system15–17. Activity of this system is held to be closely linked to the processing of environmental volatility and the use of this to guide learning6,14. In line with this, we observed that participants showed a significantly greater increase in pupil dilation following trial outcomes when environmental volatility was high. Further, the degree to which participants’ post-outcome pupil dilatory response tracked environmental volatility was significantly correlated with the degree to which they adjusted their learning rate between stable and volatile blocks. Of greatest pertinence to the current study, trait anxiety modulated this pupil response to volatility, with high trait anxious participants showing a smaller effect of volatility on post-outcome pupil dilation. Additional studies involving pharmacological manipulation are required to determine whether this reflects an anxiety-related deficit in norepinephrinergic control of the mechanisms that enable environmental volatility to guide action-outcome updating versus the effect of an upstream influence acting upon the locus coeruleus-norepinephrine system.
Interestingly, elevated trait anxiety was not associated with an altered pupil response to outcome surprise. Trait anxiety also did not modulate the behavioral responses to surprising outcomes - that is there was no influence of trait anxiety upon choice reaction time slowing on trials following surprising outcomes. These findings suggest that the reduced influence of environmental volatility upon action-outcome contingency learning in high trait anxious participants is unlikely to merely be a secondary consequence of a more general insensitivity to surprising outcomes. Rather, individuals with high levels of trait anxiety appear to respond normally to the experience of unexpected aversive outcomes but to be unable to utilize higher order (i.e. block dependent) statistical information present in the distribution of these outcomes to modulate the updating of action-outcome contingency estimates. These findings also indicate that any anxiety-related deficit in the norepinephrinergic control of learning mechanisms would have to be fairly specific in nature.
A number of open questions remain. The first concerns whether anxiety is specifically linked to difficulty in using environmental volatility to update action-outcome estimates when possible outcomes are negatively valenced. A reward-based version of the task used here revealed no significant relationship between trait anxiety and use of the environmental volatility to update learning (Fig S2). However, while this raises the interesting possibility that anxiety is associated with a specific difficulty in aversive learning, it is difficult to draw conclusive inferences from this null result, especially as the effect of anxiety upon the change in learning rate between stable and volatile task blocks was in the same direction in both tasks and the difference in the strength of this relationship between tasks was not statistically significant. In addition, the reward task used a secondary reinforcer (financial reward) while our aversive learning task adopted a primary reinforcer (electrical stimulation). Hence, the specificity of the anxiety-related deficit observed here to aversive versus reward-based learning and to learning in the context of primary versus secondary reinforcers remains to be established.
As mentioned earlier, there is also an interesting parallel between the findings reported here and those from a recent classical fear conditioning study, where high trait anxious individuals showed impoverished ability to differentially regulate conditioned fear responses across contexts which differed in stimulus-stimulus contingencies12. In this prior study, high trait anxious participants also appeared to be less able to adapt to the associative statistics of different contexts. Future work will enable us to establish whether there is indeed a common deficit in responding to changes in aversive stimulus-stimulus and action-outcome contingencies in high trait anxious individuals, and to investigate whether this may have a causal role in the anxiety experienced by these individuals and, potentially, their elevated risk for developing full blown anxiety disorders. We further hope to determine whether the anxiety-related deficit in contingency learning reported here, and potentially entailed in prior findings12, is unique to anxiety or reflects a common deficit shared with risk for depression. This question reflects increasing awareness of the comorbidity between anxiety and depressive disorders and the need to identify which of those biological mechanisms identified as potentially conferring vulnerability to disease are unique to anxiety or depression versus common to both24.
In conclusion, our current findings reveal that trait vulnerability to anxiety is associated with a deficit in the use of higher-order statistics about the causal structure of adverse environments to guide decision-making. High trait anxious individuals did not differ from low trait anxious individuals in their mean learning rate or in their behavioral or pupillary response to surprising adverse outcomes. Nor did they show altered preferences for minimizing shock probability versus shock magnitude. Instead, their pattern of decision-making indicated a selective difficulty with differentially updating action-outcome contingencies as a function of whether the current environment was stable or volatile. Our pupilometry data also confirmed a specific insensitivity to environmental volatility and raised the possibility that this might reflect impoverished modulation by environmental volatility of activity within the locus coeruleus norepinephrine system.
In everyday life, determining whether, given the current context, an unexpected negative outcome is probably a chance event or something likely to occur again if the action that led to it is repeated, may be essential to personal relationships and work place judgments. A deficit in this aspect of learning may potentially play a key maintaining, or even etiological, role in the anxiety experienced by high trait anxious individuals. In the current study, we have taken a step towards elucidating this deficit, and hope to have illustrated how computational models can be integrated with behavioral and pupillometry analyses to begin to identify the mechanisms underlying disrupted decision making in high trait anxious individuals.
Online Methods
Participants
Thirty-one (22 female) English speaking, healthy participants, aged between 18 and 40 years (mean = 23.7, S.D = 5.6), were recruited from the local community. One was a replacement for a prior participant where data was lost. The number of participants recruited was based on estimates of samples sizes from prior studies using similar tasks or studying effects of trait anxiety8,12,23, we note these have not previously been combined. Pre-screening on the trait subscale of the Spielberger State-Trait Anxiety Inventory (trait-STAI)20 was conducted in order to achieve an approximately even number of participants with scores in the ranges 20–30, 30–40, 40–50, >50. Exclusion criteria included current receipt of psychoactive medication or psychological therapy, neurological illness or suicidal symptomatology. Data from one participant was lost, as noted above, due to equipment failure. Analyzable eye tracking data was obtained on all but two of the remaining participants.
General procedure
The study was approved by the Oxford University Research Ethics Committee. Following provision of written informed consent, participants completed two learning tasks; the novel aversive learning task and a parallel reward learning task. The latter was included to establish replication of cross-participant effects of the volatility manipulation in a reward context (as previously reported by Behrens and colleagues8), the current focus of interest being the extension of this to learning in an aversive context. The reward task is not reported in detail here; we note that cross-participant effects of volatility upon learning were indeed replicated but no significant effects of trait anxiety were observed (see Figure S2). The order of tasks was counterbalanced across participants. There was no effect of task order.
The tasks were presented on a cathode ray monitor connected to a computer running Presentation software version 15.1 (Neurobehavioral Systems Inc, Albany, CA). Participants’ heads were stabilized using a head and chin rest placed 70 cm from the screen. An Eyelink 1000 system (SR Research, Ontario, Canada) was mounted on the headrest and collected eye position and pupil size data from the right eye at a rate of 1000Hz. Electrical stimulation was delivered as trains of 2 ms pulses using a DS7AH constant current electrical stimulator (Digitimer, Hertfordshire, UK). This was controlled by the stimulus presentation computer and connected to the volar surface of participants’ non-dominant forearm using a bipolar electrode.
The Aversive learning task
Overview
The aversive learning task (Fig. 1) was adapted from a structurally equivalent reward learning task previously successfully used to examine the impact of changes in environmental volatility upon rate of learning8,11. It comprises two blocks of 90 trials in which participants choose between two stimuli that are probabilistically associated with receipt of an electrical shock (see Figure 1). In one block, choice-outcome contingencies are stable (shape A results in a shock 75% of the time, shape B 25% of the time). In the other block, choice-outcome contingencies are volatile, switching every 20 trials. The magnitude of shock received if a given shape is chosen and does result in a shock on that trial is specified separately for each shape and varies from trial to trial (more details are given below). These key details are important for the following reasons: (1) trialwise manipulation of magnitude of shock leads to trialwise changes in the relative expected value of each shape and enables all 90 trials of each block to contribute to estimation of the learning rate within that block (rather than just ‘start’ (of block) trials and ‘switch’ trials (those following changes in action-outcome contingency within the volatile block)); (2) this in turn allows us to maximize trial number within blocks as opposed to the number of separate blocks – this is critical to establish the extent to which participants are able to modulate their learning rate as a function of the volatility of action-outcome contingencies, as volatility can only be estimated across a large number of trials (see the Supplementary Modeling Note for an illustration of the rate at which information on volatility may be accrued).
Task details
On each trial, participants were presented with a fixation cross flanked by two shapes which were offset by approximately 7° visual angle. Participants’ task was to choose one of the two shapes, one of which would result in the delivery of an electrical shock. In the stable block, one of the two shapes predicted the occurrence of the shock with a probability of 75%, the other shape resulting in shock delivery on the remaining trials. In the volatile block, the shape that most predicted the shock switched every 20 trials (with one shape predicting it with a probability of 80%, the other with a probability of 20%). The magnitude of shock that would be delivered if administered was specific to each shape and displayed as a two digit number (between 01 and 99) in the shape’s center. On each trial, the magnitude value for each shape was chosen from two separate random distributions. Following a variable period of time (drawn from a Poisson distribution, min= 1s, mean=2s), the central fixation cross changed to a question mark, indicating that participants could respond. Participants had up to 4 seconds to choose one of the two shapes. After the participant responded, there was a jittered interval (min 2s, mean 4s) before outcome presentation. In the outcome phase of all trials, the shape resulting in the shock was shown at fixation, between the two options, for two seconds (Fig. 1). If participants had chosen that shape, a shock was delivered at the beginning of this period (the intensity of the shock being determined by the magnitude associated with the chosen shape). Following this, the shapes were replaced by crosses (a single cross at fixation, and two double crosses either side) and there was a further jittered interval (min 2s, mean 4s) before the next trial began. Participants completed 180 trials, 90 in each block. The two task blocks were completed sequentially with no break between them and with no explicit cuing as to the division of the task into two distinct blocks. Participants were randomly assigned to complete either the stable or volatile block first.
Stimuli
Visual stimuli were constructed to minimize variations in luminance during the course of the task. All stimuli were shaped gabor patches, with an area of ~16° squared visual angle (i.e. approx. 4°×4°, matched on area across shape types), the same mean luminance as the background (83.9 ± 0.5 Cd/m2), and a spatial period of 0.5° visual angle. Each participant completed the task using either circle and square or triangle and cross shaped gabor patches.
Calibration of electrical shocks
Prior to completion of the learning task, a calibration procedure was conducted in order to equate subjective pain across participants, as far as possible. During calibration, pain was reported by participants using a 10 point scale on which 1 was defined as “minimal pain”, 10 as “worst possible pain” and 7 as the worst pain which the participant could tolerate receiving up to 20 times during the task. The amplitude of a single 2ms period of electrical stimulation was increased from zero until it produced a sensation rated as 1/10. The amplitude of a single 2ms pulse was then kept at this level with the intensity of the shock gradually increased up to a subjective intensity of 7/10 by increasing the number of 2ms pulses delivered in a train. This resulted in a single pulse producing 1/10 pain and a maximum number of pulses, delivered in a train, which produced 7/10 pain. Across participants, the maximum number of pulses used ranged from 8 to 48, with no relationship between this measure and trait-anxiety, r(28) = 0.18, p=0.3. Participants subsequently completed 14 trials during which the intensity of electrical shock was randomly varied by changing the number of pulses delivered in a train between 1 and the number required to produce subjective pain of 7/10. Participants’ subjective pain ratings of these different levels of shock were fitted to a sigmoid curve. This was used to determine the number of pulses given for each magnitude shock level (1–99) during the task (i.e. a magnitude of ‘1’ would receive a single 2ms pulse, a magnitude of ‘99’ would receive the number of pulses required to produce a subjective pain rating of ‘7’, all other magnitude level / number of pulse conversions were calculated using the sigmoidal fit (Fig. S1)).
Pupil dilation preprocessing
Pupil diameter measurements were collected using the Eyelink 1000 system as described above, at a sampling rate of 1000Hz. This data was cleaned with blinks removed using the Eyelink system’s built in filter. Missing data points were linearly interpolated (trials in which more than 50% of the eyetracking data was interpolated were not used in subsequent analyses, mean = 16% of trials). The resulting trace was subjected to a low pass Butterworth filter with a cutoff of 3.75Hz and then z transformed across the session14. Data were extracted from each trial using a window based on the presentation of the outcome. This included a 1s baseline period prior to the presentation of the outcome, and a 6s period following outcome presentation (this comprised the 2s period when the shape associated with the shock was shown and the subsequent 4s following removal of outcome information). Baseline correction was achieved by subtracting the mean pupil size during the baseline period from each time point post outcome.
An additional analysis of tonic baseline pupil diameter was also conducted. The pupil data submitted to this analysis was preprocessed in an identical manner to that described above, except for the absence of baseline correction16.
Analysis and modeling
Decision choice data: estimating change in learning rate
The primary measure of interest was change in learning rate between stable and volatile task blocks. This was calculated by fitting a simple learning model, as previously described by Behrens et al.8, to participants’ choice data. Details of the model, which consisted of a Rescorla-Wagner predictor10 coupled to a softmax based action selector, and the process by which the model parameters were fitted to participant choice data are provided in the Supplementary Modeling Note. In this note, we also provide evaluation of the model’s performance (ability to account for participant choice), and formal comparison of its fit with that of alternative models.
Calculating trial-wise estimates of surprise and volatility, using a Bayesian learner, for use in RT and pupillometry analyses
Findings from previous decision-making studies suggest that human participants approximate an optimal Bayesian learner in their use of environmental statistics to implicitly guide decision choice. In particular, their choice behavior is consistent with use of trial-wise Bayesian estimates of environmental volatility to determine the extent to which to update estimates of outcome likelihood and to in turn use this to guide the action they take8,11. Given this, we used a Bayesian learner (following8) to calculate trial-wise estimates of volatility, see the Supplementary Modeling Note. We sought to establish whether these estimates would predict trial-wise changes in the pupil response to outcome presentation. This prediction was informed by recent findings14 and made in light of the suggestion that the pupil dilatory response indexes activity in the locus coeruleus norepinephrine system15–17 which has been argued to be sensitive to environmental uncertainty6.
The extent to which an outcome is ‘surprising’ or unexpected is effectively an unsigned prediction error and has been linked to slowing on trials following those where the outcome is highly surprising21. The Bayesian learner was also used to calculate trial-wise estimates of surprise. These were estimated as the negative logarithm of the conditional probability of the outcome observed given the prior estimated probability of the outcome (i.e. the Shannon information of the outcome22), see the Supplementary Modeling Note. These trial-wise estimates of surprise were entered into regression analyses of pupil response to outcome presentation and also into regression analyses examining decision choice reaction time as a function of outcome surprise on the prior trial.
Decision choice reaction time analyses
For the reaction time analyses, data were excluded for trials where response times were so short (<200ms) that they were unlikely to reflect a genuine choice (mean = 2% of trials). Reaction time data from all remaining trials were log transformed before being entered into regression analyses. The trial-wise measure of surprise on each trial n was regressed against the reaction time for trial n+1 on a participant-wise basis. Additional regressors of no interest were included to control for other task parameters that could influence reaction time. These comprised outcome (0,1, where 1 = shock delivered), shock magnitude (1–99), the pascalian (expected) values of the chosen and unchosen stimulus, and the Bayesian estimate of the volatility of the current trial. These participant-wise regression analyses output a beta weight for each participant which indicated the extent to which their choice reaction time on trial n+1 was influenced by how surprising the previous outcome (on trial n) had been. These beta estimates were entered into a second-level one sample t-test (to examine effects of outcome surprise on subsequent trial choice reaction time across participants) and a second-level Pearson product moment correlational analysis (to examine the modulation by trait anxiety of the effect of outcome surprise upon subsequent trial reaction time). For these and all other analyses reported in the paper, prior to parametric tests being conducted, the Kolomogorov-Smirnov test was used to ensure the data was distributed normally. All statistical tests reported are two-tailed unless specified otherwise.
Pupil dilation analyses
Preprocessing of the pupil data is described above, together with procedures for baseline correction. Preliminary checks were conducted to ensure that the main analyses were unlikely to be confounded by anxiety-related differences in fixation or saccades. These checks revealed that there was no significant relationship between trait anxiety and the number of saccades (ps>0.25), or the time spent in fixation (ps>0.35) in any of the 1 sec time bins of the outcome period. Further, there was no relationship between these parameters and the degree to which participants altered their learning rate between volatile and stable task blocks (number of saccades: ps>0.18; time spent in fixation: ps>0.12).
Regression analyses were conducted to examine the effects of trial-wise volatility and outcome surprise on pupil dilation following outcome presentation. The post-outcome period was sampled using 6000 1ms bins. Regression analyses were conducted for each of these bins, with Bayesian estimates of trial-wise volatility and surprise entered as regressors of interest; outcome (0,1, where 1 = shock delivered), shock magnitude (1–99), and the pascalian values of the chosen and unchosen stimulus were entered as control regressors. The resultant timeseries of beta-weights for volatility and surprise were down-sampled to give beta estimates of the effects of surprise and volatility on pupil dilation for six sequential one second time bins across the outcome period. These beta values were entered as the dependent measure into analyses of variance (ANOVAs), one for surprise and one for volatility. Time bin was entered as a within-subject factor and block order (stable versus volatile block first) as a between subject variable. Cross time bin summary measures of pupil responsivity to trial volatility and outcome surprise were also calculated. These were used for correlational analyses against both behavioral indices of interest and our between subject measure of trait anxiety. Additional graphical representation of the effects of trait anxiety was achieved by dividing participants into two groups using a median split on trait anxiety scores, (Figs. 4, S8, S9).
Supplementary Material
Acknowledgements
The authors would like to thank Dr Stephan Hicks and Professor Christopher Kennard for use of the eye-tracking system. This research was supported by ERC grant GA 260932 and NIH grant R01MH091848.
Footnotes
Authors Contributions
M.B. and S.J.B. wrote the manuscript, M.B., S.J.B. and T.J.B. designed the task. M.B. collected the data. All authors contributed to data analysis. T.J.B. developed the Bayesian model. All authors commented on the manuscript.
Competing Financial Interests
None.
References
- 1.Butler G, Mathews A. Cognitive processes in anxiety. Advances in Behavior Research and Therapy. 1983;5:51–62. [Google Scholar]
- 2.Hartley CA, Phelps EA. Anxiety and decision-making. Biol Psychiatry. 2012;72:113–118. doi: 10.1016/j.biopsych.2011.12.027. [DOI] [PMC free article] [PubMed] [Google Scholar]
- 3.Paulus MP, Yu AJ. Emotion and decision-making: affect-driven belief systems in anxiety and depression. Trends in cognitive sciences. 2012;16:476–483. doi: 10.1016/j.tics.2012.07.009. [DOI] [PMC free article] [PubMed] [Google Scholar]
- 4.Birrell J, Meares K, Wilkinson A, Freeston M. Toward a definition of intolerance of uncertainty: a review of factor analytical studies of the Intolerance of Uncertainty Scale. Clinical psychology review. 2011;31:1198–1208. doi: 10.1016/j.cpr.2011.07.009. [DOI] [PubMed] [Google Scholar]
- 5.Carleton RN, Norton MA, Asmundson GJ. Fearing the unknown: a short version of the Intolerance of Uncertainty Scale. Journal of anxiety disorders. 2007;21:105–117. doi: 10.1016/j.janxdis.2006.03.014. [DOI] [PubMed] [Google Scholar]
- 6.Yu AJ, Dayan P. Uncertainty, neuromodulation, and attention. Neuron. 2005;46:681–692. doi: 10.1016/j.neuron.2005.04.026. [DOI] [PubMed] [Google Scholar]
- 7.Payzan-Lenestour E, Dunne S, Bossaerts P, O'Doherty JP. The Neural Representation of Unexpected Uncertainty during Value-Based Decision Making. Neuron. 2013;79:191–201. doi: 10.1016/j.neuron.2013.04.037. [DOI] [PMC free article] [PubMed] [Google Scholar]
- 8.Behrens TE, Woolrich MW, Walton ME, Rushworth MF. Learning the value of information in an uncertain world. Nat Neurosci. 2007;10:1214–1221. doi: 10.1038/nn1954. [DOI] [PubMed] [Google Scholar]
- 9.Sutton R, Barto AG. Reinforcement Learning. MIT Press; 1998. [Google Scholar]
- 10.Rescorla RA, Wagner AR. In: Classiacal Conditioning II: Current research and theory. Black AH, Prokasy WF, editors. Appleton-Centuary-Crofts; 1972. pp. 64–99. [Google Scholar]
- 11.Behrens TE, Hunt LT, Woolrich MW, Rushworth MF. Associative learning of social value. Nature. 2008;456:245–249. doi: 10.1038/nature07538. [DOI] [PMC free article] [PubMed] [Google Scholar]
- 12.Indovina I, Robbins TW, Nunez-Elizalde AO, Dunn BD, Bishop SJ. Fear-conditioning mechanisms associated with trait vulnerability to anxiety in humans. Neuron. 2011;69:563–571. doi: 10.1016/j.neuron.2010.12.034. [DOI] [PMC free article] [PubMed] [Google Scholar]
- 13.Preuschoff K, t Hart BM, Einhauser W. Pupil Dilation Signals Surprise: Evidence for Noradrenaline's Role in Decision Making. Frontiers in neuroscience. 2011;5:115. doi: 10.3389/fnins.2011.00115. [DOI] [PMC free article] [PubMed] [Google Scholar]
- 14.Nassar MR, et al. Rational regulation of learning dynamics by pupil-linked arousal systems. Nat Neurosci. 2012;15:1040–1046. doi: 10.1038/nn.3130. [DOI] [PMC free article] [PubMed] [Google Scholar]
- 15.Eldar E, Cohen JD, Niv Y. The effects of neural gain on attention and learning. Nat Neurosci. 2013;16:1146–1153. doi: 10.1038/nn.3428. [DOI] [PMC free article] [PubMed] [Google Scholar]
- 16.Gilzenrat MS, Nieuwenhuis S, Jepma M, Cohen JD. Pupil diameter tracks changes in control state predicted by the adaptive gain theory of locus coeruleus function. Cognitive, affective & behavioral neuroscience. 2010;10:252–269. doi: 10.3758/CABN.10.2.252. [DOI] [PMC free article] [PubMed] [Google Scholar]
- 17.Aston-Jones G, Cohen JD. An integrative theory of locus coeruleus-norepinephrine function: adaptive gain and optimal performance. Annu Rev Neurosci. 2005;28:403–450. doi: 10.1146/annurev.neuro.28.061604.135709. [DOI] [PubMed] [Google Scholar]
- 18.Gorman JM, Hirschfeld RM, Ninan PT. New developments in the neurobiological basis of anxiety disorders. Psychopharmacology bulletin. 2002;36(Suppl 2):49–67. [PubMed] [Google Scholar]
- 19.Charney DS, Drevets WC. In: Neuropsychopharmacology: The Fifth Generation of Progress. Davis KL, Charney DS, Coyle JT, Nemeroff C, editors. American College of Neuropsychopharmacology; 2002. pp. 901–930. [Google Scholar]
- 20.Spielberger CD, Gorsuch RL, Lushene RD. Manual for the State-Trait Anxiety Inventory (STAI) Consulting Psychologists Press; 1983. [Google Scholar]
- 21.Bestmann S, et al. Influence of uncertainty and surprise on human corticospinal excitability during preparation for action. Current biology : CB. 2008;18:775–780. doi: 10.1016/j.cub.2008.04.051. [DOI] [PMC free article] [PubMed] [Google Scholar]
- 22.MacKay DJC. Information Theory, Inference and Learning Algorithms. Cambridge University Press; 2003. [Google Scholar]
- 23.O'Reilly JX, et al. Dissociable effects of surprise and model update in parietal and anterior cingulate cortex. Proc. Natl. Acad. Sci. doi: 10.1073/pnas.1305373110. (in press). [DOI] [PMC free article] [PubMed] [Google Scholar]
- 24.Casey BJ, et al. DSM-5 and RDoC: progress in psychiatry research? Nature reviews. Neuroscience. 2013;14:810–814. doi: 10.1038/nrn3621. [DOI] [PMC free article] [PubMed] [Google Scholar]
Associated Data
This section collects any data citations, data availability statements, or supplementary materials included in this article.