

Summary
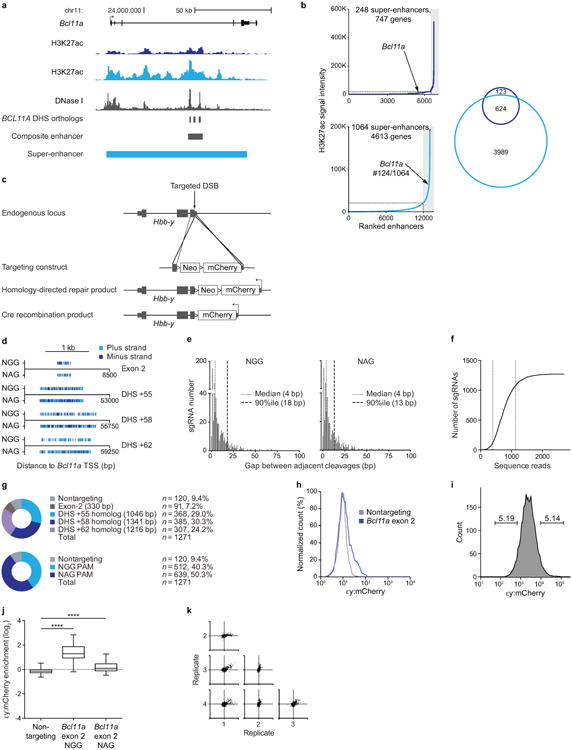
Enhancers, critical determinants of cellular identity, are commonly identified by correlative chromatin marks and gain-of-function potential, though only loss-of-function studies can demonstrate their requirement in the native genomic context. Previously we identified an erythroid enhancer of BCL11A, subject to common genetic variation associated with fetal hemoglobin (HbF) level, whose mouse ortholog is necessary for erythroid BCL11A expression. Here we develop pooled CRISPR-Cas9 guide RNA libraries to perform in situ saturating mutagenesis of the human and mouse enhancers. This approach reveals critical minimal features and discrete vulnerabilities of these enhancers. Despite conserved function of the composite enhancers, their architecture diverges. The crucial human sequences appear primate-specific. Through editing of primary human progenitors and mouse transgenesis, we validate the BCL11A erythroid enhancer as a target for HbF reinduction. The detailed enhancer map will inform therapeutic genome editing. The screening approach described here is generally applicable to functional interrogation of noncoding genomic elements.
Enhancers are classically described as distal genetic elements that positively regulate gene expression in an orientation-independent manner in ectopic heterologous gain-of-function expression experiments1. These elements coordinate when, where, and how genes are expressed. Enhancer sequences bind transcription factors and are correlated with specific chromatin features including reduced DNA methylation, characteristic histone modifications, heightened chromatin accessibility, long-range promoter interactions, and bidirectional transcription. Recent chromatin mapping has demonstrated the abundance of distal regulatory elements bearing an enhancer signature2–4.
The biological importance of enhancers is underscored by gene expression studies showing the predictive power of enhancer profile on lineage-specific programs5–7. Highly marked and clustered enhancers (e.g. so-called strong, stretch, or super-enhancers) are particularly suggestive of cellular identity and may help to infer lineage-specific regulatory factors8–10. Genome-wide association studies reveal enrichment of trait-associated variants in sequences bearing lineage-restricted enhancer signatures4,8,11,12. Enhancers display signs of evolutionary constraint as well as heightened turnover with evidence of positive selection13–16.
Despite their importance, enhancers are typically defined by criteria unrelated to in situ functional requirement. Advances in putative enhancer mapping, as well as large-scale oligonucleotide synthesis, facilitate enhancer reporter assays on a massively parallel scale, allowing a systematic evaluation of the functional significance of enhancer sequences17,18. Nonetheless, ectopic heterologous enhancer assays cannot address the necessity of an element in its native chromatin environment. The growing appreciation of the nonrandom distribution of distal elements both with respect to the linear genome and within the three-dimensional nuclear environment emphasizes the importance of studying enhancers by perturbing their endogenous condition10,19.
Insightful observations have been made by mutagenizing enhancers using traditional molecular genetic approaches20,21. However the low throughput of these classical methods constrains their widespread application. Furthermore the elevated turnover of many enhancer sequences between species may limit the ability to derive conclusions from nonhuman organisms regarding human gene regulation. Advances in genome editing technology make practical the facile modification of the human genome22,23. High-throughput Cas9-mediated functional genomics studies have revealed novel genes required for various biologic processes24–27. Genome editing is likewise suitable for the study of non-coding genetic elements such as enhancers, although these experiments have previously been conducted at low-throughput28–30.
Human composite enhancer
Recently we observed that common genetic variants associated with HbF (α2γ2) level and β-hemoglobin disorder clinical severity mark an adult developmental stage- and erythroid-lineage specific intronic enhancer of BCL11A28, a validated repressor of HbF and therapeutic target for β-hemoglobin disorders28,31–33. This composite human enhancer is composed of three DNase I hypersensitive sites (DHSs), termed h+55, h+58, and h+62, based on distance in kilobases from the transcriptional start site (TSS)28. The most highly trait-associated haplotype is defined by two SNPs, rs1427407 within h+62 and rs7606173 within h+55 (Extended Data Fig. 1a). Previously we showed that this enhancer possessed ectopic erythroid-restricted, adult-stage-specific enhancer activity28. Moreover, the mouse ortholog of the composite enhancer, defined by primary sequence homology, shared erythroid enhancer chromatin signature, and syntenic position relative to coding sequences, was shown to be required for BCL11A expression and embryonic globin gene repression in a mouse erythroid cell line but dispensable in a mouse B-lymphoid cell line28.
To evaluate the requirement for human BCL11A enhancer sequences, we utilized HUDEP-2 cells, an immortalized human CD34+ hematopoietic stem and progenitor cell (HSPC)-derived erythroid precursor cell line that expresses BCL11A and predominantly β- rather than γ-globin34. We used the clustered regularly interspaced palindromic repeat (CRISPR)-Cas9 nuclease system to generate clones of HUDEP-2 cells with deletion of the 12-kb BCL11A composite enhancer by introduction of a pair of chimeric single guide RNAs (sgRNAs). Enhancer deletion resulted in near complete loss of BCL11A expression and induction of γ-globin and HbF protein to similar levels as cells with BCL11A knockout (Fig. 1a-c), consistent with the possibility that these sequences could serve as targets for therapeutic genome editing for HbF reinduction for the β-hemoglobinopathies35. Although targeted deletions by paired double strand breaks (DSBs) may be achieved by genome editing, competing genomic outcomes include local insertion/deletion (indel) production at each cleavage site as well as inversion of the intervening segment22,23,36–38.
Figure 1. Tiled pooled in situ CRISPR-Cas9 BCL11A enhancer screen.
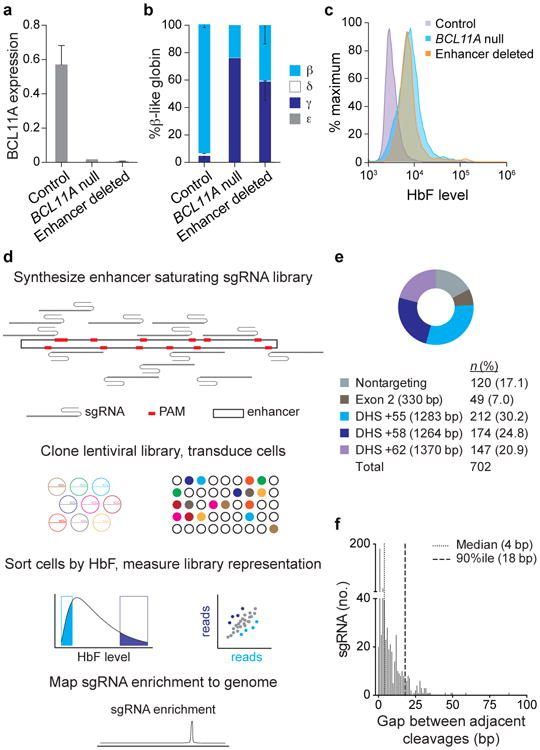
a-c, Deletion of the human composite BCL11A enhancer in HUDEP-2 cells demonstrates its necessity for BCL11A expression (normalized to GAPDH), repression of γ-globin mRNA, and repression of HbF; control clones, n = 4; BCL11A null, n = 1; enhancer deleted, n = 3; error bars show s.e.m. d, Workflow of CRISPR-Cas9 enhancer screen showing library synthesis, delivery, and analysis. e, Human NGG PAM sgRNA library distribution. f, Gaps between adjacent genomic cleavages for NGG PAM sgRNAs targeting BCL11A exon-2, h+55, h+58, and h+62.
Tiled pooled enhancer editing in situ
We hypothesized that composite enhancers may be composed of a functional hierarchy with essential and dispensable constituent components. A functional hierarchy might enable enhancer disruption by a single DSB at a critical region followed by nonhomologous end joining (NHEJ) repair with indels. In fact, the hypothesis that a prevalent mechanism of trait associations is enhancer variation rests on the premise that single nucleotide changes themselves may substantively modulate enhancer function. Therefore we reasoned that a tiling set of sgRNAs could uncover critical enhancer regions by disruption of nearly all sequences within an enhancer based on the typical outcome of Cas9 cleavage and NHEJ repair, an indel spectrum with frequent deletions of up to 10 bp from the cleavage position22,23,36,38,39.
We designed all possible sgRNAs within the human BCL11A composite enhancer DHSs (Fig. 1d, e) as restricted only by the presence of the SpCas9 NGG protospacer adjacent motif (PAM), which restricts cleavage at an average 1/8 frequency at each genomic position22,39. The NGG PAM restricted sgRNAs had a median gap between adjacent genomic cleavages of 4 bp and 90th percentile of 18 bp (Fig. 1f), which suggested that this strategy could approach saturation mutagenesis in situ. We included nontargeting sgRNAs as negative controls as well as sgRNAs tiling exon-2 of BCL11A as positive controls (Fig. 1e). The library was successfully cloned to a lentiviral vector. The basic experimental schema was to transduce HUDEP-2 cells with the lentiviral library at low multiplicity such that nearly all selected cells contained a single integrant (Fig. 1d). Following expansion, differentiation, sorting by HbF level, genomic DNA isolation, and deep sequencing of integrated sgRNAs, an HbF enrichment score was calculated for each sgRNA by comparing its representation in HbF-high and HbF-low pools (see Supplementary Information and Extended Data Fig. 2 for additional technical details).
We mapped the HbF enrichment score of each sgRNA to its predicted position of genomic cleavage (Fig. 2a). The majority of enhancer targeting sgRNAs showed no significant enrichment or depletion from the HbF-high pool. The enriching sgRNAs colocalized to discrete genomic positions. For example, we observed a cluster of sgRNAs at h+62 with modest enrichment, a cluster at h+55 with moderate enrichment (as well as adjacent clusters with depletion), and a cluster at h+58 with marked enrichment. Of note, we observed 10 sgRNAs at h+58 with cleavage positions within 42 bp each with HbF enrichment scores exceeding 0.99, the median enrichment score of BCL11A exon-2 targeting sgRNAs.
Figure 2. Functional mapping of the BCL11A enhancer.
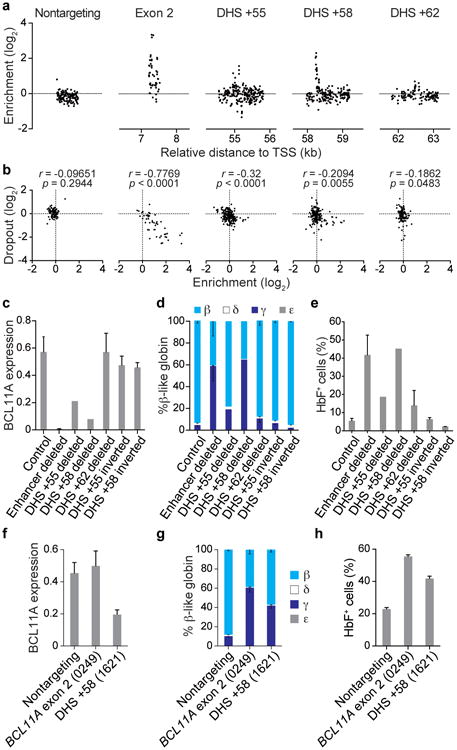
a, Mapping sgRNA HbF enrichment scores relative to genomic cleavage positions. Nontargeting sgRNAs pseudo-mapped with 5 bp spacing. b, Correlation between cellular dropout and HbF enrichment scores. c-e, BCL11A expression normalized to GAPDH, β-like globin expression, and HbF+ fraction in HUDEP-2 cells with deletion or inversion of individual DHSs; control clones, n = 4; enhancer deleted, n = 3; +55 deleted, n = 1; +58 deleted, n = 1; +62 deleted, n = 5; +55 inverted, n = 3; +58 inverted, n = 2. f-h, BCL11A expression normalized to GAPDH, β-like globin expression, and HbF+ fraction in primary human erythroid precursors transduced with Cas9 and individual sgRNAs; n = 3. Error bars represent s.e.m. (c, d, f, g) or s.d. (e, h).
Exon-2 targeted sgRNAs showed a linear correlation between HbF enrichment and cellular dropout, suggesting sgRNAs that result in complete knockout of BCL11A lead to a reduced rate of cell accumulation inseparable from HbF derepression (Fig. 2b). In contrast, the sgRNAs at h+58 associated with marked HbF enrichment showed blunted impact on dropout (Fig. 2b). This finding could be consistent with a low residual level of BCL11A adequate to promote cellular accumulation but inadequate to suppress HbF.
To corroborate these findings, we introduced two sgRNAs to the HUDEP-2/Cas9 cells to produce targeted deletion or inversion clones36. Deletion of h+58 phenocopied deletion of the composite enhancer and deletion of h+55 had moderate effect (while deletion of h+62 showed a nonsignificant trend towards a modest effect), consistent with the magnitude of top-scoring and colocalizing sgRNAs from the screen (Fig. 2a, c-e). Inversion of the h+58 or h+55 sites had no significant effect on gene expression, demonstrating that the BCL11A enhancer functions in an orientation-independent manner in situ, consistent with the classic enhancer definition1 (Fig. 2c-e).
To validate the findings from the HUDEP-2 cells, the top-scoring enhancer targeting sgRNA from the screen (#1621 at h+58) was tested in primary human erythroblasts by lentiviral transduction of human CD34+ HSPCs exposed to ex vivo erythroid culture conditions. Consistent with the screen results, sgRNA-1621 resulted in downregulation of BCL11A expression and corresponding upregulation of γ-globin expression and increase in HbF+ cells (Fig. 2f-h). Notably, sgRNA-1621 did not alter surface marker profile, enucleation frequency, or cellular morphology (Extended Data Fig. 3c). Together these results suggest proof-of-principle of an individual sgRNA targeting a noncoding element for therapeutic genome editing of β-hemoglobin disorders.
Primate-specific enhancer sequences
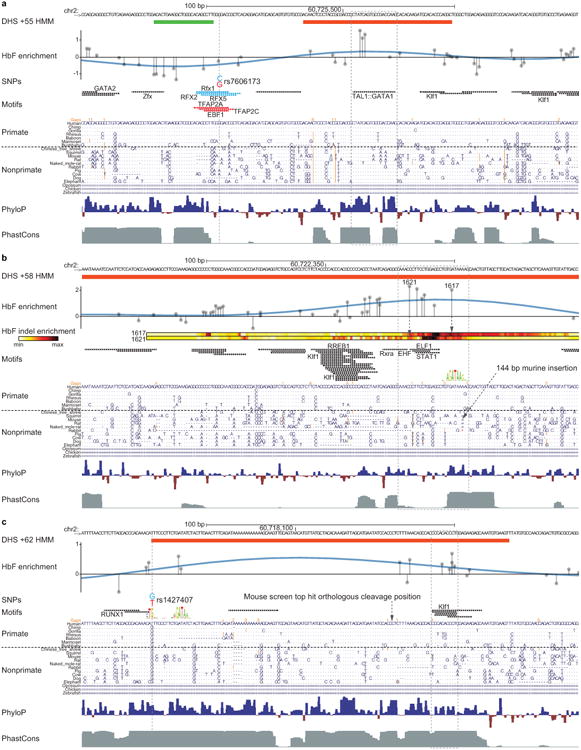
We applied a hidden Markov model (HMM) to the sgRNA enrichment score data to infer functionally important sequences within each DHS (Extended Data Fig. 4a). This model defined three functional states, Active, Repressive, and Neutral, based on likelihood to encompass sequences that positively, negatively, and neutrally regulate target gene expression, respectively. The model identified functional states within each DHS (Fig. 3a-c). At each of the three DHSs, the Active states were precisely located at regions with the highest degree of DNase I sensitivity.
Figure 3. Inferred functional enhancer states relative to genomic features.

a-c, Hidden Markov model segmentation of functional enhancer states. HbF enrichment scores shown throughout DHSs h+55, h+58, h+62 by gray lines and circles with blue line representing smoothed enrichment score. DNase I sequencing from primary human erythroblasts28. PhyloP (scale from -4.5 to 4.88) and PhastCons (from 0 to 1) estimates of evolutionary conservation among 100 vertebrates. Positions of SNPs rs7606173 and rs1427407 denoted which together define the haplotype most highly associated to HbF level28.
The overall sequence conservation at the h+58 Active region appears both less intense and less distinct from flanking sequences as compared to those of h+62 and h+55 (Fig. 3a-c). The top-scoring sgRNAs in the screen colocalize to 42 bp within h+58 (Fig. 4, Extended Data Fig. 5b). The third-highest scoring enhancer-targeted sgRNA (sgRNA-1617) mapped directly onto an apparent GATA1 motif, though below a genome-scale significance threshold (P = 3.74 × 10⁻⁴). The mouse orthologous sequence has a GATA1 motif P-value only modestly higher than the human (p = 4.33 × 10⁻⁴). This GATA1 motif appears to have relatively high vertebrate conservation, with exact human sequence identity in rabbits, pigs, dogs, and elephants. The top-scoring sgRNA (sgRNA-1621) mapped to a position 15 bp from this GATA1 motif (Fig. 4). An additional four sgRNAs mapping between sgRNA-1621 and 1617 each had substantially elevated HbF enrichment scores. Underlying these sgRNAs were additional predicted motifs (i.e. RXRA, EHF, ELF1, and STAT1). Although these sequences showed a high level of conservation among primates, they showed high degeneracy among nonprimate vertebrates (Fig. 4).
Figure 4. Primate-specific BCL11A enhancer functional core.

DHS h+58 functional core defined by maximal HbF enrichment score and Active HMM state. HbF enrichment scores shown by gray lines and circles. HbF indel enrichment per nucleotide based on amplicon genomic sequencing of sorted cells exposed to either sgRNA-1617 or -1621. No common SNPs (MAF>1%) present at this region. JASPAR motifs (P < 10-4) depicted in black with selected motifs annotated by TF based on known erythroid-specific function or genomic position. Gata1 motif LOGO at sgRNA-1617 cleavage position as described in text. Orthologous sequences listed from representative primates and nonprimates of distributed phylogeny. PhyloP (scale from -4.5 to 4.88) and PhastCons (from 0 to 1) estimates of evolutionary conservation among 100 vertebrates.
We tested the pattern of mutations observed upon treatment of cells with either sgRNA-1621 or sgRNA-1617 by deep sequencing. Each of these sgRNAs is sufficient to substantially induce HbF in human erythroid cells (Fig. 2h; Extended Data Fig. 3a, b). We sorted cells exposed to Cas9 and these sgRNAs into HbF-high and HbF-low pools. We determined the indel spectrum in each population by deep sequencing (Extended Data Fig. 4b). As expected we observed indels clustering around the predicted cleavage positions. By comparing the per nucleotide indel ratio between cells from the HbF-high and HbF-low pools, we calculated a relative indel enrichment across the sequencing amplicon. Notably both sgRNAs yielded maximal HbF indel enrichment not precisely at the expected cleavage position but offset at shared intervening sequences (Fig. 4). These sites of maximal HbF mutation enrichment mapped to 7 bp directly overlapping predicted motifs (Fig. 4). Taken together, these data suggest that a conserved GATA1 motif scoring below the prediction threshold adjacent to primate-specific sequences form the core of an enhancer essential for human erythroid BCL11A expression and HbF repression.
Mouse enhancer dissection
To test functional conservation of the BCL11A enhancer, we examined the orthologous mouse Bcl11a enhancer in greater detail. Erythroid DNase I sensitivity is only observed at those sequences homologous to h+55 and h+62 and not h+58 (Extended Data Fig. 6a), consistent with the reduced sequence homology within the h+58 Active region (Fig. 3a-c). We performed a pooled CRISPR enhancer saturating mutagenesis screen in MEL εy:mCherry reporter cells, similar to the human screen described above (Extended Data Fig. 6, 7; Supplementary Information).
Upon mapping the sgRNA cleavage positions to the genome, we again observed that the majority of enhancer targeting sgRNAs demonstrated no significant εy enrichment or depletion. We observed colocalization of sets of sgRNAs with εy enrichment (Fig. 5a). There was a similar complex pattern at the m+55 ortholog as at h+55, with adjacent regions with enriching and depleting sgRNAs from the high-εy:mCherry pool at the DHS core. At the m+58 ortholog we did not observe any evidence of εy enriching or depleting sgRNAs. At the m+62 ortholog there was a marked peak, with five sgRNAs with εy enrichment scores exceeding 1.30, the median enrichment score of Bcl11a exon-2 targeting sgRNAs (Fig. 5a). This potent impact of the m+62 ortholog was in contrast to the modest impact of individual sgRNAs or DHS deletion at h+62.
Figure 5. Functional sequence requirement at the mouse Bcl11a erythroid enhancer for in vivo hemoglobin switching.

a, Mapping sgRNA εy enrichment scores to genomic cleavage positions. Nontargeting sgRNAs pseudo-mapped with 5 bp spacing. b, BCL11A expression in mouse erythroid clones with deletion or inversion of individual DHSs relative to nondeleted controls. c, Transgenic human β-like globin expression in β-YAC/+62 deletion mice. For +/+, +/Δ, and Δ/Δ: at E12.5, n = 5, 11, and 3 embryos respectively; at E14.5, n = 2, 3, and 4; at E16.5, n = 2, 4, and 1; at E18.5, n = 3, 1, and 3. Error bars represent s.e.m.
We used pairs of sgRNAs in the presence of Cas9 to produce MEL clones with deletions of various substituent elements at the Bcl11a enhancer (Fig. 5b). Deletion of the DNase-insensitive m+58 ortholog had no apparent effect on BCL11A expression consistent with the pooled screen result. Deletion of the m+55 ortholog led to an approximately two-fold reduction in BCL11A expression (mean residual level 49%, p<0.0001), whereas deletion of the m+62 ortholog approached deletion of the entire composite enhancer in terms of reduction in BCL11A expression (mean residual levels of 8% (p<0.0001) and 6% (p<0.0001) respectively, Fig. 5b; also see Supplementary Information and Extended Data Fig. 8, 9). In addition, clones in which the m+62 ortholog was inverted showed no change in BCL11A expression, suggesting that the mouse, like the human, enhancer functions independent of orientation in situ (Fig. 2c-e; 5b).
Erythroid-restricted function in vivo
To substantiate the importance of the m+62 ortholog for BCL11A expression and to validate BCL11A enhancer disruption as a therapeutic strategy, we generated mice deficient for the Bcl11a m+62 ortholog. We used the same Cas9 and paired sgRNA deletion strategy in mouse embryonic stem cells, from which we derived mice with germline transmission of the enhancer deletion. Previous studies have demonstrated essential roles for Bcl11a in structural development of the central nervous system and B-lymphopoiesis40–42. Strikingly, unlike conventional Bcl11a knockouts, which die hours after birth, m+62 ortholog deletion mice were born healthy at expected Mendelian ratios (Extended Data Fig. 10a). The m+62 ortholog deletion mice also showed normal frequencies of B-cell progenitors in the fetal liver and mature B-lymphocytes in the adult peripheral blood (Extended Data Fig. 10b, c). Other hematopoietic lineages were also observed at wild-type frequencies (Extended Data Fig. 10c). BCL11A expression was unperturbed in the brain or sorted B cell precursors from E16.5 embryos (Extended Data Fig. 10d). In contrast, there was substantial reduction in BCL11A levels in sorted E16.5 erythroid precursors (26% residual, P<0.05; Extended Data Fig. 10d).
The m+62 ortholog deletion mice were bred to mice transgenic for the human β-globin cluster (β-YAC) to model the role of BCL11A in hemoglobin switching43. Unlike its fetal-stage expression in humans, in the mouse fetal liver transgenic human γ-globin is subject to intense repression (like an embryonic globin). Bcl11a is required for this early murine silencing of transgenic γ-globin at E14.5, although even in the absence of Bcl11a, γ-globin is ultimately repressed32,33. Fetal livers were evaluated between days E12.5 and E18.5 to monitor hemoglobin switching. Repression of human γ-globin and activation of human β-globin was markedly delayed in the m+62 ortholog deleted mice (Fig. 5c). Heterozygous mice showed an intermediate γ-globin derepression phenotype, underscoring the dose-dependent inverse relationship between BCL11A and HbF level. These results indicate that targeting the erythroid enhancer of BCL11A in vivo results in erythroid-specific disruption of BCL11A expression and relaxed repression of γ-globin, unaccompanied by the obvious neurologic and immunologic toxicities seen in the BCL11A conventional knockout context.
Discussion
We employed a novel application of CRISPR-Cas9 genome editing, saturating mutagenesis of noncoding elements in situ, to provide important insight into the organization and function of the BCL11A erythroid enhancer. Traditional tests of enhancer function rely on ectopic heterologous reporter assays and/or correlative biochemical features. Genome editing allows facile evaluation of the requirement of enhancer sequences within their endogenous chromatin context for appropriate gene regulation. As shown here, high-resolution high-throughput pooled tiling sgRNA screening reveals underlying enhancer sequence requirements approaching nucleotide resolution. A limitation to the resolution of this approach is the availability of NGG PAM sequences in a given region. We did not observe efficient editing by SpCas9 with NAG restricted sgRNAs (Extended Data Fig 2f, 6i). Recent studies have identified Cas9 orthologs and variants restricted by alternate PAM sequences, each capable of efficient genome editing44–46. This increased targeting range of Cas9 could allow increased resolution for in situ mutagenesis, particularly at sequences with paucity of NGG motifs. Alternatively, approaches reliant on homology-directed repair47 could offer nucleotide resolution functional mutagenesis of noncoding sequences, though issues of efficiency, fidelity, and quantitative sensitivity would need to be considered. We suggest that our tiled pooled CRISPR screening approach could be readily adapted to the functional interrogation of numerous noncoding genomic elements.
In addition, these data demonstrate that apparent sequence conservation at the BCL11A enhancer masks underlying functional divergence. The mouse and human BCL11A erythroid composite enhancers share primary sequence homology, an erythroid enhancer chromatin signature, and syntenic intronic position relative to coding sequences. Moreover, both are required for erythroid expression of BCL11A and repression of embryonic/fetal globin genes. However, our high-resolution CRISPR mutagenesis analysis reveals divergence in the architecture of these enhancers. Of note, human BCL11A enforces the γ- to β-globin developmental switch around the time of birth. The timing and nature of these switches and the globin genes themselves are distinct in primates as compared to nonprimate vertebrates that only exhibit a mid-gestation embryonic to adult switch48. Therefore it would seem plausible that critical regulatory mechanisms at BCL11A might differ between species (also see Supplementary Information).
The hemoglobin disorders represent one of the most common Mendelian inherited human conditions. The level of HbF is a key modifier of clinical severity of these diseases and BCL11A is the chief regulator of HbF level48. Natural occurring genetic variation at the BCL11A enhancer is well-tolerated and associated with HbF level and β-hemoglobin disorder clinical severity. The work presented here offers a framework for therapeutic genome editing of the BCL11A enhancer for β-hemoglobin disorders. Enhancer disruption by individual sgRNAs in primary erythroid precursors results in substantial HbF induction. This approach may mitigate erythroid-specific growth disadvantages of complete BCL11A loss (Fig. 3b). Furthermore erythroid enhancer disruption may spare BCL11A expression and function in nonerythroid contexts, such as B-lymphopoiesis (Extended Data Fig 10b-d). A challenge for the field is that it is not yet possible to accurately model HbF repression experimentally. However, individuals haploinsufficient for BCL11A due to microdeletions exhibit marked neurologic deficits, and elevated HbF beyond that seen in homozygotes for high-HbF common enhancer haplotypes49,50. Taken together, these data suggest that perturbation of critical sequences within the BCL11A enhancer defined here may result in HbF levels exceeding a clinical threshold required to ameliorate the β-hemoglobin disorders.
Methods
Generation of genomic deletions in HUDEP-2 cells
HUDEP clone 2 (HUDEP-2), was utilized as previously described34. HUDEP-2 cells were expanded in StemSpan SFEM (Stem Cell Technologies) supplemented with 10-6 M dexamethasone (Sigma), 100 ng/mL human stem cell factor (SCF) (R&D), 3 IU/mL erythropoietin (Amgen), 1% L-glutamine (Life Technologies), and 2% penicillin/streptomycin. 1 μg/mL doxycycline (Sigma) was included in the culture to induce expression of the human papilloma virus type 16 E6/E7 genes34. HUDEP-2 cells were differentiated in Iscove's Modified Dulbecco's Medium (IMDM) (Life Technologies) supplemented with 330 μg/mL holo-transferrin (Sigma), 10 μg/mL recombinant human insulin (Sigma), 2 IU/mL heparin (Sigma), 5% human solvent detergent pooled plasma AB (Rhode Island Blood Center), 3 IU/mL erythropoietin, 100 ng/mL human SCF, 1 μg/mL doxycycline, 1% L-glutamine, and 2% penicillin/streptomycin.
Tandem sgRNA lentiviruses were transduced into HUDEP-2 with stable Cas9 expression (Supplementary Table 1). Bulk cultures were incubated for 7-10 days with 10 μg/mL blasticidin and 1 μg/mL puromycin selection to allow for editing. Then bulk cultures were plated clonally at limiting dilution. 96 well plates with greater than 30 clones per plate were excluded to avoid mixed clones. After approximately 14 days of clonal expansion, genomic DNA was extracted using 50 μL QuickExtract DNA Extraction Solution per well (Epicentre). Clones were screened for deletion by conventional PCR with one PCR reaction internal to segment to be deleted (‘non-deletion band’) and one gap-PCR reaction across the deletion junction (‘deletion band’) that would only amplify in the presence of deletion36. Biallelic deletion clones were identified as the absence of the non-deletion PCR band and the presence of the deletion PCR band. Inversion clones were identified as previously described by PCR36 (Supplementary Table 3). Briefly inversion clones had one inverted allele and one deleted allele without the presence of nondeletion alleles. In our experience biallelic inversion clones are very rare events36. PCR was performed using the Qiagen HotStarTaq 2× master mix and the following cycling conditions: 95°C for 15 minutes; 35 cycles of 95°C for 15 seconds, 60°C for 1 minute, 72°C for 1 minute; 72°C for 10 minutes. Alternatively, PCR was also performed using 2× Accuprime Supermix II (Life Technologies) with the following cycling conditions: 94°C for 2 minutes; 35 cycles of 94°C for 20 seconds, 60°C for 20 seconds, 68°C for 1 min/kb of PCR product; 68°C for 5 minutes. RNA was extracted from each positive clone using a kit (Qiagen) and quantitative real-time RTqPCR was performed using iQ SYBR Green Supermix (Bio-Rad). Primers used are found in Supplementary Table 5. Gene expression was normalized to that of GAPDH. We isolated four control, one BCL11A null, three composite enhancer deleted, one h+55 deleted, one h+58 deleted, five h+62 deleted, three h+55 inverted, and two h+58 inverted clones. The BCL11A null clone had a 216 bp interstitial deletion of exon 2, preventing binding of the RT-qPCR primers. All gene expression data reported from these clones represents the mean of at least three technical replicates.
Design and synthesis of human and mouse lentiviral sgRNA libraries
Every 20-mer sequence upstream of an NGG or NAG PAM sequence on the plus or minus strand was identified for both the human and mouse orthologous +55, +58, and +62 DNase I hypersensitive site (DHS) as well as BCL11A/Bcl11a exon 2 (Extended Data). Relative to the human hg19 reference genome, a reference was used with the following substitutions to approximate a common low-HbF associated haplotype: rs1427407-G, rs1896293-T, rs6706648-T, rs6738440-G, rs7606173-C. The mouse orthologous sequences to each of the human DHSs were defined by using the liftOver tool of UCSC Genome Browser as previously described28. Each of the sgRNA oligos were synthesized as previously described25,51,52 and cloned using a Gibson Assembly master mix (New England Biolabs) into lentiGuide-Puro (Addgene plasmid ID 52963) which had been BsmBI digested, PCR purified, and dephosphorylated. Gibson Assembly products were transformed to electrocompetent cells (E. cloni, Lucigen). Sufficient colonies were isolated to ensure ∼90× library coverage for both human and mouse libraries. Plasmid libraries were deep sequenced to 533× and 813× coverage for human and mouse libraries respectively to confirm representation.
To produce lentivirus, HEK293T cells were cultured with Dulbecco's Modified Eagle's Medium (DMEM) (Life Technologies) supplemented with 10% fetal bovine serum (FBS) (Omega Scientific) and 2% penicillin-streptomycin (Life Technologies) in 15 cm tissue culture treated petri dishes. HEK293T were transfected at 80% confluence in 12 mL of media with 13.3 μg psPAX2, 6.7 μg VSV-G, and 20 μg of the lentiviral construct plasmid of interest using 180 μg of linear polyethylenimine (Polysciences). Medium was changed 16-24 hours after transfection. Lentiviral supernatant was collected at 48 and 72 hours post-transfection and subsequently concentrated by ultracentrifugation (24,000 rpm for 2 hours at 4°C with Beckman Coulter SW 32 Ti rotor).
Tiled pooled CRISPR-Cas9 screen for in situ functional mapping the human BCL11A erythroid enhancer
HUDEP-2 cells with stable Cas9 expression were transduced at low multiplicity with the human sgRNA library lentivirus pool while in expansion medium. Control transductions were performed to ensure transduction rate did not exceed 50%. Cell numbers were maintained throughout the experiment at levels adequate to exceed 1000× representation of the library. 10 μg/mL blasticidin (Sigma) and 1 μg/mL puromycin (Sigma) were added 24 hours after transduction to select for lentiviral library integrants in cells with Cas9. Cells were cultured in expansion media for one week followed by differentiation media for an additional week.
Intracellular staining was performed by fixing cells with 0.05% glutaraldehyde (grade II) (Sigma) for 10 minutes at room temperature. Cells were centrifuged for 5 minutes at 600 g and then resuspended in 0.1% Triton-X 100 (Life Technologies) for 5 minutes at room temperature for permeabilization. Triton X-100 was diluted with phosphate buffered saline (PBS) with 0.1% BSA and then centrifuged at 600 g for 15 minutes. Cells were stained with anti-human antibodies for HbF (clone HbF-1 with FITC or APC conjugation; Life Technologies) and β-hemoglobin antibody (clone 37-8 with PerCP-Cy5 or PE conjugation; Santa Cruz) for 20 minutes in the dark. Cells were washed to remove unbound antibody prior to FACS analysis. 0.2 μg HbF and 2 μg of HbA (β-hemoglobin) antibodies were used per 5 million cells. Control cells exposed to a nontargeting sgRNA sample and BCL11A exon 2 were used as negative and positive controls respectively to establish flow cytometry conditions. Populations of cells with the top and bottom 10% of expression of HbF were sorted by FACS.
After sorting the HbF-high and HbF-low pools, library preparation and deep sequencing was performed as previously described25. Briefly, genomic DNA was extracted using the Qiagen Blood and Tissue kit. Herculase PCR reaction (Agilent) using lentiGuide-Puro specific primers (5′-AATGGACTATCATATGCTTACCGTAACTTGAAAGTATTTCG-3′ and 5′- CTTTAGTTTGTATGTCTGTTGCTATTATGTCTACTATTCTTTCCC-3′) including a handle sequence was performed as follows: Herculase II reaction buffer (1×), forward and reverse primers (0.5 μM each), dimethyl sulfoxide (DMSO) (8%), deoxynucleotide triphosphates (dNTPs) (0.25 mM each), Herculase II Fusion DNA Polymerase (0.5 reactions) using the following cycling conditions: 95°C for 2 minutes; 20 cycles of 95°C for 15 seconds, 60°C for 20 seconds, 72°C for 30 seconds; 72°C for 5 minutes. Multiple reactions of no more than 200 ng each were used to amplify from 6.6 ug gDNA (∼1e6 cell genomes) per pool. Samples were subjected to a second PCR using handle-specific primers25 to add adaptors and indexes to each sample using the following conditions: Herculase II reaction buffer (1×), forward and reverse primers (0.5 μM each), dNTPs (0.25 mM each), Herculase II Fusion DNA Polymerase (0.5 reactions) with the following cycling conditions: 95°C for 2 minutes; 25 cycles of 95°C for 15 seconds, 60°C for 20 seconds, 72°C for 30 seconds; 72°C for 5 minutes. PCR products were run on an agarose gel and the band of expected size was gel purified. Illumina MiSeq 150 bp paired end sequencing was performed.
sgRNA sequences present in the plasmid pool as well as in the HbF-high and HbF-low pools were enumerated. Guide sequences were mapped to the guides comprising the sgRNA library without allowing mismatches. Total reads were normalized to library sequencing depth. Cellular dropout score was determined by calculating (1) the ratio of normalized reads in the cells at end of experiment (average of reads in the HbF-high and HbF-low pools) to reads in the plasmid pool; (2) log2 transformation; and (3) median of biological replicates. HbF enrichment score was determined by calculating (1) the ratio of normalized reads in the HbF-high compared to reads in the HbF-low pools; (2) log2 transformation; and (3) median of biological replicates. After exclusion of sgRNAs with dropout scores < 2-3 and NAG PAM sgRNAs, a Q-Q plot was made with a line fitted through the first and third quantiles using R software. HbF enrichment scores and cellular dropout scores were compared by Spearman rank correlation. sgRNA sequences were mapped to the human genome (hg19) with cleavage positions set to between positions 17 and 18 given PAM positions 21-23. For visual comparisons to targeting sgRNAs, nontargeting sgRNAs were pseudomapped each separated by 5 bp.
Validation in primary human CD34+ hematopoietic stem and progenitor cells (HSPCs)
Primary human CD34+ HSPCs from G-CSF mobilized healthy adult donors were obtained from the Center of Excellence in Molecular Hematology at the Fred Hutchinson Cancer Research Center, Seattle, Washington. CD34+ HSPCs were subject to erythroid differentiation liquid culture as previously described53. Briefly, HSPCs were thawed on day 0 into erythroid differentiation medium (EDM) consisting of IMDM supplemented with 330 μg/mL holo-human transferrin, 10 μg/mL recombinant human insulin, 2 IU/mL heparin, 5% human solvent detergent pooled plasma AB, 3 IU/mL erythropoietin, 1% L-glutamine, and 2% penicillin/streptomycin. During days 0-7 of culture, EDM was further supplemented with 10-6 M hydrocortisone (Sigma), 100 ng/mL human SCF, and human IL-3 (R&D). During days 7-11 of culture, EDM was supplemented with 100 ng/mL human SCF only. During days 11-18 of culture, EDM had no additional supplements.
HSPCs were transduced with lentiCas9-Blast (Addgene plasmid ID 52962) 24 hours after thawing in the presence of 10 μM 16,16-dimethylprostaglandin E2 (PGE2; Cayman Chemical). At 48 hours after thawing, medium was changed and cells were transduced with lentiGuide-Puro or lentiGuide-Crimson cloned with relevant sgRNA sequence in the presence of 10 μM PGE2. Three independent transductions were performed per sgRNA. At 72 hours after thawing, medium was changed and HSPCs were selected with 10 μg/mL blasticidin and 1 μg/mL puromycin or 10 μg/mL blasticidin followed by sorting for lentiGuide-Crimson+ cells on day 16 of culture. Blasticidin and/or puromycin selection occurred from days 3 to 8 of culture.
Differentiation was assessed on day 18 of culture using anti-human antibodies against the transferrin receptor (CD71) [Clone OKT9 with FITC conjugation; eBioscience] and glycophorin A (CD235a) [Clone HIR2 with PE conjugation; eBioscience]. Enucleation was assessed using 2 μg/mL of the cell-permeable DNA dye Hoescht 33342 (Life Technologies). CD235a+Hoescht 33342- cells were determined to be enucleated erythroid cells. Cells were intracellularly stained for HbF and HbA on day 18 of culture as described above. 50,000-100,000 cells were centrifuged onto microscope slides at 350rpm for 4 minutes. Slides were stained with Harleco May-Grünwald stain (Millipore) for two minutes, Giemsa stain (Sigma) for 12 minutes, and two water washes for 30 seconds each. Slides were air dried and then cover-slipped using Fisher Chemical Permount Mounting Medium (Fisher). RNA isolation and RT-qPCR was performed as above. Gene expression was normalized to that of GAPDH. All gene expression data represents the mean of at least three technical replicates.
PCR primers were designed to amplify the genomic cleavage site for a given sgRNA. Resulting PCR products were subjected to Sanger sequencing. Sequencing traces were used for editing quantification using a previously described publically available tool54.
Computational analysis
Human erythroid H3K27ac ChIP-seq was obtained from Xu et al7 and mouse erythroid H3K27ac ChIP-seq was obtained from Kowalczyk et al55 and Dogan et al56. We uniformly processed all the datasets using the same pipeline with the same criteria to call super-enhancers. Specifically, we started from raw reads and realigned each dataset with Bowtie2 with the default parameters. We then removed duplicate reads with the Picard Suite. To call the peaks we used MACS2 in the narrow mode. Finally to call the super-enhancers we used the ROSE algorithm with the default parameters10. Using these settings, peaks closer than 12.5 kb are stitched together and then ranked based on the H3K27ac intensity. To assign super-enhancers to genes we used again ROSE with default settings. In particular, the tool reports three categories of genes for each super-enhancer: 1) overlapping genes - genes for which the gene body region overlaps a super-enhancer; 2) proximal genes - genes close to a SE considering a window of 50kb; 3) closest gene - closest gene considering its TSS and the center of the super-enhancer. To generate a Venn diagram of genes for super-enhancer datasets, we used the union of these three gene categories.
Hidden Markov Model (HMM) segmentation was performed to automatically segment the enrichment score signals into enhancer regions with Active, Repressive and Neutral effect. We designed a HMM with 3 states using the GHMM package (http://ghmm.sourceforge.net/). To learn the HMM parameters we used the Baum-Welch algorithm. To find the best segmentation for each region we used the Viterbi algorithm. The emission probability for each state was modeled as a Gaussian distribution and all the possible transitions between states were allowed as shown in Extended Data Fig. 3a. Since the signal was not obtained with a constant genomic resolution, we interpolated and smoothed the signal using a Gaussian kernel over 12 bp and applied the HMM to the smoothed signal. To set the initial parameters, we used the 1%, 50% and 99% percentile of the smoothed signal for the prior of the means of the Repressive, Neutral and Active states respectively, while the prior for the standard deviation was set to 0.001 for all the three states.
Motif analysis was performed to evaluate the human and mouse enhancer regions for potential binding sites for known transcription factors (TFs). We used the FIMO software57 with a P-value threshold of < 10-4. For each region we extracted sequences using the hg19 and mm9 assemblies respectively for human and mouse. The motif database was the latest version of the JASPAR database58.
Deep sequencing paired-end reads of genomic amplicons from genome editing target sites were first filtered for reads with PHRED quality score <30, merged with the FLASH (Fast Length Adjustment of SHort reads) software, and subsequently aligned to a reference amplicon using the needle aligner from the EMBOSS suite (http://emboss.sourceforge.net/) to quantify insertions and deletions. Per nucleotide frequency of deletion of a position, insertion directly adjacent to the position, or no mutation at the position was quantitated using CRISPResso (https://github.com/lucapinello/CRISPResso).
Pooled CRISPR-Cas9 screen for high resolution functional mapping of mouse Bcl11a enhancer
Murine erythroleukemia (MEL, MEL-745A cl. DS19) cells were cultured in DMEM supplemented with 10% FBS, 1% L-glutamine, and 2% penicillin-streptomycin as previously described28,36. Cell lines tested negative for mycoplasma contamination. εy:mCherry reporter MEL cells with stable Cas9 expression were transduced at low multiplicity with the mouse sgRNA library lentivirus pool (Extended Data). Control transductions were performed to ensure transduction rate did not exceed 50%. Cell numbers were maintained throughout the experiment at levels adequate to exceed 1000× representation of the library. 10 μg/mL blasticidin and 1 μg/mL puromycin were added 24 hours after transduction to select for lentiviral library integrants in cells with Cas9. Subsequently cells were cultured for two weeks. The top and bottom 5% of εy-mCherry-expressing cells exposed to the library were sorted by FACS. A nontargeting sgRNA sample was used as a negative control and Bcl11a exon 2 as a positive control to establish flow cytometry conditions. After sorting, library preparation and deep sequencing were performed as described for the human library25.
sgRNA sequences present in the Hbb-εy:mCherry-high and Hbb-εy:mCherry-low pools were enumerated. Cellular dropout and εy enrichment scores were calculated analogously to the human screen. sgRNA sequences were then mapped to the mouse genome (mm9).
Generation of genomic deletions in MEL cells
Deletions in MEL cells were generated using two sgRNA as previously described36. Briefly, sgRNA sequences were cloned into pX330 (Addgene plasmid ID 42230) using a Golden Gate assembly cloning strategy (Supplementary Table 1 and 4). MEL cells were electroporated with 5 μg of each pX330-sgRNA plasmid and 0.5 μg pmax-GFP (Lonza) in BTX electroporation buffer using a BTX electroporator (Harvard Apparatus). Approximately 48 hours post-electroporation, the top 1-3% of GFP+ cells were sorted and plated clonally at limiting dilution. Clones were allowed to grow for 7-10 days. Clones were screened for deletion by conventional PCR using the same strategy as with the HUDEP-2 cells (Supplementary Table 2). Inversion clones were identified by PCR as previously described36 (Supplementary Table 3).
Generation of genomic deletions in mouse embryonic stem cells (mESCs)
mESCs were maintained on irradiated mouse embryonic fibroblasts (GlobalStem) and cultured in high glucose DMEM supplemented with 20% FBS, L-glutamine, penicillin/streptomycin (Life Technologies), non-essential amino acids (Life Technologies), nucleosides, β-mercaptoethanol (Sigma), and leukemia inhibitory factor (Millipore). Cells were passaged using 0.25% trypsin (Life Technologies).
The Bcl11a +62 deletion mice were derived from CRISPR-Cas9 modified CJ9 ES cells. Using Amaxa ES Cell transfection reagent (Lonza), two million mESCs cells were electroporated with 2 μg of each pX330 plasmid vector containing individual target sequences flanking the +62 site along with 0.5 μg of a GFP plasmid. After 48 hours, the top 5% of GFP expressing cells were sorted, plated on irradiated fibroblasts and maintained. Individual ES cell colonies were then picked and screened for biallelic deletion using the same strategy as HUDEP-2 and MEL cells36. DNA for screening CRISPR-Cas9 modified clones was obtained from gelatin adapted ES cell clones to avoid genomic contamination from the fibroblasts. Correctly targeted clones with greater than 80% normal karyotype were used to generate mice. Clones were injected into embryonic day 3.5 (E3.5) C57Bl6 blastocysts and implanted into pseudo-pregnant females.
The β-YAC mouse line (A20), previously described as containing a transgene encompassing ∼150 kb of the human β-globin locus43, was used to analyze human globin expression. The mouse line was maintained in a hemizygous state and bred with Bcl11a +62 deletion mice. Sufficient matings were established to ensure adequate homozygotes for analysis.
Mouse cell and tissue analysis
For developmental hematopoiesis, fetal liver cells were taken at E12.5, E14.5, E16.5, and E18.5 and mechanically dissociated to form single cell suspensions from which RNA was extracted using the RNeasy Plus Mini Kit (Qiagen) and analyzed. At E16.5, fetal liver were also stained with CD19-PerCP-Cy5.5 (Clone 1D3; eBioscience), B220-APC (RA3-6B2; Biolegend), CD71-PE (Clone C2; BD Biosciences), and Ter119-FITC (Clone Ter119; BD Biosciences) to isolate B cells (B220+CD19+) and erythroid cells (Ter119+CD71+) by FACS for RNA extraction and BCL11A quantification. Additionally, flow cytometry was used to analyze fetal liver from E18.5 embryos. Single cell suspensions were stained with IgMFITC (Clone Il-41; eBioscience), CD19-PerCP-Cy5.5, (Clone 1D3; eBioscience), CD43-PE (Clone S7; eBioscience), AA4.1-PE-Cy7 (Clone AA4.1; BD Biosciences), B220-APC, (RA3-6B2; Biolegend), and DAPI (Invitrogen). For adult hematopoietic assays, peripheral blood was obtained from the tail vein of four week old male and female mice. Blood was collected in EDTA-coated tubes, red cells removed by 2% dextran (Sigma), residual red cells lysed with ammonium chloride solution (Stem Cell Technologies) and stained with the following anti-mouse antibodies: CD3e-FITC (Clone 145-2C11; Biolegend), CD19-PerCP-Cy5.5 (Clone 1D3; eBioscience), CD71-PE (Clone C2; BD Biosciences), NK1.1-PE-Cy5 (Clone PK136; Biolegend), Ter119-APC (Clone TER-119; Biolegend), Gr-1-eF450 (Clone RB6-8C5; eBioscience), B220-BV605 (RA3-6B2; Biolegend), Mac-1-BV510 (Clone M1/70; Biolegend), and 7-AAD (BD Biosciences). Fetal brain analysis was conducted on whole brains from E16.5 mouse embryos on ice cold PBS. Tissue was directly lysed into the RLT plus buffer (Qiagen) and total RNA extracted according to manufacturer's instructions provided in the RNeasy Plus Mini Kit. RT-qPCR performed as above, with gene expression normalized to Gapdh. All gene expression data represents the mean of at least three technical replicates. All animal experiments were conducted under the approval of the local Institutional Animal Care and Use Committee.
Cloning lentiCas9-Venus
Venus template59 was PCR amplified to add BamHI-HF (5′) and EcoRI-HF (3′) restriction sites for cloning purposes using the following conditions: KOD buffer (1×), MgSO4 (1.5 mM), dNTPs (0.2 mM each), forward primer (0.3 μM; GGCCGGCCggatccGGCGCAACAAACTTCTCTCTGCTGAAACAAGCCGGAGATGTCGA AGAGAATCCTGGACCGATGGTGAGCAAGGGCGAGGA), reverse primer (0.3 μM; GGCCGGCCgaattcTTACTTGTACAGCTCGTCCA), and KOD Hot Start DNA Polymerase (0.02 U/μL) (Millipore). KOD PCR reaction used the following cycling conditions: 95°C for 2 minutes; 50 cycles of 95°C for 20 seconds, 60°C for 20 seconds, and 70°C for 30 seconds; 60°C for 5 minutes. PCR products were purified (QIAquick PCR Purification Kit, Qiagen) and blunt end cloned with Zero Blunt PCR cloning kit (Invitrogen). PCR-blunt cloned products and lentiCas9-Blast (Addgene plasmid ID 52962) were separately digested with BamHI-HF (New England Biolabs) and EcoRI-HF (New England Biolabs) in 1× Buffer CutSmart at 37°C (New England Biolabs). Digest of lentiCas9-Blast was performed to remove the blasticidin cassette. Then digested PCR product was ligated into the lentiCas9 backbone.
Cloning lentiGuide-Crimson
E2-Crimson template (Clontech) was PCR amplified to add BsiWI (5′) and MluI (3′) restriction sites for cloning purposes using the following conditions: KOD buffer (1×), MgSO4 (1.5 mM), dNTPs (0.2 mM each), forward primer (0.3 μM; GGCCGGCCCGTACGcgtacgGCCACCATGGATAGCACTGAGAACGTCATCAAGCCCTT), reverse primer (0.3 μM; GGCCGGCCacgcgtCTACTGGAACAGGTGGTGGCGGGCCT), and KOD Hot Start DNA Polymerase (0.02 U/μL). KOD PCR reaction used the following cycling conditions: 95°C for 2 minutes; 50 cycles of 95°C for 20 seconds, 60°C for 20 seconds, and 70°C for 30 seconds; 60°C for 5 minutes. PCR products were purified (QIAquick PCR Purification Kit) and cloned with Zero Blunt PCR cloning kit. Cloned products and lentiGuide-puro were separately digested with BsiWI (New England Biolabs) and MluI (New England Biolabs) in 1× Buffer 3.1 at 37°C (New England Biolabs). Digest of lentiGuide-Puro (Addgene plasmid ID 52963) was performed to remove the puromycin cassette. Then digested PCR product was ligated into the lentiGuide backbone.
Cloning sgRNAs
lentiGuide-Puro (Addgene plasmid ID 52963) was digested with BsmBI in 1× Buffer 3.1 at 37°C (New England Biolabs) for linearization. One unit of TSAP thermosensitive Alkaline Phosphatase (Promega) was added for 1 hour at 37°C to dephosphorylate the linearized lentiGuide and then TSAP was heat inactivated at 74°C for 15 minutes. Linearized and dephosphorylated lentiGuide was run on an agarose gel and gel purified. sgRNA-specifying oligos were phosphorylated and annealed using the following conditions: sgRNA sequence oligo (10 μM); sgRNA sequence reverse complement oligo (10 μM); T4 ligation buffer (1×) (New England Biolabs); and T4 polynucleotide kinase (5 units) (New England Biolabs) with the following temperature conditions: 37 °C for 30 min; 95 °C for 5 min; and then ramp down to 25 °C at 5 °C/min. Annealed oligos were ligated into lentiGuide in a 1:3 ratio (vector:insert) using T4 ligation buffer (1×) and T4 DNA Ligase (750 Units) (New England Biolabs. Plasmids were verified by sequencing using a U6F promoter forward primer CGTAACTTGAAAGTATTTCGATTTCTTGGC.
sgRNA-specifying oligos using sgRNA sequences from the screen library (Extended Data) were obtained and cloned as described into either lentiGuide-Puro or lentiGuide-Crimson. sgRNA constructs were used to produce lentivirus and transduce HUDEP-2 with stable Cas9 expression. Bulk cultures were incubated for 7-10 days with 10 μg/mL blasticidin and 1 μg/mL puromycin selection to allow for editing. Then bulk cultures were plated clonally at limiting dilution. Clones were allowed to grow for approximately 14 days and then genomic DNA was extracted using 50 μL QuickExtract DNA Extraction Solution per well.
lentiTandemGuide cloning
lentiGuide-sgRNA1 was digested with PspXI and XmaI at 37°C for four hours (New England Biolabs). Digests were run on an agarose gel and gel purified. lentiGuide-sgRNA2 was linearized using NotI (New England Biolabs). The hU6 promoter and sgRNA chimeric backbone for lentiGuide-sgRNA2 was PCR amplified using the following conditions: KOD buffer (1×), MgSO4 (1.5 mM), dNTPs (0.2 mM each), forward primer (0.3 μM; GGCCGGCCgctcgaggGAGGGCCTATTTCC), reverse primer (0.3 μM; CCGGCCGGcccgggTTGTGGATGAATACTGCCATTT), and KOD Hot Start DNA Polymerase (0.02 U/μL) (Millipore). KOD PCR reaction used the following cycling conditions: 95°C for 2 minutes; 50 cycles of 95°C for 20 seconds, 60°C for 20 seconds, and 70°C for 30 seconds; 60°C for 5 minutes. PCR products were purified (QIAquick PCR Purification Kit), blunt ended cloned with Zero Blunt PCR cloning kit, transformed, and plated. Colonies were screened by digesting minipreps with EcoRI. Mini-preps were then digested with PspXI and XmaI as described above followed by PCR purification. Following PCR purification, sgRNA2 was ligated into digested lentiGuide-sgRNA1. Sequence verified with following primers: GGAGGCTTGGTAGGTTTAAGAA and CCAATTCCCACTCCTTTCAA.
Generation of HUDEP-2 with stable Cas9
lentiCas9-Blast (Addgene plasmid ID 52962) or lentiCas9-Venus were produced as described above and used to transduce HUDEP-2 cells. Transduced cells were selected with 10 μg/mL blasticidin or Venus+ cells were sorted. Functional Cas9 was confirmed using the pXPR-011 (Addgene plasmid ID 59702) GFP reporter assay as previously described60.
Generation of εy:mCherry reporter MEL cells
A reporter MEL line in which mCherry was been knocked into the Hbb-y locus was created (Extended Data Figure 5a). Briefly, a TALEN-induced DSB was created adjacent to the Hbb-y transcriptional start site. A targeting vector with mCherry and a neomycin cassette were introduced through homology directed repair. Homology arms included mm9 sequences from chr7:111,001,667-111,002,675 and chr7:111,000,661-111,001,666. Cre-mediated recombination was utilized to remove the neomycin cassette. Long-range PCR spanning each homology arm was utilized to ensure appropriate targeted integration. Cells were tested upon Bcl11a disruption by RT-qPCR and flow cytometry to confirm expected effects on εy:mCherry derepression. Subsequently CRISPR-Cas9 was used as described above to produce cells with monoallelic composite enhancer deletion to maximize screening sensitivity for enhancer disruption.
Generation of MEL cells with stable Cas9 expression
lentiCas9-Blast (Addgene plasmid ID 52962) lentivirus were produced as described above and used to transduce MEL cells. Transduced cells were selected with 10 μg/mL blasticidin. Functional Cas9 was confirmed using the pXPR-011 (Addgene plasmid ID 59702) GFP reporter assay as previously described60.
Extended Data
Extended Data Figure 1. Human BCL11A locus.

a, Schematic of the human BCL11A locus (hg19, transcription from right to left) with erythroid chromatin marks and trait-associated haplotype denoted, and composite enhancer as previously defined28. b, Ranked enhancers in primary human adult erythroid precursors by H3K27ac signal intensity, with super-enhancers shaded, and super-enhancer associated genes indicated.
Extended Data Figure 2. Tiled pooled in situ CRISPR-Cas9 BCL11A enhancer screen.
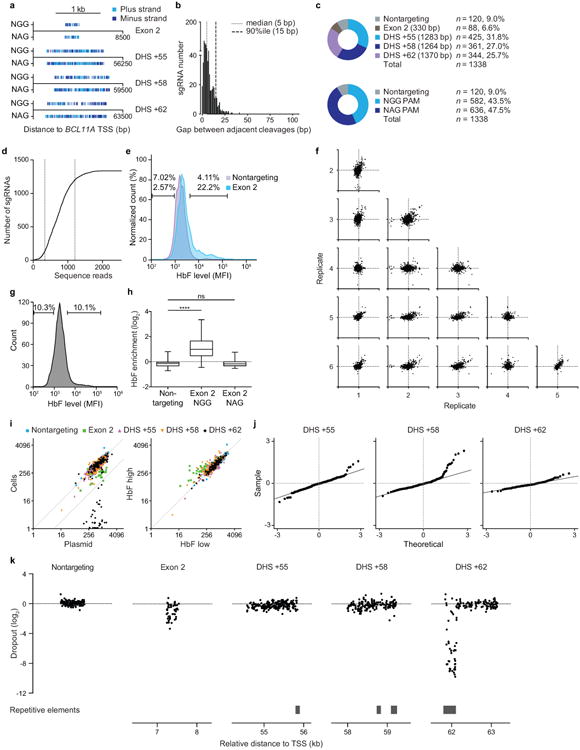
a, Distribution of NGG and NAG PAM sgRNAs mapped to genomic cleavage position. The vertical lines represent cleavage sites for sgRNAs mapped to plus and minus strands. b, Gap distance between adjacent genomic cleavage position for NAG PAM sgRNAs. c, Library composition by target sequence and PAM restriction. d. Representation of both NGG and NAG sgRNA (1,338 sgRNAs in total) within the plasmid pool by deep-sequencing. The median was 718 normalized reads and the 10th and 90th percentiles (indicated by the vertical dotted lines) ranged from 337 to 1,205 normalized reads. e, HbF distribution in HUDEP-2 cells transduced with Cas9 and individual sgRNAs, either nontargeting or targeting BCL11A exon 2. f, HbF enrichment scores of NGG sgRNAs in six biological replicates. g, Sort of library-transduced cells into HbF-high and HbF-low pools. h, Control sgRNA enrichment. Boxes demonstrate 25th, median, and 75th percentiles and whiskers minimum and maximum values. **** P < 0.0001, ns non-significant. i, NGG sgRNA representation in plasmid pool and cells at conclusion of experiment (left), and in HbF-high and HbF-low pools (right), with dotted lines at x=y and x=8y. j, Quantile-quantile plots of NGG sgRNA enrichment scores. k, Cellular dropout scores of NGG sgRNAs relative to genomic cleavage position and repetitive elements. Nontargeting sgRNAs pseudo-mapped with 5 bp spacing.
Extended Data Figure 3. Validation of enhancer screen.
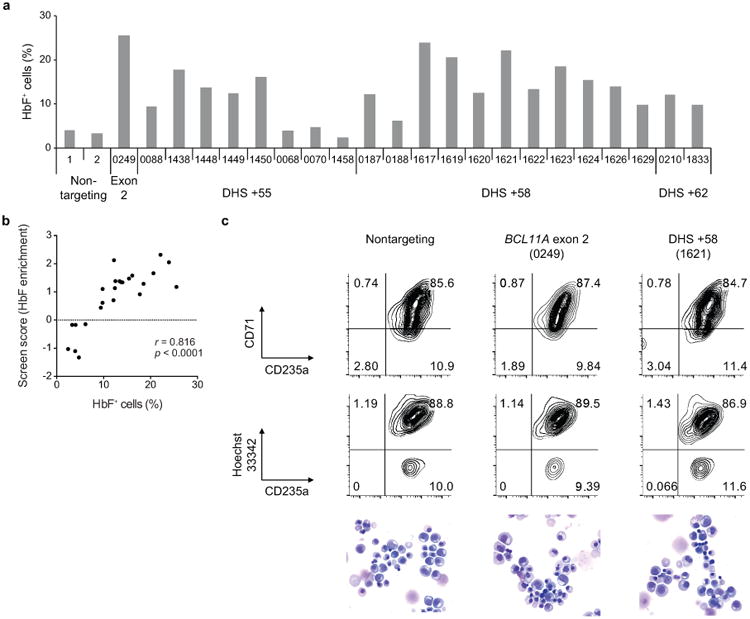
a, HbF+ fraction in HUDEP-2 cells transduced in arrayed format with 24 sgRNAs from all 5 mapping categories with enrichment scores ranging from the highest to the lowest in the screen. b, Correlation between HbF enrichment score from pooled sgRNA screen and HbF+ fraction by arrayed validation of individual sgRNAs in HUDEP-2 cells. c, Erythroid differentiation of primary human erythroid precursors evaluated by CD71 and CD235a surface markers, enucleation frequency (CD235a+ Hoescht33342-), and morphology by May-Grünwald-Giemsa staining.
Extended Data Figure 4. Functional assessment of enhancer sequences.

a, Topology of the Hidden Markov model (HMM) used to infer the three functional enhancer states (Active, Repressive, and Neutral). The emission probabilities of HbF enrichment scores from each state were modeled as Gaussian distributions (the values of μ and σ2 are shown). The transition probabilities (arrows) are displayed. b, Frequency distribution of indels from HUDEP-2 cells exposed to Cas9 and individual sgRNAs, sorted into HbF-high and -low pools, and subjected to deep sequencing of the target site. Indels calculated on a per nucleotide basis throughout an amplicon surrounding the sgRNA-1617 and -1621 cleavage sites (dotted lines). An indel enrichment ratio was calculated by dividing normalized indel frequencies in the HbF-high pool by those in the HbF-low pool.
Extended Data Figure 5. Functional cores of the BCL11A enhancer.
a-c, 200 bps at the functional cores of DHSs h+55, h+58, and h+62 defined by HMM states (Active red, Repressive green). HbF enrichment scores shown by gray lines and circles. HbF indel enrichment per nucleotide based on amplicon genomic sequencing of sorted cells exposed to either sgRNA-1617 (top) or -1621 (bottom). Common SNPs (MAF>1%) shown with dotted lines with HbF-low allele in blue and HbF-high allele in red; no common SNPs present at h+58 region. JASPAR motifs (P < 10-4) depicted in black except for those with allele-specific significance depicted by allelic color. Selected motifs annotated by TF based on known erythroid-specific function or genomic position. Motif LOGOs at key positions with motif scores P < 10-3 as described in text. Dotted boxes show regions of highest HbF enrichment score at each core with underlying predicted motifs. Orthologous sequences listed from representative primates and nonprimates of distributed phylogeny. PhyloP (scale from -4.5 to 4.88) and PhastCons (from 0 to 1) estimates of evolutionary conservation among 100 vertebrates. An arrow indicates a 144 bp insertion in the mouse genome relative to the human reference adjacent to the orthologous GATA1 motif at h+58.
Extended Data Figure 6. Tiled pooled in situ CRISPR-Cas9 Bcl11a enhancer screen.
a, Schematic of the mouse Bcl11a locus (mm9, transcription from left to right) with erythroid chromatin marks (top, dark blue H3K27ac from Kowalczyk et al55, middle, light blue H3K27ac from Dogan et al56, and bottom, black DNase I from Bauer et al28) and regions of primary sequence homology to the human DHSs displayed. Y-axes for H3K27ac tracks are both scaled to maximum 3.5 reads per million. Composite enhancer as previously defined28. b, Ranked enhancers in mouse erythroid precursors by H3K27ac signal intensity55,56, with super-enhancers shaded. Super-enhancer associated genes indicated by Venn diagram. c, Strategy to knock-in by homology-directed repair the fluorescent protein mCherry into the mouse embryonic globin Hbb-y locus (encoding the εy embryonic globin chain). d, Distribution of NGG and NAG PAM sgRNAs mapped to genomic cleavage position with vertical lines representing cleavage sites for sgRNAs mapped to plus and minus strands. e, Distance to adjacent genomic cleavage position for NGG (left) and NAG (right) PAM sgRNAs. f, Representation of the 1,271 NGG and NAG sgRNAs within the plasmid pool by deep-sequencing. The median was 735 normalized reads and the 10th and 90th percentiles (indicated by the vertical dotted lines) ranged from 393 to 1,240 normalized reads. g, Library composition by target sequence and PAM restriction. h, mCherry expression upon exposure to Cas9 and an individual NGG sgRNA targeting Bcl11a exon 2 in MEL εy:mCherry reporter cells. i, εy:mCherry sort of library transduced cells. j, Control sgRNA enrichment. Boxes demonstrate 25th, median, and 75th percentiles and whiskers minimum and maximum values. **** P < 0.0001. k, Enrichment scores of NGG sgRNAs between four biological replicates.
Extended Data Figure 7. Bcl11a enhancer screen analyses.

a, NGG sgRNA representation in plasmid pool and cells at conclusion of experiment (left), and in εy:mCherry-high and εy:mCherry-low pools (right), with dotted lines at x=y and x=8y. b, Quantile-quantile plots of NGG sgRNA εy enrichment scores. c, Cellular dropout scores of NGG sgRNAs relative to genomic cleavage position and repetitive elements. Nontargeting sgRNAs pseudo-mapped with 5 bp spacing. d, Correlation between cellular dropout and εy enrichment scores.
Extended Data Figure 8. Functional sequences at the Bcl11a erythroid enhancer.

a-c, HMM segmentation of active functional states at m+55, m+58, and m+62 orthologs. HbF enrichment scores shown as gray lines and circles with blue line representing smoothed enrichment score. DNase I sequencing from mouse fetal liver erythroid precursors28. PhyloP (scale from -3.3 to 2.1) and PhastCons (from 0 to 1) estimates of evolutionary conservation among 30 vertebrates. d, Top, BCL11A expression determined by RT-qPCR displayed as a heatmap in 108 hemizygous m+62 ortholog deletion clones ordered by genomic position of deletion midpoint. Each bar demonstrates the genomic position of the deletion breakpoints and the associated color demonstrates the level of BCL11A expression. Bottom, BCL11A expression determined by RT-qPCR in 108 hemizygous m+62 ortholog deletion clones. Per nucleotide mean effect size was calculated as the mean fold change in BCL11A expression from all clones in which that nucleotide was deleted. Gray shading represents one s.d. The BCL11A expression data are shown with same x-axis as in Extended Data Fig. 8c immediately above.
Extended Data Figure 9. Evaluation of the m+62 functional core.

200 bp at the functional core of the m+62 ortholog defined by HMM state. Enrichment scores shown as gray lines and circles with blue line representing smoothed enrichment score. JASPAR motifs (P < 10-4) depicted with selected motifs annotated by TF name based on known erythroid-specific function or genomic position. Orthologous human sequences listed. PhyloP (scale from -3.3 to 2.1) and PhastCons (from 0 to 1) estimates of evolutionary conservation among 30 vertebrates. Individual numbered hemizygous deletion clones with indicated breakpoints were evaluated by BCL11A immunoblot (C, control). Clones 9 and 10 encompass the entire m+62 ortholog.
Extended Data Figure 10. Requirement of Bcl11a erythroid enhancer during murine ontogeny.
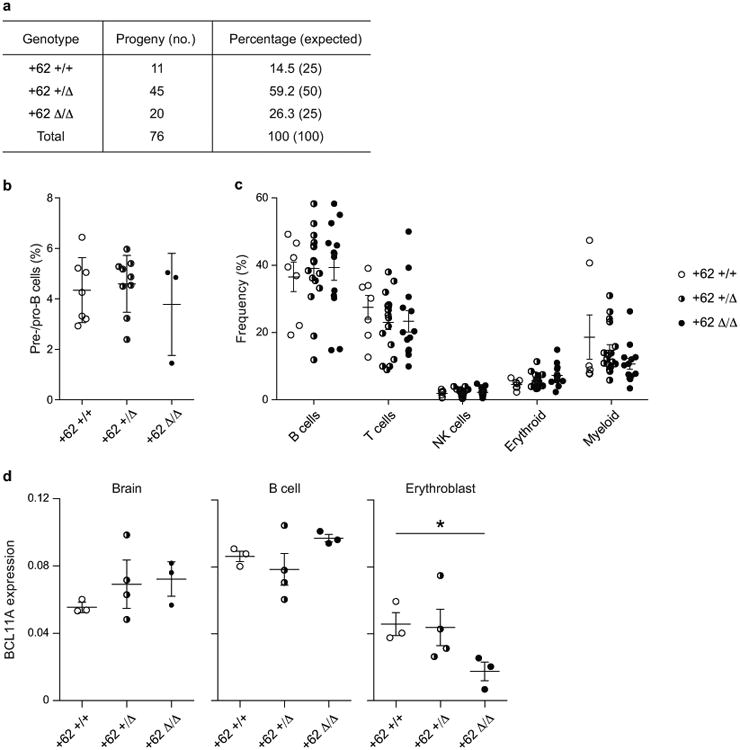
a, Progeny of heterozygous Bcl11a m+62 ortholog deletion intercrosses as compared to expected Mendelian ratio. b, Fraction of fetal liver comprised of B cell progenitors at E16.5 from various genotypes. c, Peripheral blood analysis from 4 week old mice to examine the frequency of various circulating hematopoietic lineages in Bcl11a m+62 ortholog deletion wild-type, heterozygous, and homozygous mice. d, BCL11A expression in β-YAC/+62 deletion mice (each symbol represents the mean expression from technical replicates from an individual mouse). * P < 0.05, error bars represent s.e.m.
Supplementary Material
Acknowledgments
We thank J. Hughes and D. Higgs for assistance with analysis of ChIP-seq, R. Mathieu and the Boston Children's Hospital Hematology/Oncology-HSCI Flow Cytometry Research Facility for cell sorting, Z. Herbert and F. Abderazzaq at the Dana-Farber Cancer Institute Molecular Biology Core Facility and Center for Cancer Computational Biology respectively for sequencing, J. Doench for providing TALENs, C. Peng for advice with MEL reporter cell generation, F. Godinho and M. Nguyen for technical help with ESCs and transgenic mice, A. Dass, C. Lin, and S. Kamran for general technical assistance, C. Brendel and D. Williams for input regarding lentiviral transduction of HSPCs, J. Desimini for graphical assistance and J. Xu and G. Lettre for insightful discussions. M.C.C. is supported by F30DK103359-01A1. E.C.S. is supported by a Jane Coffin Childs Memorial Fund for Medical Research Fellowship. L.P. is supported by NHGRI Career Development Award K99HG008399. N.E.S. is supported by a Simons Center for the Social Brain Postdoctoral Fellowship and NIH NHGRI award K99-HG008171. O.S. is supported by a fellowship from the Klarman Family Foundation. S.L. is supported by a Leukemia & Lymphoma Society Fellow Award. T.M. is supported by NIH R01 A1084905. G.C.Y. is supported by NIH R01HL119099 and R01HG005085. F.Z. is supported by the NIMH (5DP1-MH100706) and NIDDK (5R01-DK097768), a Waterman award from the National Science Foundation, the Keck, McKnight, Damon Runyon, Searle Scholars, Merkin, Vallee, and Simons Foundations, and Bob Metcalfe. S.H.O. is supported by P01HL032262 and P30DK049216 (Center of Excellence in Molecular Hematology). D.E.B. is supported by an NIDDK Career Development Award K08DK093705, Doris Duke Charitable Foundation Innovations in Clinical Research Award (2013137), and Charles H. Hood Foundation Child Health Research Award. Computational tools and instructions for designing CRISPR-Cas9 sgRNA libraries for conducting non-coding screening can be found at the Zhang laboratory website http://www.genome-engineering.org.
Footnotes
All reagents described in this manuscript have been deposited with Addgene. Source data are available online.
Author Contributions: D.E.B. conceived this study. N.E.S., O.S., and F.Z. conceived the pooled non-coding screening strategy using CRISPR-Cas9. M.C.C., N.E.S., O.S., F.Z., S.H.O., and D.E.B. designed and executed the pooled CRISPR screening strategy. E.C.S., F.S., Y.F., S.L., S.H.O., and D.E.B. designed, produced, and analyzed the transgenic mice. R.K. and Y.N. provided the HUDEP-2 cell line. M.C.C., F.S., T.M., S.H.O., and D.E.B. adapted the HUDEP-2 cell line as a model of globin gene regulation. M.C.C., F.S., D.C., P.S., D.S.V., and D.E.B. performed all experiments in cell lines. M.C.C., L.P., N.E.S., S.P.G., G.C.Y., F.Z., S.H.O., and D.E.B. analyzed the data. L.P., S.P.G. and G.C.Y. developed the HMM. M.C.C., S.H.O., and D.E.B. wrote the manuscript with input from all authors.
Competing financial interests: The authors declare competing financial interests: details are available in the online version of the paper. D.E.B. and S.H.O. are inventors on a patent related to this work. N.E.S., O.S., and F.Z. are inventors on a patent application related to the screening technology. F. Z. is a founder of Editas Medicine and scientific advisor for Editas Medicine and Horizon Discovery. S.H.O. is on the Scientific Advisory Board of Editas Medicine.
Contributor Information
Matthew C. Canver, Division of Hematology/Oncology, Boston Children's Hospital, Department of Pediatric Oncology, Dana-Farber Cancer Institute, Harvard Stem Cell Institute, Department of Pediatrics, Harvard Medical School, Boston, Massachusetts 02115, USA.
Elenoe C. Smith, Division of Hematology/Oncology, Boston Children's Hospital, Department of Pediatric Oncology, Dana-Farber Cancer Institute, Harvard Stem Cell Institute, Department of Pediatrics, Harvard Medical School, Boston, Massachusetts 02115, USA.
Falak Sher, Division of Hematology/Oncology, Boston Children's Hospital, Department of Pediatric Oncology, Dana-Farber Cancer Institute, Harvard Stem Cell Institute, Department of Pediatrics, Harvard Medical School, Boston, Massachusetts 02115, USA.
Luca Pinello, Department of Biostatistics and Computational Biology, Dana-Farber Cancer Institute and Harvard School of Public Health, Boston, Massachusetts 02115, USA.
Neville E. Sanjana, Broad Institute of MIT and Harvard, McGovern Institute for Brain Research, Department of Brain and Cognitive Sciences and Department of Biological Engineering, MIT, Cambridge, Massachusetts 02142, USA.
Ophir Shalem, Broad Institute of MIT and Harvard, McGovern Institute for Brain Research, Department of Brain and Cognitive Sciences and Department of Biological Engineering, MIT, Cambridge, Massachusetts 02142, USA.
Diane D. Chen, Division of Hematology/Oncology, Boston Children's Hospital, Department of Pediatric Oncology, Dana-Farber Cancer Institute, Harvard Stem Cell Institute, Department of Pediatrics, Harvard Medical School, Boston, Massachusetts 02115, USA
Patrick G. Schupp, Division of Hematology/Oncology, Boston Children's Hospital, Department of Pediatric Oncology, Dana-Farber Cancer Institute, Harvard Stem Cell Institute, Department of Pediatrics, Harvard Medical School, Boston, Massachusetts 02115, USA
Divya S. Vinjamur, Division of Hematology/Oncology, Boston Children's Hospital, Department of Pediatric Oncology, Dana-Farber Cancer Institute, Harvard Stem Cell Institute, Department of Pediatrics, Harvard Medical School, Boston, Massachusetts 02115, USA
Sara P. Garcia, Department of Biostatistics and Computational Biology, Dana-Farber Cancer Institute and Harvard School of Public Health, Boston, Massachusetts 02115, USA
Sidinh Luc, Division of Hematology/Oncology, Boston Children's Hospital, Department of Pediatric Oncology, Dana-Farber Cancer Institute, Harvard Stem Cell Institute, Department of Pediatrics, Harvard Medical School, Boston, Massachusetts 02115, USA.
Ryo Kurita, Cell Engineering Division, RIKEN BioResource Center, Tsukuba, Ibaraki, Japan.
Yukio Nakamura, Cell Engineering Division, RIKEN BioResource Center, Tsukuba, Ibaraki, Japan; Comprehensive Human Sciences, University of Tsukuba, Tsukuba, Ibaraki, Japan.
Yuko Fujiwara, Division of Hematology/Oncology, Boston Children's Hospital, Department of Pediatric Oncology, Dana-Farber Cancer Institute, Harvard Stem Cell Institute, Department of Pediatrics, Harvard Medical School, Boston, Massachusetts 02115, USA; Howard Hughes Medical Institute, Boston Massachusetts 02115, USA.
Takahiro Maeda, Division of Hematology, Department of Medicine, Brigham and Women's Hospital, Boston, Massachusetts 02115, USA.
Guo-Cheng Yuan, Department of Biostatistics and Computational Biology, Dana-Farber Cancer Institute and Harvard School of Public Health, Boston, Massachusetts 02115, USA.
Zhang Feng, Broad Institute of MIT and Harvard, McGovern Institute for Brain Research, Department of Brain and Cognitive Sciences and Department of Biological Engineering, MIT, Cambridge, Massachusetts 02142, USA.
Stuart H. Orkin, Howard Hughes Medical Institute, Boston Massachusetts 02115, USA.
Daniel E. Bauer, Division of Hematology/Oncology, Boston Children's Hospital, Department of Pediatric Oncology, Dana-Farber Cancer Institute, Harvard Stem Cell Institute, Department of Pediatrics, Harvard Medical School, Boston, Massachusetts 02115, USA.
References
- 1.Banerji J, Rusconi S, Schaffner W. Expression of a β-globin gene is enhanced by remote SV40 DNA sequences. Cell. 1981;27:299–308. doi: 10.1016/0092-8674(81)90413-x. [DOI] [PubMed] [Google Scholar]
- 2.Visel A, et al. ChIP-seq accurately predicts tissue-specific activity of enhancers. Nature. 2009;457:854–858. doi: 10.1038/nature07730. [DOI] [PMC free article] [PubMed] [Google Scholar]
- 3.Thurman RE, et al. The accessible chromatin landscape of the human genome. Nature. 2012;488:75–82. doi: 10.1038/nature11232. [DOI] [PMC free article] [PubMed] [Google Scholar]
- 4.Andersson R, et al. An atlas of active enhancers across human cell types and tissues. Nature. 2014;507:455–61. doi: 10.1038/nature12787. [DOI] [PMC free article] [PubMed] [Google Scholar]
- 5.Heintzman ND, et al. Histone modifications at human enhancers reflect global cell-type-specific gene expression. Nature. 2009;459:108–112. doi: 10.1038/nature07829. [DOI] [PMC free article] [PubMed] [Google Scholar]
- 6.Creyghton MP, et al. Histone H3K27ac separates active from poised enhancers and predicts developmental state. Proc Natl Acad Sci U S A. 2010;107:21931–21936. doi: 10.1073/pnas.1016071107. [DOI] [PMC free article] [PubMed] [Google Scholar]
- 7.Xu J, et al. Combinatorial assembly of developmental stage-specific enhancers controls gene expression programs during human erythropoiesis. Dev Cell. 2012;23:796–811. doi: 10.1016/j.devcel.2012.09.003. [DOI] [PMC free article] [PubMed] [Google Scholar]
- 8.Ernst J, et al. Mapping and analysis of chromatin state dynamics in nine human cell types. Nature. 2011;473:43–49. doi: 10.1038/nature09906. [DOI] [PMC free article] [PubMed] [Google Scholar]
- 9.Parker SCJ, et al. Chromatin stretch enhancer states drive cell-specific gene regulation and harbor human disease risk variants. Proc Natl Acad Sci U S A. 2013;110:17921–6. doi: 10.1073/pnas.1317023110. [DOI] [PMC free article] [PubMed] [Google Scholar]
- 10.Whyte WA, et al. Master Transcription Factors and Mediator Establish Super-Enhancers at Key Cell Identity Genes. Cell. 2013;153:307–319. doi: 10.1016/j.cell.2013.03.035. [DOI] [PMC free article] [PubMed] [Google Scholar]
- 11.Paul DS, et al. Maps of open chromatin guide the functional follow-up of genome-wide association signals: Application to hematological traits. PLoS Genet. 2011;7 doi: 10.1371/journal.pgen.1002139. [DOI] [PMC free article] [PubMed] [Google Scholar]
- 12.Maurano MT, et al. Systematic localization of common disease-associated variation in regulatory DNA. Science (80-) 2012;337:1190–1195. doi: 10.1126/science.1222794. [DOI] [PMC free article] [PubMed] [Google Scholar]
- 13.Hardison RC. Variable evolutionary signatures at the heart of enhancers. Nat Genet. 2010;42:734–735. doi: 10.1038/ng0910-734. [DOI] [PMC free article] [PubMed] [Google Scholar]
- 14.Vierstra J, et al. Mouse regulatory DNA landscapes reveal global principles of cis-regulatory evolution. Science. 2014;346:1007–1012. doi: 10.1126/science.1246426. [DOI] [PMC free article] [PubMed] [Google Scholar]
- 15.Villar D, et al. Enhancer Evolution across 20 Mammalian Species. Cell. 2015;160:554–566. doi: 10.1016/j.cell.2015.01.006. [DOI] [PMC free article] [PubMed] [Google Scholar]
- 16.Pennacchio La, et al. In vivo enhancer analysis of human conserved non-coding sequences. Nature. 2006;444:499–502. doi: 10.1038/nature05295. [DOI] [PubMed] [Google Scholar]
- 17.Melnikov A, et al. Systematic dissection and optimization of inducible enhancers in human cells using a massively parallel reporter assay. Nat Biotechnol. 2012;30:271–277. doi: 10.1038/nbt.2137. [DOI] [PMC free article] [PubMed] [Google Scholar]
- 18.Patwardhan RP, et al. Massively parallel functional dissection of mammalian enhancers in vivo. Nat Biotechnol. 2012;30:265–270. doi: 10.1038/nbt.2136. [DOI] [PMC free article] [PubMed] [Google Scholar]
- 19.Sexton T, Cavalli G. Review The Role of Chromosome Domains in Shaping the Functional Genome. Cell. 2015;160:1049–1059. doi: 10.1016/j.cell.2015.02.040. [DOI] [PubMed] [Google Scholar]
- 20.Bender M, Bulger M, Close J, Groudine M. Beta-globin gene switching and DNase I sensitivity of the endogenous beta-globin locus in mice do not require the locus control region. Mol Cell. 2000;5:387–393. doi: 10.1016/s1097-2765(00)80433-5. [DOI] [PubMed] [Google Scholar]
- 21.Johnson KD, et al. Cis-element mutated in GATA2-dependent immunodeficiency governs hematopoiesis and vascular integrity. J Clin Invest. 2012;122:3692–3704. doi: 10.1172/JCI61623. [DOI] [PMC free article] [PubMed] [Google Scholar]
- 22.Cong L, et al. Multiplex Genome Engineering Using CRISPR/Cas Systems. Science (80-) 2013;339:819–23. doi: 10.1126/science.1231143. [DOI] [PMC free article] [PubMed] [Google Scholar]
- 23.Mali P, et al. RNA-Guided Human Genome Engineering via Cas9. Science (80-) 2013;339:823–6. doi: 10.1126/science.1232033. [DOI] [PMC free article] [PubMed] [Google Scholar]
- 24.Wang T, Wei JJ, Sabatini DM, Lander ES. Genetic screens in human cells using the CRISPR-Cas9 system. Science (80-) 2014;343:80–4. doi: 10.1126/science.1246981. [DOI] [PMC free article] [PubMed] [Google Scholar]
- 25.Shalem O, et al. Genome-scale CRISPR-Cas9 knockout screening in human cells. Science (80-) 2014;343:84–7. doi: 10.1126/science.1247005. [DOI] [PMC free article] [PubMed] [Google Scholar]
- 26.Koike-Yusa H, Li Y, Tan EP, Velasco-Herrera MDC, Yusa K. Genome-wide recessive genetic screening in mammalian cells with a lentiviral CRISPR-guide RNA library. Nat Biotechnol. 2014;32:267–73. doi: 10.1038/nbt.2800. [DOI] [PubMed] [Google Scholar]
- 27.Zhou Y, et al. High-throughput screening of a CRISPR/Cas9 library for functional genomics in human cells. Nature. 2014;509:487–91. doi: 10.1038/nature13166. [DOI] [PubMed] [Google Scholar]
- 28.Bauer DE, et al. An Erythroid Enhancer of BCL11A Subject to Genetic Variation Determines Fetal Hemoglobin Level. Science (80-) 2013;342:253–257. doi: 10.1126/science.1242088. [DOI] [PMC free article] [PubMed] [Google Scholar]
- 29.Gröschel S, et al. A single oncogenic enhancer rearrangement causes concomitant EVI1 and GATA2 deregulation in Leukemia. Cell. 2014;157:369–381. doi: 10.1016/j.cell.2014.02.019. [DOI] [PubMed] [Google Scholar]
- 30.Mansour MR, et al. An oncogenic super-enhancer formed through somatic mutation of a noncoding intergenic element. Science (80-) 2014 doi: 10.1126/science.1259037. [DOI] [PMC free article] [PubMed] [Google Scholar]
- 31.Sankaran VG, et al. Human fetal hemoglobin expression is regulated by the developmental stage-specific repressor BCL11A. Science (80-) 2008;322:1839–1842. doi: 10.1126/science.1165409. [DOI] [PubMed] [Google Scholar]
- 32.Sankaran VG, et al. Developmental and species-divergent globin switching are driven by BCL11A. Nature. 2009;460:1093–1097. doi: 10.1038/nature08243. [DOI] [PMC free article] [PubMed] [Google Scholar]
- 33.Xu J, et al. Correction of sickle cell disease in adult mice by interference with fetal hemoglobin silencing. Science (80-) 2011;334:993–996. doi: 10.1126/science.1211053. [DOI] [PMC free article] [PubMed] [Google Scholar]
- 34.Kurita R, et al. Establishment of Immortalized Human Erythroid Progenitor Cell Lines Able to Produce Enucleated Red Blood Cells. PLoS One. 2013;8:e59890. doi: 10.1371/journal.pone.0059890. [DOI] [PMC free article] [PubMed] [Google Scholar]
- 35.Hardison RC, Blobel GA. GWAS to therapy by genome edits? Science (80-) 2013;342:206–7. doi: 10.1126/science.1245813. [DOI] [PMC free article] [PubMed] [Google Scholar]
- 36.Canver MC, et al. Characterization of Genomic Deletion Efficiency Mediated by Clusted Regularly Interspaced Palindromic Repeats (CRISPR)/Cas9 Nuclease System in Mammalian Cells. J Biol Chem. 2014;289:21312–21324. doi: 10.1074/jbc.M114.564625. [DOI] [PMC free article] [PubMed] [Google Scholar]
- 37.Mandal PK, et al. Efficient Ablation of Genes in Human Hematopoietic Stem and Effector Cells using CRISPR/Cas9. Cell Stem Cell. 2014;15:643–652. doi: 10.1016/j.stem.2014.10.004. [DOI] [PMC free article] [PubMed] [Google Scholar]
- 38.Ran FA, et al. Double nicking by RNA-guided CRISPR Cas9 for enhanced genome editing specificity. Cell. 2013;154:1380–9. doi: 10.1016/j.cell.2013.08.021. [DOI] [PMC free article] [PubMed] [Google Scholar]
- 39.Hsu PD, et al. DNA targeting specificity of RNA-guided Cas9 nucleases. Nat Biotechnol. 2013;31:827–32. doi: 10.1038/nbt.2647. [DOI] [PMC free article] [PubMed] [Google Scholar]
- 40.Liu P, et al. Bcl11a is essential for normal lymphoid development. Nat Immunol. 2003;4:525–532. doi: 10.1038/ni925. [DOI] [PubMed] [Google Scholar]
- 41.John A, et al. Bcl11a is required for neuronal morphogenesis and sensory circuit formation in dorsal spinal cord development. Development. 2012;139:1831–41. doi: 10.1242/dev.072850. [DOI] [PMC free article] [PubMed] [Google Scholar]
- 42.Yu Y, et al. Bcl11a is essential for lymphoid development and negatively regulates p53. J Exp Med. 2012;209:2467–2483. doi: 10.1084/jem.20121846. [DOI] [PMC free article] [PubMed] [Google Scholar]
- 43.Porcu BS, et al. The human β globin locus introduced by YAC transfer exhibits a specific and reproducible pattern of developmental regulation in transgenic mice. Blood. 1997;90:4602–4609. [PubMed] [Google Scholar]
- 44.Ran FA, et al. In vivo genome editing using Staphylococcus aureus Cas9. Nature. 2015;520:186–91. doi: 10.1038/nature14299. [DOI] [PMC free article] [PubMed] [Google Scholar]
- 45.Kleinstiver BP, et al. Engineered CRISPR-Cas9 nucleases with altered and improved PAM specificities. Nature. 2015 doi: 10.1038/nature14592. [DOI] [PMC free article] [PubMed] [Google Scholar]
- 46.Esvelt KM, et al. Orthogonal Cas9 proteins for RNA-guided gene regulation and editing. Nat Methods. 2013;10:1116–21. doi: 10.1038/nmeth.2681. [DOI] [PMC free article] [PubMed] [Google Scholar]
- 47.Findlay GM, Boyle Ea, Hause RJ, Klein JC, Shendure J. Saturation editing of genomic regions by multiplex homology-directed repair. Nature. 2014 doi: 10.1038/nature13695. [DOI] [PMC free article] [PubMed] [Google Scholar]
- 48.Bauer DE, Kamran SC, Orkin SH. Reawakening fetal hemoglobin: Prospects for new therapies for the beta-globin disorders. Blood. 2012;120:2945–2953. doi: 10.1182/blood-2012-06-292078. [DOI] [PMC free article] [PubMed] [Google Scholar]
- 49.Basak A, et al. Persistence of fetal hemoglobin and altered neurodevelopment due to BCL11A deletions. JCI. 2015 In press. [Google Scholar]
- 50.Funnell aPW, et al. 2p15-p16.1 microdeletions encompassing and proximal to BCL11A are associated with elevated HbF in addition to neurologic impairment. Blood. 2015 doi: 10.1182/blood-2015-04-638528. [DOI] [PMC free article] [PubMed] [Google Scholar]
- 51.Sanjana NE, Shalem O, Zhang F. Improved vectors and genome-wide libraries for CRISPR screening. Nat Methods. 2014;11:783–784. doi: 10.1038/nmeth.3047. [DOI] [PMC free article] [PubMed] [Google Scholar]
- 52.Chen S, et al. Genome-wide CRISPR Screen in a Mouse Model of Tumor Growth and Metastasis Resource Genome-wide CRISPR Screen in a Mouse Model of Tumor Growth and Metastasis. Cell. 2015;160:1–15. doi: 10.1016/j.cell.2015.02.038. [DOI] [PMC free article] [PubMed] [Google Scholar]
- 53.Giarratana M, et al. Proof of principle for transfusion of in vitro generated red blood cells. Blood. 2011;118:5071–5079. doi: 10.1182/blood-2011-06-362038. [DOI] [PMC free article] [PubMed] [Google Scholar]
- 54.Brinkman EK, Chen T, Amendola M, van Steensel B. Easy quantitative assessment of genome editing by sequence trace decomposition. Nucleic Acids Res. 2014:1–8. doi: 10.1093/nar/gku936. [DOI] [PMC free article] [PubMed] [Google Scholar]
- 55.Kowalczyk MS, et al. Intragenic Enhancers Act as Alternative Promoters. Mol Cell. 2012;45:447–458. doi: 10.1016/j.molcel.2011.12.021. [DOI] [PubMed] [Google Scholar]
- 56.Dogan N, et al. Occupancy by key transcription factors is a more accurate predictor of enhancer activity than histone modifications or chromatin accessibility. Epigenetics Chromatin. 2015;8:1–21. doi: 10.1186/s13072-015-0009-5. [DOI] [PMC free article] [PubMed] [Google Scholar]
- 57.Grant CE, Bailey TL, Noble WS. FIMO: Scanning for occurrences of a given motif. Bioinformatics. 2011;27:1017–1018. doi: 10.1093/bioinformatics/btr064. [DOI] [PMC free article] [PubMed] [Google Scholar]
- 58.Mathelier A, et al. JASPAR 2014: An extensively expanded and updated open-access database of transcription factor binding profiles. Nucleic Acids Res. 2014;42:142–147. doi: 10.1093/nar/gkt997. [DOI] [PMC free article] [PubMed] [Google Scholar]
- 59.Weber K, Bartsch U, Stocking C, Fehse B. A multicolor panel of novel lentiviral ‘gene ontology’ (LeGO) vectors for functional gene analysis. Mol Ther. 2008;16:698–706. doi: 10.1038/mt.2008.6. [DOI] [PubMed] [Google Scholar]
- 60.Doench JG, et al. Rational design of highly active sgRNAs for CRISPR-Cas9-mediated gene inactivation. Nat Biotechnol. 2014;32 doi: 10.1038/nbt.3026. [DOI] [PMC free article] [PubMed] [Google Scholar]
- 61.Ellis EL, Delbrück M. The Growth of Bacteriophage. J Gen Physiol. 1939;22:365–384. doi: 10.1085/jgp.22.3.365. [DOI] [PMC free article] [PubMed] [Google Scholar]
- 62.Stent G. Molecular Biology of Bacterial Viruses. W. H. Freeman and Company; 1963. [Google Scholar]
- 63.Choi C, Kuatsjah E, Wu E, Yuan S. The Effect of Cell Size on the Burst Size of T4 Bacteriophage Infections of Escherichia coli B23. J Exp Microbiol Immunol. 2010;14:85–91. [Google Scholar]
- 64.Cui F, Sirotin MV, Zhurkin VB. Impact of Alu repeats on the evolution of human p53 binding sites. Biol Direct. 2011;6:2. doi: 10.1186/1745-6150-6-2. [DOI] [PMC free article] [PubMed] [Google Scholar]
- 65.Crocker J, et al. Low Affinity Binding Site Clusters Confer Hox Specificity and Regulatory Robustness. Cell. 2015;160:191–203. doi: 10.1016/j.cell.2014.11.041. [DOI] [PMC free article] [PubMed] [Google Scholar]
Associated Data
This section collects any data citations, data availability statements, or supplementary materials included in this article.