Abstract
Purpose:
Lack of access to projection data from patient CT scans is a major limitation for development and validation of new reconstruction algorithms. To meet this critical need, this work developed and validated a vendor-neutral format for CT projection data, which will further be employed to build a library of patient projection data for public access.
Methods:
A digital imaging and communication in medicine (DICOM)-like format was created for CT projection data (CT-PD), named the DICOM-CT-PD format. The format stores attenuation information in the DICOM image data block and stores parameters necessary for reconstruction in the DICOM header under various tags (51 tags to store the geometry and scan parameters and 9 tags to store patient information). To validate the accuracy and completeness of the new format, CT projection data from helical scans of the ACR CT accreditation phantom were acquired from two clinical CT scanners (Somatom Definition Flash, Siemens Healthcare, Forchheim, Germany and Discovery CT750 HD, GE Healthcare, Waukesha, WI). After decoding (by the authors for Siemens, by the manufacturer for GE), the projection data were converted to the DICOM-CT-PD format. Off-line CT reconstructions were performed by internal and external reconstruction researchers using only the information stored in the DICOM-CT-PD files and the DICOM-CT-PD field definitions.
Results:
Compared with the commercially reconstructed CT images, the off-line reconstructed images created using the DICOM-CT-PD format are similar in terms of CT numbers (differences of 5 HU for the bone insert and −9 HU for the air insert), image noise (±1 HU), and low contrast detectability (6 mm rods visible in both). Because of different reconstruction approaches, slightly different in-plane and cross-plane high contrast spatial resolution were obtained compared to those reconstructed on the scanners (axial plane: GE off-line, 7 lp/cm; GE commercial, 7 lp/cm; Siemens off-line, 8 lp/cm; Siemens commercial, 7 lp/cm. Coronal plane: Siemens off-line, 6 lp/cm; Siemens commercial, 8 lp/cm).
Conclusions:
A vendor-neutral extended DICOM format has been developed that enables open sharing of CT projection data from third-generation CT scanners. Validation of the format showed that the geometric parameters and attenuation information in the DICOM-CT-PD file were correctly stored, could be retrieved with use of the provided instructions, and contained sufficient data for reconstruction of CT images that approximated those from the commercial scanner.
Keywords: CT, projection data, DICOM, open format, patient data library
1. INTRODUCTION
The development and evaluation of CT dose reduction methods, especially reconstruction algorithms, require direct access to patient CT projection data. Such projection data, particularly with known pathology, are essential for testing the clinical relevance of the reconstruction algorithm but are extremely time-consuming and expensive to obtain. To bridge this gap, we are building a library of reference patient datasets that will be freely available to academic researchers. The library will include projection and image data from clinically acquired patient scans for three common exam types (head, chest, and abdomen) and two common CT systems (Somatom Definition Flash, Siemens Healthcare, Forchheim, Germany; Discovery CT750 HD, GE Healthcare, Waukesha, WI), such that head-to-head comparisons of reconstruction algorithms can be performed to rapidly reach consensus on better-performing algorithms. The library will also include simulated projection data of reduced dose, generated using a validated noise-insertion technique,1 such that the trade-off between radiation dose and diagnostic performance can be evaluated.
The challenge in building such a library is the need for an open data format in which to store CT projection data. The commercial formats used to store projection data contain proprietary information and are encoded vendor-specifically, therefore not suitable for the proposed library. A format that potentially could be used for our library is the one developed by Battelle Memorial Institute as part of its Manhattan II algorithm standardization project.2 The format, referred to hereafter as the Battelle format, is an expanded digital imaging and communications in medicine (DICOM) format that stores the image acquisition parameters (scanning trajectory, detector geometry, etc.) in a DICOM header and the attenuation information in a DICOM image. The Battelle format is open and vendor-neutral. However, it was developed for a range of CT applications, including those of transportation security and nondestructive testing communities. As a result, the Battelle format involves over 150 DICOM tags, many of which are not needed in medical CT or for our reference patient library.
The purpose of this work was to develop a compact projection data format for medical CT, to validate its accuracy in blinded and unblinded studies, and to demonstrate the utility of the format with test patient data. Using the Battelle format as a reference, we developed a new format, DICOM-CT-PD, where CT stands for computed tomography and PD stands for projection data. The new format accommodates projection data of third-generation CT scanners in axial and helical scan modes with various detector shapes (cylindrical, spherical, and flat). Further, the new format was extended from the Battelle format to accommodate modern CT techniques such as the “flying focal spot” (FFS), a periodic motion of the focal spot used to improve spatial resolution.4 To confirm that the new format correctly stored all necessary information for reconstruction, commercial projection data from scans of a CT image quality phantom were converted into DICOM-CT-PD and the data were provided to internal and external CT reconstruction researchers, along with field tag definitions for reconstruction. The reconstructed images were then compared to commercially reconstructed CT images in terms of CT number accuracy, image noise, low contrast detectability, and high contrast spatial resolution. Finally, to demonstrate the potential research utility of the DICOM-CT-PD format, projection data from a chest patient scan were converted into DICOM-CT-PD and reconstructed by the external CT reconstruction researcher.
2. METHODS
2.A. Development of DICOM-CT-PD format
2.A.1. General structure
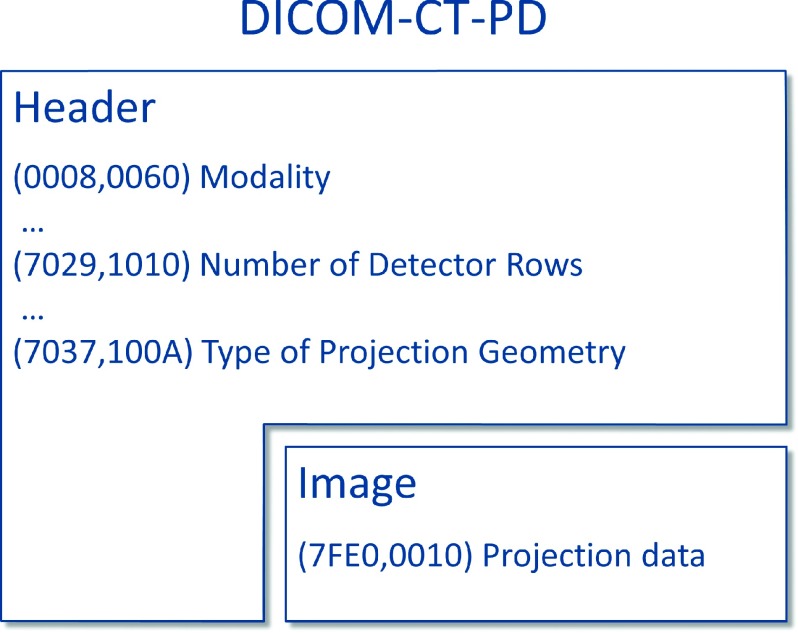
The DICOM-CT-PD format is an extended DICOM format. Each DICOM-CT-PD file stores a single CT projection as a vendor-neutral DICOM image, which can be divided into two components, the header and the image (Fig. 1). The header component stores all information necessary for image reconstruction, such as gantry geometry and x-ray energy spectrum. Following the DICOM standard, information in the header is identified and described by “tags,”3 with each tag corresponding to a field. Because the traditional DICOM standard does not provide tags to describe gantry geometry, the DICOM-CT-PD format defines a series of new tags to describe the geometrical properties of the x-ray source and detector, as well as their motion relative to the patient table. A list of tags is summarized in the Appendix (Table II).
FIG. 1.
Each DICOM-CT-PD file is a DICOM image and can be divided into two sections: the header and the image.
TABLE II.
Tags in the header of the DICOM-CT-PD format.
| Tag | Attribute name | VRa | VLb | Description |
|---|---|---|---|---|
| (0008,0016) | SOPClassUID | UI | 1 | A unique identifier for an SOP class |
| (0008,0060) | Modality | CS | 1 | “CT” |
| (0008,0070) | Manufacturer | LO | 1 | “SIEMENS” or “GE” |
| (0010,0040) | PatientSex | CS | 1 | “M” or “F” |
| (0010,1010) | PatientAge | AS | 1 | The age of the patient by year |
| (0018,0015) | BodyPartExamined | CS | 1 | The body part of the patient being scanned, e.g., “ABDOMEN” |
| (0018,0060) | KVP | DS | 1 | Peak voltage |
| (0018,0061) | HUCalibrationFactor | DS | 1 | A calibration factor μ′ for the conversion of linear attenuation coefficient μ to CT numbers (mm−1): CT numbers = 1000∗(μ − μ′)/μ′ |
| (0018,0090) | DataCollectionDiameter | DS | 1 | Scan field of view |
| (0018,1030) | ProtocolName | LO | 1 | The name of the protocol |
| (0018,1048) | ContrastBolusIngredient | CS | 1 | The ingredient of the contrast agent, e.g., “IODINE” |
| (0018,1150) | ExposureTime | IS | 1 | The gantry rotation time (ms) |
| (0018,1151) | XrayTubeCurrent | IS | 1 | The tube current |
| (0018,9311) | SpiralPitchFactor | FD | 1 | Pitch |
| (0020,000D) | StudyInstanceUID | UI | 1 | The unique ID for each study (scan) |
| (0020,000E) | SeriesInstanceUID | UI | 1 | The unique ID for each series |
| (0020,0011) | SeriesNumber | IS | 1 | The series number |
| (0020,0013) | InstanceNumber | IS | 1 | The instance (projection) number |
| (0028,1052) | RescaleIntercept | DS | 1 | The pixel values of the projection data need to be adjusted using the equation: projection data = projection data readout * RescaleSlope + RescaleIntercept |
| (0028,1053) | RescaleSlope | DS | 1 | |
| (0040,0315) | Timestamp | FL | 1 | The timestamp in absolute time (ms) |
| (5400,1011) | WaveformDataPoint | FL | 1 | EKG waveform data point corresponding to the projection |
| (7029,0010) | DetectorSystemArrangementModule | LO | 1 | The name of the module (all tags starting with 7029) that defines the geometry of a detector |
| (7029,1010) | NumberofDetectorRows | US | 1 | The number of detector rows |
| (7029,1011) | NumberofDetectorColumns | US | 1 | The number of detector columns |
| (7029,1002) | DetectorElementTransverseSpacing | FL | 1 | The width of each detector column, measured at the detector (mm) |
| (7029,1006) | DetectorElementAxialSpacing | FL | 1 | The width of each detector row, measured at the detector (mm) |
| (7029,100B) | DetectorShape | CS | 1 | The shape of the detector, such as “CYLINDRICAL,” “SPHERICAL,” or “FLAT” |
| (7031,0010) | DetectorDynamicsModule | LO | 1 | The name of the module (all tags starting with 7031) that defines the detector movement |
| (7031,1001) | DetectorFocalCenterAngularPositionArray | FL | 1 | φ0, the azimuthal angle of the detector’s focal center (rad) |
| (7031,1002) | DetectorFocalCenterAxialPositionArray | FL | 1 | z0, the z location of the detector’s focal center (mm) |
| (7031,1003) | DetectorFocalCenterRadialDistanceArray | FL | 1 | ρ0, the in-plane distance between the detector’s focal center and the isocenter (mm) |
| (7031,1031) | ConstantRadialDistance | FL | 1 | d0, the distance between the detector’s focal center and the detector element specified in Tag (7031,1033) (mm) |
| (7031,1033) | DetectorCentralElement | FL | 1 − n | (Column X, Row Y), the index of the detector element aligning with the isocenter and the detector’s focal center |
| (7033,0010) | SourceDynamicsModule | LO | 1 | The name of the module (all tags starting with 7033) that defines the source movement |
| (7033,100B) | SourceAngularPositionShiftArray | FL | 1 | Δφ, the φ offset from the focal spot to the detector’s focal center |
| (7033,100C) | SourceAxialPositionShiftArray | FL | 1 | Δz, the z offset from the focal spot to the detector’s focal center |
| (7033,100D) | SourceRadialDistanceShiftArray | FL | 1 | Δρ, the ρ offset from the focal spot to the detector’s focal center |
| (7033,100E) | FlyingFocalSpotMode | CS | 1 | The mode of FFS. “FFSNONE” means no flying focal spot; “FFSZ” means flying focal spot along axial direction; “FFSXY” means in-plane flying focal spot; and “FFSXYZ” means flying focal spot in-plane and along axial direction |
| (7033,1013) | NumberofSourceAngularSteps | US | 1 | The number of projections per complete rotation |
| (7033,1061) | NumberofSources | US | 1 | The number of sources/tube voltages/detector layers used for this scan |
| (7033,1053) | SourceIndex | US | 1 | The index of the source/tube voltage/detector layer, ranging from 1 to the number of sources/tube voltages/detector used in the scan |
| (7037,0010) | ProjectionDataDefinitions | LO | 1 | The name of the module (all tags starting with 7037) that defines the scan type |
| (7037,1009) | TypeofProjectionData | CS | 1 | “AXIAL” or “HELICAL” |
| (7037,100A) | TypeofProjectionGeometry | CS | 1 | “FANBEAM” for third-generation CT geometry |
| (7039,0010) | PreprocessingFlagsModule | LO | 1 | The name of the module (all tags starting with 7039) that defines the preprocessing procedures |
| (7039,1003) | BeamHardeningCorrectionFlag | CS | 1 | A flag used to define whether the projection data has been corrected for beam hardening effects. “YES” or “NO” |
| (7039,1004) | GainCorrectionFlag | CS | 1 | A flag used to define whether the projection data has been calibrated for detector response with respect to the dynamic range available. YES or NO |
| (7039,1005) | DarkFieldCorrectionFlag | CS | 1 | A flag used to define whether the background signals prior to the x-ray exposure has been subtracted from the projection data. YES or NO |
| (7039,1006) | FlatFieldCorrectionFlag | CS | 1 | A flag used to define whether the gradient of flood field introduced by the heel effect and the bowtie filter has been compensated in the projection data. YES or NO |
| (7039,1007) | BadPixelCorrectionFlag | CS | 1 | A flag used to define whether abnormal pixels have been removed from the projection data by interpolation. YES or NO |
| (7039,1008) | ScatterCorrectionFlag | CS | 1 | A flag used to define whether the projection data has been corrected for scattered radiation. YES or NO |
| (7039,1009) | LogFlag | CS | 1 | A flag used to define whether the projection data has been logarithmic transformed. YES or NO |
| (7041,0010) | LesionInformationModule | LO | 1 | The name of the module (all tags starting with 7041) that provides lesion information |
| (7041,1003) | NumberofLesions | US | 1 | The number of proven lesions in the patient |
| (7041,1004) | LesionPathologyArray | ST | 1 | The pathologies of the lesions. Each line corresponds to a lesion |
| (7041,1005) | LesionAngularPositionArray | FL | 1 − n | The azimuthal angles of the lesion centers (rad). Each element of the array corresponds to a lesion |
| (7041,1006) | LesionAxialPositionArray | FL | 1 − n | The z locations of the lesion centers (mm). Each element of the array corresponds to a lesion |
| (7041,1007) | LesionRadialDistanceArray | FL | 1 − n | The in-plane distances between the lesion centers and the isocenter (mm). Each element of the array corresponds to a lesion |
| (7FE0,0010) | PixelData | OW/OB | 1 | Projection data, an unsigned 16-bit matrix of measured linear attenuation coefficients |
VR: value representation; UI: unique identifier; CS: code string; LO: long string; AS: age string; DS: decimal string; IS: integer string; FD: floating point double; US: unsigned short; FL: floating point single; ST: short text; OW: other word string; OB: other byte string.
VL: variable length.
The image component of a DICOM-CT-PD file stores the CT projection as a matrix of 16-bit, unsigned numbers. In order for the matrix to represent the line integrals of the linear attenuation coefficients, a rescale intercept and a rescale slope need to be applied to the matrix, as described in the Appendix by Tags (0028,1052) and (0028,1053). The matrix has a dimension of (Ncol, Nrow), where Ncol is the number of detector columns and Nrow is the number of detector rows. Because each DICOM-CT-PD file stores only one projection, multiple DICOM-CT-PD files are generated for one scan, named a “series.” Normally, one scan consists of one series only; however, there are several conditions when multiple series are generated for one scan, including the following: (1) multisource scans such as from dual-source CT, where each series corresponds to one source, (2) scans with fast switching tube voltage,4 where each series corresponds to one tube voltage, and (3) scans with multiple-layer detector, where each series corresponds to one detector layer. When multiple series are generated for one scan, Tag (7033,1061) specifies the total number of sources/tube voltages/detector layers used in the scan, and Tag (7033,1063) specifies the source/tube voltage/detector layer that corresponds to the series.
2.A.2. Geometry definition
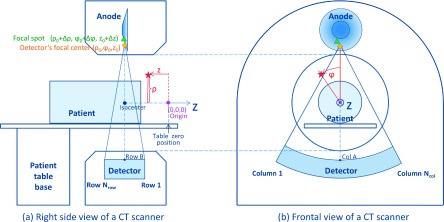
The tags in the header describe the gantry geometry in a cylindrical coordinate system (ρ, φ, z), as illustrated in Fig. 2. The coordinate origin, noted as the purple dot, is defined with respect to where the patient table is zeroed, such that the coordinate stays static with respect to the table and the patient as table moves (i.e., the source and the detector are translated in z for scans, not the table). The ρ, φ, and z for an arbitrary point (noted as the red star) are illustrated in Fig. 2. The radial distance ρ describes the in-plane distance from the center of rotation. The azimuthal angle φ zeroes at 12 o’clock position (viewing from the patient table base side) and increases counter-clockwise. The z-direction is parallel to the moving direction of the patient bed and points away from the patient table base. Using this definition of the coordinate system, the gantry geometry is described in terms of detector geometry, x-ray geometry, and gantry rotation, as detailed below.
FIG. 2.
The definition of the gantry geometry in a cylindrical coordinate system. The locations of the origin, the detector’s focal center, and the focal spot are marked as the purple dot, the yellow diamond, and the green triangle, respectively.
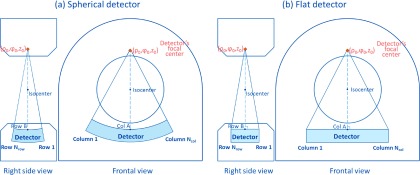
To describe the detector geometry, all detector elements are indexed with a “column” and “row” (Fig. 2). The term column refers to a line of elements parallel to the z direction, and the term row refers to a line of elements perpendicular to the z direction. The columns and rows are numbered in a certain order, as illustrated in Fig. 2. To define the location of each detector element, the location of the detector’s focal center, i.e., the focal point of the arc along which detector elements are placed, is first defined at (ρ0, φ0, z0) (noted as the yellow diamond in Fig. 2). Note that the detector illustrated in Fig. 2 is cylindrical. In case of spherical or flat detectors, the definition of the detector’s focal center is slightly different, as illustrated in Figs. 3(a) and 3(b), respectively. For a flat-panel detector, because the detector elements do not focus, the detector’s focal center is defined along the line perpendicular to the detector and through the gantry isocenter.
FIG. 3.
The definition of the detector’s focal center for (a) spherical and (b) flat detectors.
Next, the detector element aligning with the detector’s focal center and the isocenter is provided as E(Col A, Row B). If number A or B is not an integer, its decimal part represents a fraction of the column or row. For example, E(Col 369.625, Row 32.5) means that the line connecting the detector’s focal center and the gantry isocenter hits the position 0.625 of a column width from Column 369 toward Column 370, and half way in between Row 32 and Row 33. The coordinates of E(Col A, Row B) can be calculated according to (ρ0, φ0, z0) and the in-plane focal length of the detector arc. Finally, given the dimensions of each detector element and the shape of detector, the coordinates of the rest of the detector elements can be calculated.
To describe the x-ray source geometry, the coordinates of the focal spot (noted as the green triangle in Fig. 2) are provided. The location of focal spot normally coincides with the detector’s focal center but can also be slightly biased from it. To account for such potential offset, an adjustment of (Δρ, Δφ, Δz) is provided so that the coordinates of the focal spot can be computed as (ρ0 + Δρ, φ0 + Δφ, z0 + Δz). One example of such bias is found in data acquired with Siemens Definition Flash scanners. Furthermore, if flying focal spot technique is applied, the focal spot location moves periodically on the anode,5 with each location having different (Δρ, Δφ, Δz) values.
In addition to gantry geometry, the tube current, the timestamp, and the electrocardiogram (ECG) signal (if the scan is ECG-gated) are also recorded for each projection.
The DICOM-CT-PD format anonymizes patient names. However, tags have been included to provide basic information about the patient, including the age and gender of the patient, existing pathology, and the locations of proven lesions or nodules.
2.B. Validation of DICOM-CT-PD format
The gantry geometry defined in Sec. 2.A does not necessarily match the gantry geometry definition in commercial CT projection data. In addition, some information provided in DICOM-CT-PD was not directly provided by the vendor, but indirectly calculated by us (e.g., for data collected on Siemens scanners, the position of the focal spot was calculated according to the tube angle and the flying focal spot position). As a result, the accuracy of the DICOM-CT-PD format needed to be validated through off-line reconstructions. The off-line reconstructions also verified the completeness of the format and the sufficiency of the instructions given to the users of the format.
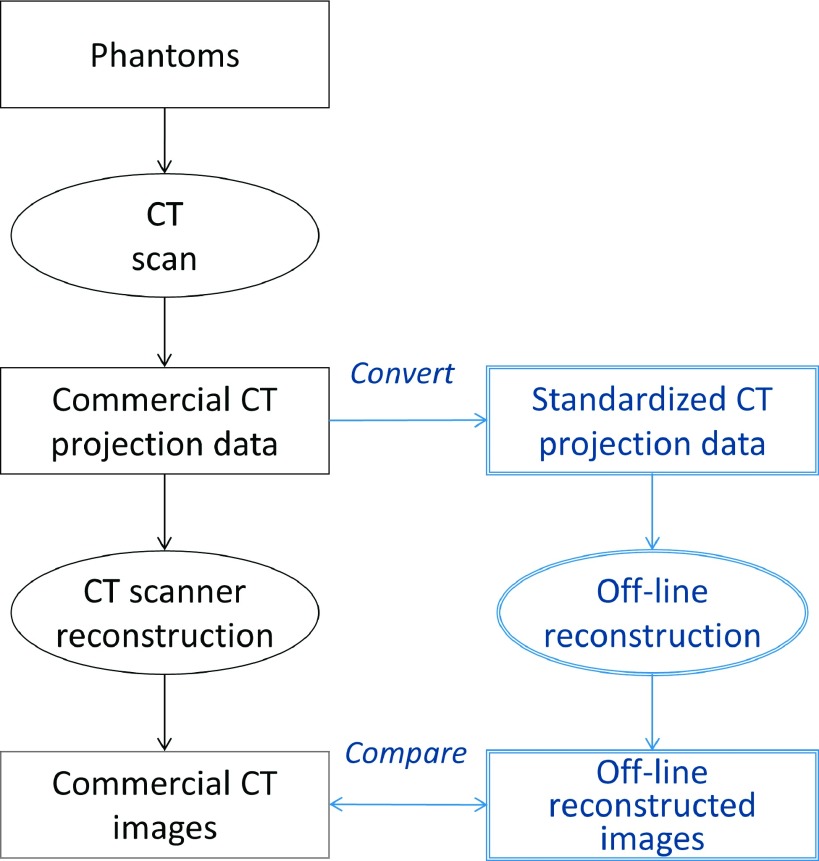
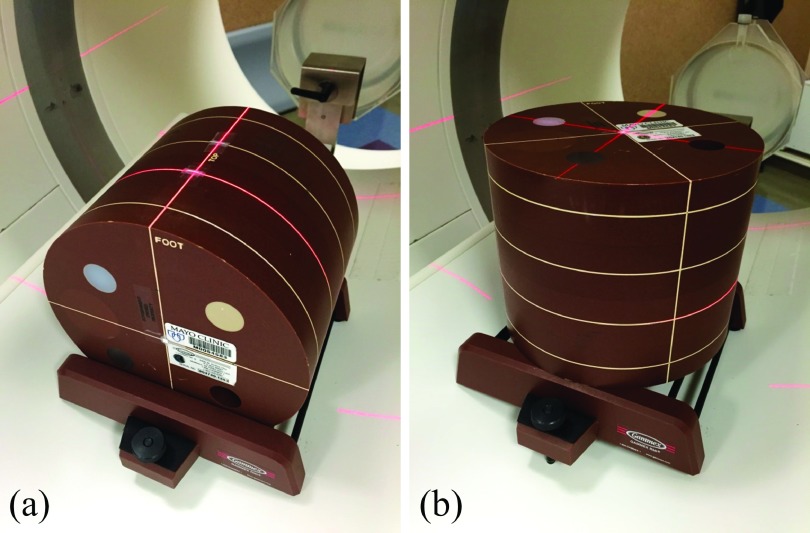
Figure 4 illustrates the validation process. Commercial CT projection data were acquired for helical scans of the ACR CT accreditation phantom6 on two clinical CT scanners (Somatom Definition Flash, Siemens Healthcare, Forchheim, Germany; Discovery CT750 HD, GE Healthcare, Waukesha, WI). The ACR CT accreditation phantom was scanned in both the normal position (cylindrical face parallel to the axial plane) and upright “coronal” position (cylindrical face parallel to the coronal plane), as illustrated in Fig. 5.
FIG. 4.
The validation process of the DICOM-CT-PD format.
FIG. 5.
The ACR CT accreditation phantom was scanned in (a) normal position and (b) upright coronal position.
2.B.1. Data acquisition
For the GE scanner, the commercial projection data were acquired in helical mode and decoded by the vendor. The decoded commercial projection data were relayed to us and converted into the DICOM-CT-PD format. For the Siemens scanner, commercial CT projection data were acquired in helical mode with the flying focal spot turned on in both the in-plane and z-axis directions. The commercial projection data were exported from the scanner, decoded by us with the help from the vendor, and converted into the DICOM-CT-PD format.
2.B.2. Data reconstruction and analysis
The following blinded and unblinded reconstructions were performed. First, the GE DICOM-CT-PD data were provided to a member of our research team with knowledge of CT image reconstruction techniques, along with the tag definitions. This person was not fully blinded to the process of developing the DICOM-CT-PD format, as he was a member of our internal team. The reconstruction method was based on advanced single slice rebinning.7 The apodization window was a Hamming filter. Next, to test if the complex geometry associated with the flying focal spot was accurately encoded, an external researcher familiar with this methodology was asked to perform the off-line reconstructions for the Siemens data. The external researcher used a Feldkamp-type reconstruction.8 The apodization window was Shepp–Logan filter. The effect of the flying focal spot was taken into account.
Both internal and external reconstruction researchers were provided with a user information booklet, which included an introduction to the format, a description of the geometry, and the definitions of all tags. The researchers were asked to reconstruct the provided projection data using this explanatory information and their own reconstruction techniques, and return the images to us for analysis.
CT number accuracy, image noise, low contrast detectability, and high contrast spatial resolution (in axial and coronal planes) were measured and compared for the images reconstructed from DICOM-CT-PD data and the images reconstructed from the commercial CT projection data file using the scanner consoles. To ensure a fair comparison, the reconstruction slice thickness, reconstruction kernel, and reconstruction field of view were kept as close as possible for the two sets of images. To minimize the uncertainty of the measurement, the CT number and the image noise were measured from five consecutive slices and averaged, using identical regions of interest (ROIs).
2.C. Demonstration of potential research utility
To demonstrate the potential research utility of the study, a Siemens raw data file from a patient’s chest scan was converted into DICOM-CT-PD format and reconstructed by the external researcher who reconstructed the Siemens flying focal spot data in Sec. 2.B.1.
3. RESULTS
3.A. Validation of DICOM-CT-PD format
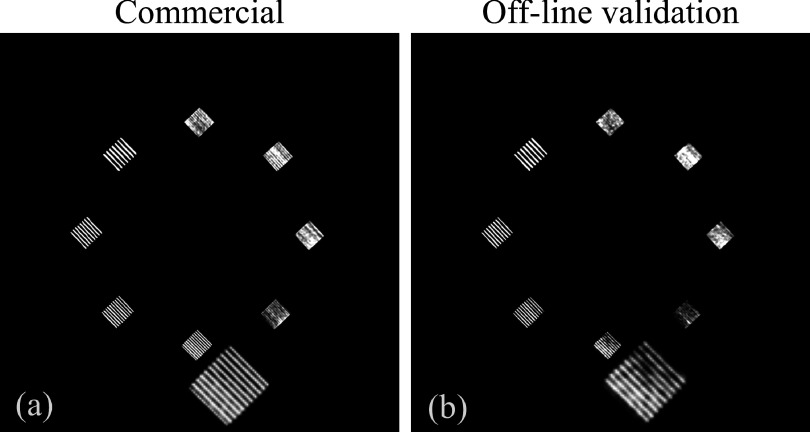
Figure 6 shows the off-line and commercially reconstructed CT images based on data collected from a GE scanner in helical mode. Both images have bar patterns visible at 7 lp/cm, although off-line reconstructed images had slightly worse axial plane resolution than commercial CT images, likely due to differences in reconstruction kernels between what we have implemented in our off-line reconstruction algorithm and what GE has implemented on its scanner.
FIG. 6.
(a) Commercial CT images and (b) images reconstructed off-line by our group, all based on data collected on a GE scanner in helical mode.
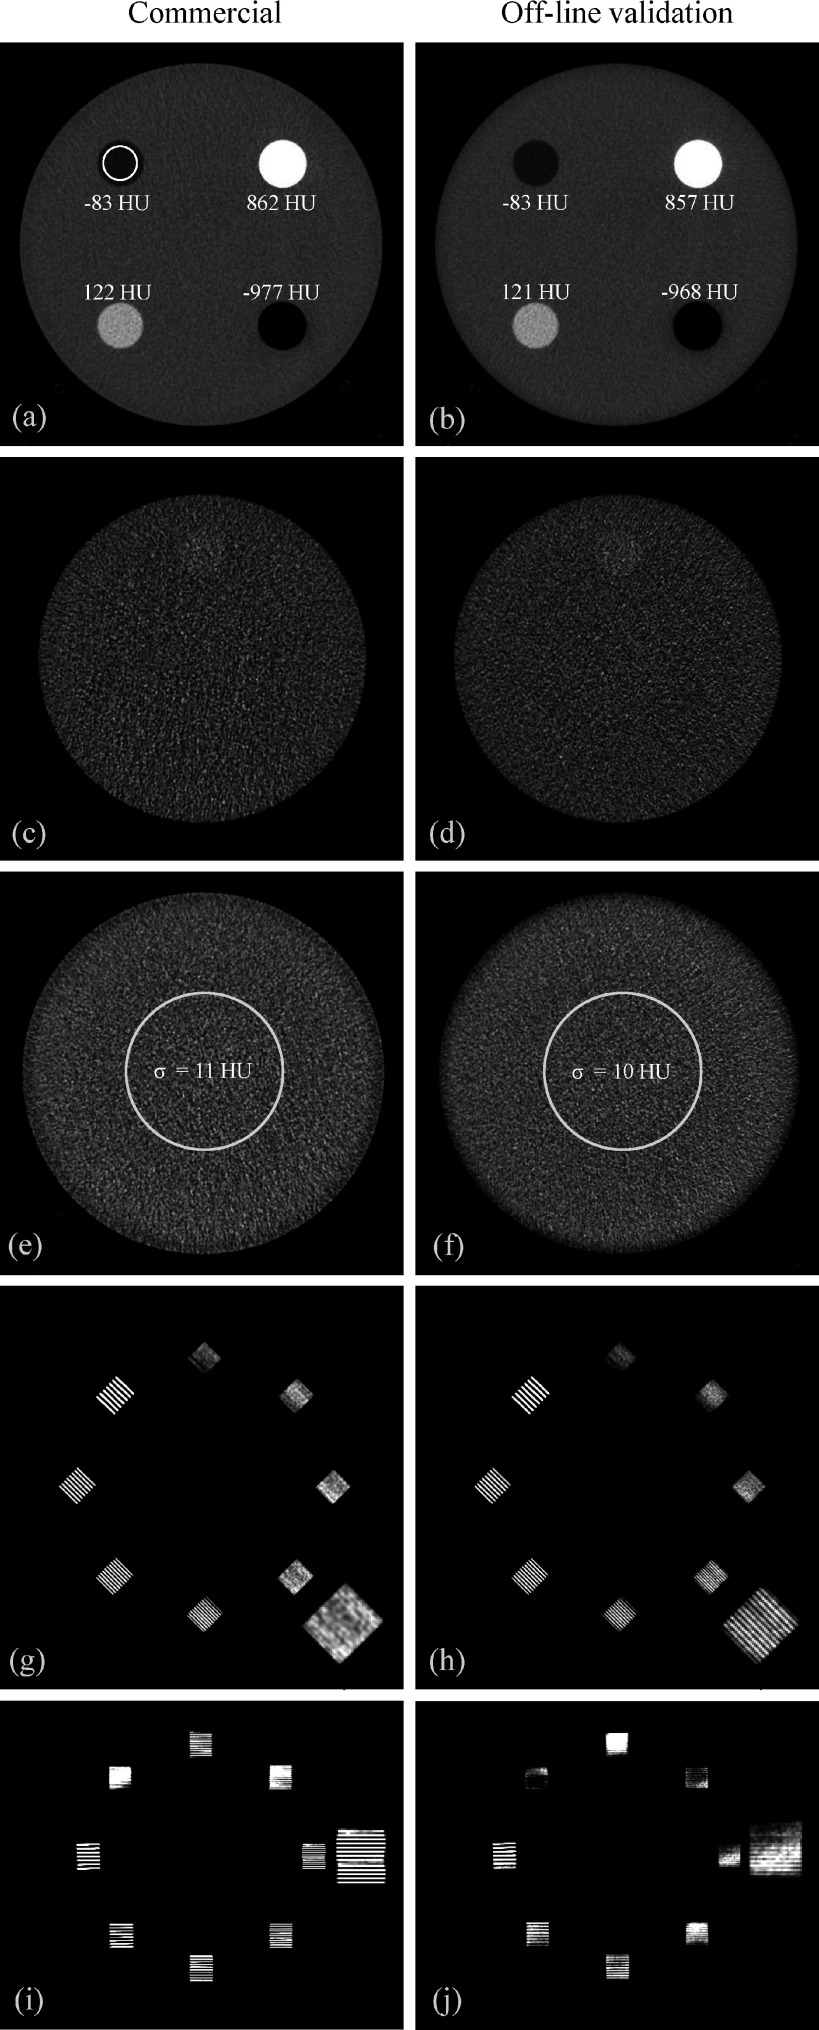
Figure 7 shows the commercial CT images and off-line reconstructed CT images based on data collected from a Siemens scanner in helical mode with use of both in-plane and z-axis flying focal spot. The two sets of images had similar CT numbers, image noise, and low contrast detectability, as summarized in Table I. Off-line reconstructed images by the external researcher had slightly better axial plane resolution than commercial CT images but worse coronal plane resolution, also summarized in Table I. These differences were possibly due to different reconstruction approaches used by Siemens and the external researcher to handle the flying focal spot. In addition, the commercial reconstruction used an edge-enhancing filter.
FIG. 7.
[(a), (c), (e), (g), and (i)] Commercial CT images and [(b), (d), (f), (h), and (j)] images reconstructed off-line by an external researcher, compared in terms of [(a) and (b)] CT number accuracy, [(c) and (d)] low contrast detectability, [(e) and (f)] image noise, [(g) and (h)] high contrast resolution in axial plane, and [(i) and (j)] high contrast resolution in coronal plane. All images are based on data collected on a Siemens scanner in helical mode. Images [(a)–(h)] were acquired with ACR phantom in normal position. Images [(i) and (j)] were acquired with ACR phantom in an upright coronal position to evaluate z-axis resolution.
TABLE I.
Comparisons between the commercial CT images and the images reconstructed off-line by an external researcher in Fig. 7. The ROI used for CT number and image noise measurements are illustrated in Figs. 7(a) and 7(e), respectively.
| Metrics | Commercial | External validation |
|---|---|---|
| CT number (polyethylene) (HU) | −83 ± 0.3 | −83 ± 0.1 |
| CT number (bone) (HU) | 862 ± 0.3 | 857 ± 0.3 |
| CT number (acrylic) (HU) | 122 ± 0.2 | 121 ± 0.2 |
| CT number (air) (HU) | −977 ± 0.2 | −968 ± 0.4 |
| Low contrast detectability | 6 mm rods visible | 6 mm rods visible |
| Image noise (HU) | 11 | 10 |
| High contrast resolution (axial) (lp/mm) | 7 | 8 |
| High contrast resolution (coronal) (lp/mm) | 8 | 6 |
Despite different reconstruction approaches and for two CT scanner manufacturers, the overall image quality was similar between the commercial and off-line reconstructed images, confirming that the geometric parameters and attenuation information provided in DICOM-CT-PD are sufficient for accurate reconstructions.
3.B. Demonstration of potential research utility
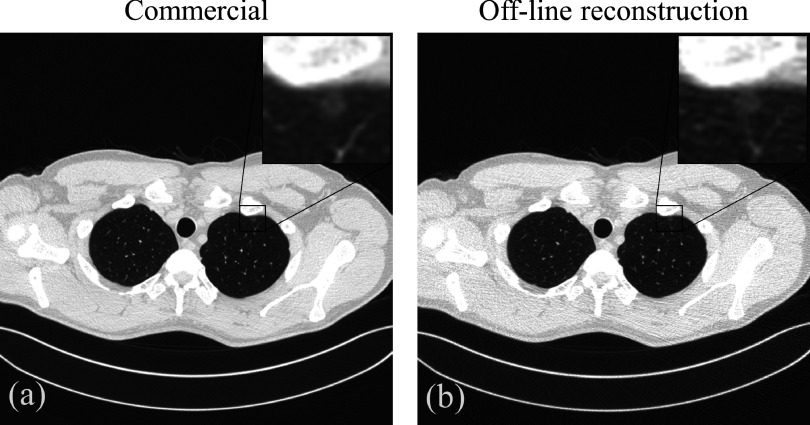
Figure 8 shows the offline reconstruction of a patient’s chest CT projection data in the format of DICOM-CT-PD. The commercial reconstruction from the commercial CT projection data of the same scan is also shown. Because the DICOM-CT-PD projection data were converted from a patient scan, the image demonstrated anatomical complexity at a clinical level. Because the DICOM-CT-PD format also provided information about nodule characteristics and location, additional observer studies could be performed to evaluate the reconstruction algorithm in terms of diagnostic performance.
FIG. 8.
(a) A chest CT image reconstructed from commercial CT projection data using the scanner console. (b) A chest CT image reconstructed from DICOM-CT-PD projection data by an external researcher. The display window width is 1500 HU and the window level is −600 HU.
4. DISCUSSION
Because the formats in which CT projection data are stored are distinctly different and proprietary for each manufacturer, accessing patient projection data from commercial CT scanners has always been a challenge for the CT reconstruction research community. This study developed and validated a vendor-neutral format for CT projection data. Use of this format will facilitate access to patient projection data.
Because DICOM-CT-PD format defines the gantry geometry with tags that were not included in the original DICOM format, the header of the file cannot be correctly read out by standard DICOM readers such as ImageJ (Ref. 9) (the image part of the file that contains the sinogram data can still be correctly read out). However, some DICOM readers such as matlab (Ref. 10) are flexible enough to incorporate a customized DICOM dictionary file that contains tag definitions. For those DICOM readers, once provided with the dictionary file corresponding to the DICOM-CT-PD format, the header part of the file can be correctly read out. In the library of reference patient datasets under development by our team, a matlab script is provided together with the DICOM-CT-PD files to facilitate the reading of the file and the calculation of the geometry.
Because the projection data format uses the DICOM paradigm, it can be easily extended as we get feedback from the community by including more tags. Users can also adopt our format and add customized tags to meet their specific needs.
CT manufacturers often group detector pixels into modules, i.e., place multiple detector pixels in a block.11 As a result, when the detector surface is curved (cylindrical or spherical detectors), the surface of the detector is actually a polygon mesh surface, with each facet consisting of a detector module. At present, the DICOM-CT-PD format does not provide the module grouping information, but instead assumes a perfectly curved surface. There are two reasons for this approximation: (1) the grouping of detector elements is proprietary and unknown to us and (2) the equal-angular assumption, i.e., all detector pixels correspond to the same fan angle, is adequate for most reconstruction algorithms.
This study has several limitations. First, our DICOM-CT-PD format assumed third-generation CT gantry geometry, which means the detector and the x-ray source rotate simultaneously along a circular orbit in the axial plane. Although this assumption works for the majority of state-of-art clinical CT scanners, it may not work for dedicated CT scanners such as multiaxis interventional C-arm systems (e.g., Artis Zeego by Siemens). The format could be expanded to accommodate other dedicated CT scanners by providing the location of individual detector pixels for each projection. Second, the sinogram data decoded from the commercial CT projection data are not the original detector readout, but rather it is the sinogram data after proprietary preprocessing (e.g., gain correction and beam hardening correction). At current stage, we recorded the types of preprocessing that have already been applied to the data in Tags (7039,0010)–(7039,1009). If data without preprocessing become available in future, the DICOM-CT-PD format is flexible enough to accommodate such data and can be further expanded to provide additional information necessary for the user to make his/her own corrections. Third, the original photon statistics are lost by the preprocessing, adding difficulty to the development of statistical iterative reconstruction algorithms. However, we have performed experimental measurements that, when combined with the provided tube current information, allows estimation of a statistical sinogram map, which can be used in the data-dependent weighting term in some iterative reconstruction algorithms. Last, the implementation of our DICOM-CT-PD was validated with projection data of CT scanners with cylindrical detector from two major CT manufacturers. The accuracy of our implementation with detectors of other shapes and from other CT manufacturers awaits further examination.
5. CONCLUSION
A vendor-neutral format has been developed for CT projection data, named DICOM-CT-PD. Reconstruction researchers, both unblinded and blinded to the development of the format, were able to reconstruct the phantom projection data acquired from commercial CT scanners, demonstrating the accuracy and sufficiency of the data stored in DICOM-CT-PD. An additional reconstruction of a patient dataset in the DICOM-CT-PD format demonstrates the utility of this approach for complex clinical datasets. This format is being used to build a reference patient data library, such that CT algorithm researchers can access patient CT projection data and the parameters necessary for image reconstruction. The phantom and patient projection data used to reconstruct Figs. 6–8 are available for use by contacting the authors.
ACKNOWLEDGMENTS
Research reported in this publication was supported by the National Institute of Biomedical Imaging and Bioengineering of the National Institutes of Health under Award No. U01EB017185. The content is solely the responsibility of the authors and does not necessarily represent the official views of the National Institutes of Health. The authors would like to thank Dr. Karl Stierstorfer and Dr. Jiang Hsieh for their assistance in decoding the commercial CT raw data. The authors would like to thank Dr. Guozhi Zhang for his help in reconstructing the GE projection data. The authors would also like to thank Dr. Ken Taguchi for his expert help in reconstructing the Siemens projection data.The authors report no conflicts of interest in conducting the research.
APPENDIX: DICOM-CT-PD TAGS
REFERENCES
- 1.Yu L., Shiung M., Jondal D., and McCollough C. H., “Development and validation of a practical lower-dose-simulation tool for optimizing computed tomography scan protocols,” J. Comput. Assisted Tomogr. 36, 477–487 (2012). 10.1097/RCT.0b013e318258e891 [DOI] [PubMed] [Google Scholar]
- 2.Regensburger J., Mooney D. D., Bush J. R., and Schuetter J. M., A Framework for Expanding DICOM, DICONDE, and DICOS Data Formats to the X-ray CT Image Acquisition Interface, Battelle Memorial Institute, 2012, http://www.battelle.org/docs/health-and-pharmaceutical/reconstruction.pdf?sfvrsn=4, accessed on August 18, 2015.
- 3.Mildenberger P., Eichelberg M., and Martin E., “Introduction to the DICOM standard,” Eur. Radiol. 12, 920–927 (2002). 10.1007/s003300101100 [DOI] [PubMed] [Google Scholar]
- 4.Xu D., Langan D. A., Wu X., Pack J. D., Benson T. M., Tkaczky J. E., and Schmitz A. M., “Dual energy CT via fast kVp switching spectrum estimation,” Proc. SPIE 7258, 72583T (2009). 10.1117/12.811650 [DOI] [Google Scholar]
- 5.Flohr T. G., Stierstorfer K., Ulzheimer S., Bruder H., Primak A. N., and McCollough C. H., “Image reconstruction and image quality evaluation for a 64-slice CT scanner with z-flying focal spot,” Med. Phys. 32, 2536–2547 (2005). 10.1118/1.1949787 [DOI] [PubMed] [Google Scholar]
- 6.McCollough C. H., Bruesewitz M. R., McNitt-Gray M. F., Bush K., Ruckdeschel T., Payne J. T., Brink J. A., and Zeman R. K., “The phantom portion of the American College of Radiology (ACR) computed tomography (CT) accreditation program: Practical tips, artifact examples, and pitfalls to avoid,” Med. Phys. 31, 2423–2442 (2004). 10.1118/1.1769632 [DOI] [PubMed] [Google Scholar]
- 7.Kachelrieß M., Schaller S., and Kalender W. A., “Advanced single-slice rebinning in cone-beam spiral CT,” Med. Phys. 27, 754–772 (2000). 10.1118/1.598938 [DOI] [PubMed] [Google Scholar]
- 8.Taguchi K., Chiang B. S., and Silver M. D., “A new weighting scheme for cone-beam helical CT to reduce the image noise,” Phys. Med. Biol. 49, 2351–2364 (2004). 10.1088/0031-9155/49/11/016 [DOI] [PubMed] [Google Scholar]
- 9.Rasband W. S., Imagej, U. S. National Institutes of Health, Bethesda, MD, 1997-2004, available at http://imagej.nih.gov/ij/.
- 10.matlab Release 2012b, The MathWorks, Inc., Natick, MA, 2012.
- 11.Guery A. V., Huin C., and Sengupta D., “Computed tomography detector module,” U.S. patent US8553834 B2 (8 October 2013).


